47083 Swing-A-Way · Vineland, MN
Flood risk 1/10 · Minimal
- FEMA flood zone
- X (unshaded)
- Chance of flooding over 30 yrs
- 0.0%
- Est. flood insurance / yr
- $473 – $860
Fire risk 3/10 · Minor
- Est. fire insurance / yr
- $888 – $1,650
Heat risk 1/10 · Minimal
- Hot days now (above 93°F)
- 7 days/yr
- Hot days in 30 yrs
- 13 days/yr
Wind risk 2/10 · Minimal
- Chance of severe wind over 30 yrs
- —
Air-quality risk 2/10 · Minimal
- Unhealthy air days now
- 1 days/yr
- Unhealthy air days in 30 yrs
- 1 days/yr
Risk factors via First Street. Map © Google.
Why this score? — see what drove the C- grade
The composite is a weighted blend of 9 inputs, each scored 0–100. Each bar is that input's sub-score; the figure is the points it added to the 100-point composite (weight × sub-score).
- Cash flow +18.2/30.0
- ARV discount +7.5/15.0
- Appreciation +7.2/10.0
- DSCR +5.7/10.0
- 1% rule +4.9/10.0
- Livability +3.1/5.0
- Rent growth +2.5/5.0
- Condition / age +2.5/5.0
- Schools +1.8/10.0
$164,000
🖨 Deal sheet 📄 Offer letter ✓ Due diligence
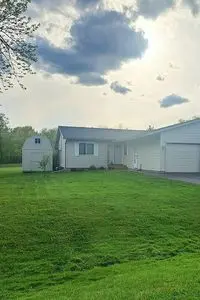
Listing remarks
The home is currently rented and will be available mid-June for showings. Realtors please call for information. Beautiful twin home right on the 10th green of the Northwoods Hills Golf Course and right across the street from Mille Lacs Lake. Perfect starter or retirement home. This is a very energy efficient home and almost everything has been redone in the home. The association fee is only $100 monthly and includes lawn care and snow removal. Owners purchase their own homeowner & acirc; & euro; & trade; s insurance and trash. Dogs of any size are welcome. Some of the many updates done in 2024 are: New knotty alder five panel doors and trim. New entry door, garage service door
Key facts
- New washer and dryer
- New entry door
- New gutters
Tags
Neighborhood map
What this means for you Summary
Snapshot
- This is a 2-bed/1.0-bath other listed at $164k.
Deal economics
- At list price, monthly cash flow is $147 ($2k/yr) — positive.
- The deal already cash-flows at list — no discount required.
- To meet the 1% rule (rent ≥ 1% of price), the offer needs to be $162k (1.2% below list).
- Recommended offer: $162k (1.5% below list) — sets the bar for market timing.
- Cap rate 7.4% vs local median 2.3% in Vineland — top-decile yield for the area; either an underpriced asset or a hidden risk that comps aren't pricing in. Stress-test before assuming the spread holds.
Location & tenants
- Location reads 62/100 on livability (#693 in MN) — a middle-class / working-renter tenant base. Strengths: cost of living A+, housing A+; Watch: health & safety C-, crime D+, schools F.
- Onamia Public School District (rural): math 16% / reading 26% proficiency, ranked #289 of 301 in MN (top 96%) — low school quality limits family demand, transient renter base, plan for 1-2y turnover.
- Market conditions: 71 active listings in the ZIP; 163 units permitted in Mille Lacs County in 2024 (66 in 5+ unit buildings).
Forward outlook
- In year one you build about $8k of equity ($1k loan paydown + $7k appreciation (4.4% local appreciation)).
- Mille Lacs County population projected at -22% by 2050 — secular population decline; favor cash flow + early exit over multi-decade hold.
- At projected returns (4.4% appreciation + 3.0% rent growth), your $46k cash investment doubles in ~5 years — after that, you're playing with house money.
- By year 5, paydown + projected appreciation supports a ~$36k cash-out refi (75% LTV) — recoverable capital for the next deal without selling this one.
Negotiation context
- It's been on market 18 days — a 2% lower offer ($162k) is reasonable based on typical stale-listing flexibility.
- 2 sale attempts since 18y ago with the ask held roughly flat each time — persistent listings suggest the price (not the market) is what's stuck; bring a comps-based counter.
Questions for the listing agent
- Is there a deadline driving the sale (1031 exchange, divorce, estate, relocation)? That informs how much negotiation room exists.
- Schools are F-rated, which usually means shorter tenancies and higher turnover. Who's the typical renter profile here, and what's been the actual vacancy rate?
- Crime grade is D in this area — have there been break-ins, vandalism, or insurance claims at this property in the last 3 years? What carrier currently insures it and at what premium?
- What's the average days-on-market for RENTAL listings here right now (not sales)? A rising rental-DOM trend means longer vacancies and softer asking-rent achievability than the comps imply.
- What's the recent tenant-quality profile in this submarket — average credit score on applications, eviction rate, late-payment / NSF rate, and stable-employment percentage? A property-management company in the area should have these aggregated.
- How much new for-sale + rental construction is in the pipeline within 1–3 miles? Heavy new supply typically softens prices + rents 12–24 months out; constrained supply supports both.
Investment metrics
- 1% rule
- 0.99% ✗
- Cap rate
- 7.37%
- Cash-on-cash
- 3.84%
- DSCR
- 1.17
- GRM
- 8.4
CMA / ARV
No comps found within radius.
Projected returns pro-forma
4.37% appreciation · 3.0% rent growth · sell at horizon
- IRR
- 14.6%
- Equity multiple
- 1.90×
- Total profit
- $41,326
- Equity at exit
- $86,705
- IRR
- 15.5%
- Equity multiple
- 3.61×
- Total profit
- $119,896
- Equity at exit
- $144,725
Cash invested: $45,920 (down + closing). Projections, not guarantees.
Landlord ↔ Tenant lean methodology
- Overall (STATE)
- 46 Balanced
- State Minnesota
- 46 Balanced · D+2
- County
- — inherits STATE
- City
- — inherits STATE
ZIP-level market 56450
- Home prices YoY
- 2.2%
- Active inventory
- 71
- Price-to-rent
- 8.4×
Monthly cashflow live
- Estimated rent
- $1,621 medium interval (Pro) →
- Mortgage (P&I)
- −$860
- Tax est. 1.5%
- −$205 /mo · $2,460/yr
- Insurance
- −$68
- HOA
- −$0
- Vacancy / Maint / Mgmt
- −$340
- Net cashflow
- $147
Break-even live
UW: 25.0% down · 7.5% · 30yr · 1.5% tax · 5.0% vac · 8.0% maint · 8.0% mgmt
Financing live
Cash to close
- Down payment
- $41,000
- Closing costs
- $4,920
- Reserves months
- —
- Total cash needed
- —
Loan-product check · same deal, 3 products live
Conventional
25% down · 7.5% · 30yr
- Down + closing
- —
- Monthly P&I
- —
- Monthly cashflow
- —
- DSCR
- —
- Eligible?
- —
Personal DTI + credit; lowest rate.
DSCR
20% down · 8.5% · 30yr
- Down + closing
- —
- Monthly P&I
- —
- Monthly cashflow
- —
- DSCR
- —
- Eligible?
- —
No personal income docs; deal must DSCR.
Hard money
10% down · 12.0% · 12mo
- Down + closing
- —
- Monthly P&I
- —
- Monthly cashflow
- —
- DSCR
- —
- Eligible?
- —
Short-term bridge; refi at stabilization.
Listing history 13 events
-
2026-06-15days on market $164,000 Active 18 DOM
-
2026-06-14days on market $164,000 Active 16 DOM
-
2026-06-12days on market $164,000 Active 15 DOM
-
2026-06-09days on market $164,000 Active 12 DOM
-
2026-06-08days on market $164,000 Active 11 DOM
-
2026-06-07days on market $164,000 Active 10 DOM
-
2026-06-02days on market $164,000 Active 5 DOM
-
2026-06-01days on market $164,000 Active 4 DOM
-
2026-05-31days on market $164,000 Active 3 DOM
-
2026-05-30days on market $164,000 Active 2 DOM
-
2026-05-29$164,000 Active
-
2008-12-18historical
-
2008-04-18$99,000
ⓘ Source: listings_history table (triggers on properties + properties_extension) + one-shot
backfill from property_details.listing_events for pre-trigger history.
Climate risk First Street
- Flood 1/10 Low FEMA zone X (unshaded) · 0% chance over 30 yrs
- Wildfire 3/10 Moderate
- Heat 1/10 Low 7 d/yr ≥93°F today · 13 d/yr by 30 yrs out
- Wind 2/10 Low
- Air quality 2/10 Low 1 unhealthy d/yr today · 1 by 30 yrs out
Nearby sold comps map
Loading sold comps map…
Walkable amenities ~0.75 mi
Loading nearby amenities…
Taxation est. · year 1
- Rental income
- $19,448
- − Mortgage interest
- −$9,187
- − Property taxes
- −$2,460
- − Insurance
- −$820
- − Repairs & maintenance
- −$1,556
- − Management
- −$1,556
- − Depreciation
- −$4,771
- Taxable loss
- −$901
- Est. tax savings @ 24.0%
- +$216
- After-tax cash flow
- $1,980/yr
For passive investors: Depreciation is non-cash, so a rental often shows a tax loss while cash-flowing — sheltering income. Rental losses are passive: they offset passive income freely, and up to $25,000/yr can offset ordinary (W-2) income if you actively participate and your MAGI is under $100k (phasing out to $0 by $150k); unused losses carry forward. On sale, claimed depreciation is recaptured at up to 25%, and gains may owe capital-gains tax (a 1031 exchange can defer both). Figures are a year-1 estimate at your 24.0% rate — not tax advice; consult a CPA.
Schools (NCES district)
- District
- Onamia Public School District
- NCES district ID
- 2725050
- Math proficiency
- 16% ▼ -11.00%
- Reading proficiency
- 26% ▼ -8.00%
- Median HH income
- $39,743
- Composite
- 17.73/100
- National rank
- #9020
- State rank
- #289 of 301 in MN
Livability — Vineland
- Score
- 62/100
- State rank
- #693
- US rank
- #16675
Category grades
Schools grade is shown separately in the Schools card above.
Census & demographics
- Population (ZIP)
- 969
Population outlook (Mille Lacs County) Hauer SSP2
- Today (2025)
- 24,811 people
- By 2030
- 23,960 · -3.4%
- By 2040
- 21,835 · -12.0%
- By 2050
- 19,376 · -21.9%
- By 2075
- 14,838 · -40.2%
- By 2100
- 11,957 · -51.8%
Race, ethnicity, and origin ACS 2023
- Neighborhood character
- Predominantly White (80%)
- Race & ethnicity
- White 80% Native American 12% Two or more races 7%
- Common ancestry
- Portuguese 12% Romanian 5% Lithuanian 4%
- Foreign-born
- 0% · Canada
- Languages at home
- 95% English-only · Spanish 2%
Political lean MEDSL · Mille Lacs
- 2024 margin
- Solid R (+40.9) · D 28.9% · R 69.7% · Other 1.4%
- 2008→2024 swing
- -33.6pp toward R · 2008: -7.2pp · 2024: -40.9pp
- All cycles
- 2024: R+40.9 2020: R+37.8 2016: R+35.8 2012: R+8.6 2008: R+7.2
Not yet ingested
- Civics
- —
Market trends
- HPI YoY
- ▲ 4.37%
- Current HPI
- 203.4801
- Rent YoY
- —
- Metro
- —
- State GDP YoY
- ▲ 2.41%
- F500 in state
- 34
Industry mix (Fortune 500 HQ in MN)
| Industry | F500 HQs | Revenue |
|---|---|---|
| Healthcare | 2 | $407B |
|
||
| Retail | 2 | $150B |
|
||
| Consumer Goods | 2 | $32B |
|
||
| Industrial Machinery | 2 | $6B |
|
||
| Agriculture | 1 | $40B |
|
||
| Healthcare / Medical Devices | 1 | $32B |
|
||
Price history
+65.7% since first listed3 events — show timeline
- 2026-05-29 Listed $164,000 FSBO.com
- 2008-12-18 Listing Removed — NORTHSTARMLS as Distributed by MLS Grid
- 2008-04-18 Listed $99,000 NORTHSTARMLS as Distributed by MLS Grid
Cash-flow waterfall
monthlySold comps — $/sqft
last 12 mo · ≤1 miLoading sold comps…