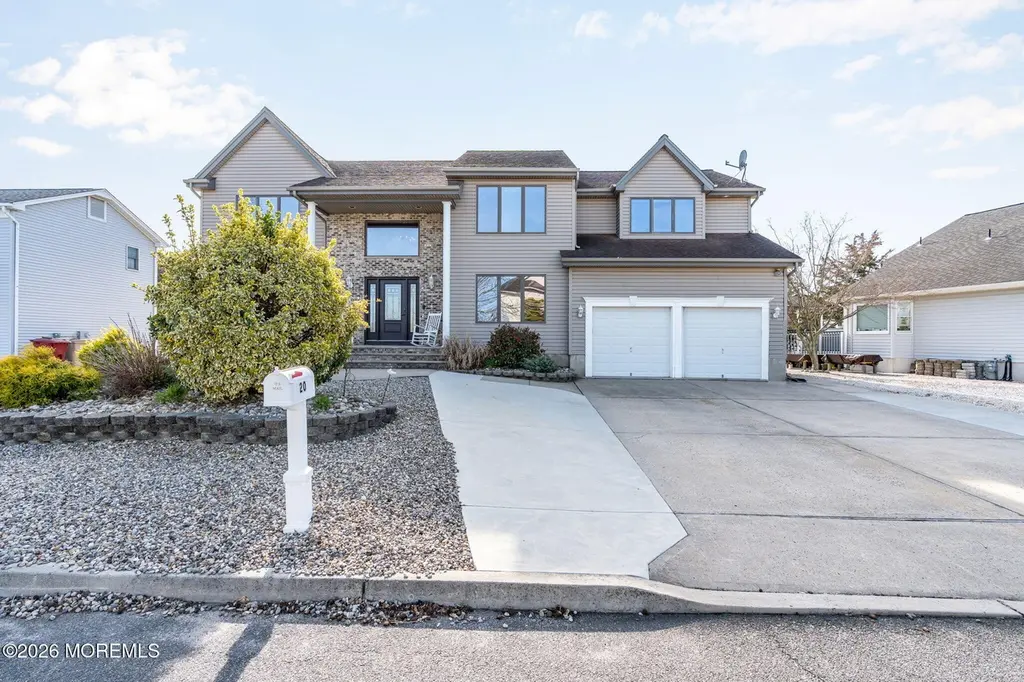
20 Dune Dr · Forked River, NJ
Flood risk 9/10 · Severe
- FEMA flood zone
- AE
- Chance of flooding over 30 yrs
- 0.99%
- Est. flood insurance / yr
- $1,737 – $8,500
Fire risk 4/10 · Minor
- Est. fire insurance / yr
- $526 – $976
Heat risk 7/10 · Major
- Hot days now (above 98°F)
- 7 days/yr
- Hot days in 30 yrs
- 15 days/yr
Wind risk 8/10 · Major
- Chance of severe wind over 30 yrs
- 80.0%
Air-quality risk 3/10 · Minor
- Unhealthy air days now
- 3 days/yr
- Unhealthy air days in 30 yrs
- 3 days/yr
Risk factors via First Street. Map © Google.
Why this score? — see what drove the C grade
The composite is a weighted blend of 9 inputs, each scored 0–100. Each bar is that input's sub-score; the figure is the points it added to the 100-point composite (weight × sub-score).
- Cash flow +29.4/30.0
- DSCR +10.0/10.0
- 1% rule +8.0/10.0
- Livability +3.1/5.0
- Schools +2.6/10.0
- Rent growth +2.5/5.0
- Condition / age +2.5/5.0
- ARV discount +0.0/15.0
- Appreciation +0.0/10.0
$995,000
🖨 Deal sheet 📄 Offer letter ✓ Due diligence
Listing remarks
It's rare to a find such a stunning waterfront home that offers a peaceful and private setting blended with 80+ feet on the water and 3,000+ square foot of living space tucked away in a quiet neighborhood in Bayville that is one of the areas best kept secrets. This custom colonial is just a short ride through Cedar Creek and out to the open bay and offers a bright and open layout on the first floor that takes full advantage of the views and features a stylish and modern eat-in kitchen with a sliding door out to the back deck, formal dining room, cozy living area, den, powder room and large laundry/mud room. The second level consists of 4 bedrooms and 2 full baths, including the impressive a
Key facts
- Custom colonial
- 80 feet on the water
- Waterfront home
Tags
Property features AI
Finance
- HOA & community: No association fees
Exterior
- Parking: Attached 2-car garage
- Utilities: Public sewer
- Home design: Custom model; Fee simple ownership
- Construction: Custom construction
- Exterior features: Shingle roof; Waterfront property with creek and lagoon
Interior
- Kitchen: Wall oven, Counter top range, Dishwasher, Microwave, Refrigerator
- Bedrooms: 4 bedrooms (several located on the second floor)
- Flooring: Wood flooring
- Bathrooms: 2 full bathrooms and 1 half bathroom (total 2.5)
- Heating & cooling: Baseboard heating with 2-zone heat; Central air conditioning with 2-zone AC
- Interior features: Washer, Dryer, Wall Oven, Counter Top Range, Dishwasher, Microwave, Refrigerator; Wood flooring; Crawl space basement
- Laundry & utility: Laundry room on the first floor; Washer and Dryer included
Neighborhood map
What this means for you Summary
Snapshot
- This is a 4-bed/3.0-bath single-family listed at $995k.
Deal economics
- At list price, monthly cash flow is $3k ($37k/yr) — positive.
- The deal already cash-flows at list — no discount required.
- Meets the 1% rule at list price ($13k rent vs $995k).
- Recommended offer: $965k (3.0% below list) — sets the bar for market timing.
- Cap rate 10.5% vs local median 3.2% in Forked River — top-decile yield for the area; either an underpriced asset or a hidden risk that comps aren't pricing in. Stress-test before assuming the spread holds.
Location & tenants
- Location reads 61/100 on livability (#464 in NJ) — a middle-class / working-renter tenant base. Strengths: housing A+, crime A-, employment A-; Watch: amenities F, commute F, cost of living F.
- Central Regional School District (suburban): math 17% / reading 43% proficiency, ranked #357 of 472 in NJ (top 76%) — families likely to look elsewhere, expect single-tenant / working-renter base with shorter leases.
- Market conditions: 175 active listings in the ZIP; 2 comparable units currently listed for rent nearby; 4,434 units permitted in Ocean County in 2024 (868 in 5+ unit buildings).
Forward outlook
- Local home prices are declining (-3.0%/yr); year-one equity from $7k of loan paydown is wiped out by about $30k of value loss. Plan a longer hold.
- Ocean County population projected to shrink 8% by 2050 — rents likely to lag national; underwrite the cash flow, not the appreciation.
- At projected returns (-3.0% appreciation + 3.0% rent growth), your $279k cash investment doubles in ~9 years — after that, you're playing with house money.
Negotiation context
- It's been on market 47 days — a 3% lower offer ($965k) is reasonable based on typical stale-listing flexibility.
- 5 sale attempts since 12y ago with the ask held roughly flat each time — persistent listings suggest the price (not the market) is what's stuck; bring a comps-based counter.
- Current owner paid $545k; list at $995k implies a 83% gain — meaningful room to come down on a strong offer.
Risks & watch-outs
- Watch-outs: flood insurance adds $427/mo.
- Climate carrying-cost: in FEMA flood zone AE (mandatory federal flood insurance); severe wind risk, 80% chance of damaging wind over 30y; extreme-heat days projected 7→15/yr by 2055 (HVAC capex compounding) — expect insurance premiums to compound above CPI over the hold.
Questions for the listing agent
- It's been on market 47 days. Have you received any prior offers? Is the seller open to a 3% concession, seller financing, or rate buy-down credit?
- What's the actual annual flood-insurance premium (NFIP or private), and is the property in a SFHA with mandatory coverage?
- Is there a deadline driving the sale (1031 exchange, divorce, estate, relocation)? That informs how much negotiation room exists.
- What's the average days-on-market for RENTAL listings here right now (not sales)? A rising rental-DOM trend means longer vacancies and softer asking-rent achievability than the comps imply.
- What's the recent tenant-quality profile in this submarket — average credit score on applications, eviction rate, late-payment / NSF rate, and stable-employment percentage? A property-management company in the area should have these aggregated.
- How much new for-sale + rental construction is in the pipeline within 1–3 miles? Heavy new supply typically softens prices + rents 12–24 months out; constrained supply supports both.
Investment metrics
- 1% rule
- 1.30% ✓
- Cap rate
- 10.55%
- Cash-on-cash
- 15.20%
- DSCR
- 1.68
- GRM
- 6.4
CMA / ARV
- ARV (on-the-fly)
- $817,872
- Comps found
- 4
Show comp detail 4 sales within ~0.75 mi
| Address | Dist | Beds/Ba | Sqft | Sold | Price | $/sf | Match |
|---|---|---|---|---|---|---|---|
| 25 Harbor Inn Rd | 0.36mi | 4/3.0 | 2,930 (-5%) | 18mo | $610,000 | $208 | 59 |
| 148 Colleran Pl | 0.58mi | 4/2.5 | 2,816 (-9%) | 14mo | $620,000 | $220 | 44 |
| 185 Harbor Inn Rd | 0.73mi | 5/2.5 (+1) | 2,876 (-7%) | 7mo | $760,000 | $264 | 41 |
| 507 Laurel Blvd | 0.66mi | 5/3.0 (+1) | 2,812 (-9%) | 13mo | $1,575,000 | $560 | 38 |
Match score weights: distance 35% · size 25% · config 20% · recency 20%. Top-matched comps best support the ARV.
Projected returns pro-forma
-3.0% appreciation · 3.0% rent growth · sell at horizon
- IRR
- 3.4%
- Equity multiple
- 1.13×
- Total profit
- $36,659
- Equity at exit
- $148,358
- IRR
- 13.0%
- Equity multiple
- 2.03×
- Total profit
- $287,736
- Equity at exit
- $86,029
Cash invested: $278,600 (down + closing). Projections, not guarantees.
Landlord ↔ Tenant lean methodology
- Overall (STATE)
- 21 Tenant-Leaning
- State New Jersey
- 21 Tenant-Leaning · D+6
- County
- — inherits STATE
- City
- — inherits STATE
ZIP-level market 08721
- Active inventory
- 175
- Price-to-rent
- 6.4×
Monthly cashflow live
- Estimated rent
- $12,966 medium interval (Pro) →
- Mortgage (P&I)
- −$5,218
- Tax from tax record
- −$1,083 /mo · $12,997/yr
- Insurance
- −$415
- Flood insurance flood zone
- −$427 /mo · $5,118/yr
- HOA
- −$0
- Vacancy / Maint / Mgmt
- −$2,723
- Net cashflow
- $3,101
Break-even live
UW: 25.0% down · 7.5% · 30yr · 1.5% tax · 5.0% vac · 8.0% maint · 8.0% mgmt
Financing live
Cash to close
- Down payment
- $248,750
- Closing costs
- $29,850
- Reserves months
- —
- Total cash needed
- —
Loan-product check · same deal, 3 products live
Conventional
25% down · 7.5% · 30yr
- Down + closing
- —
- Monthly P&I
- —
- Monthly cashflow
- —
- DSCR
- —
- Eligible?
- —
Personal DTI + credit; lowest rate.
DSCR
20% down · 8.5% · 30yr
- Down + closing
- —
- Monthly P&I
- —
- Monthly cashflow
- —
- DSCR
- —
- Eligible?
- —
No personal income docs; deal must DSCR.
Hard money
10% down · 12.0% · 12mo
- Down + closing
- —
- Monthly P&I
- —
- Monthly cashflow
- —
- DSCR
- —
- Eligible?
- —
Short-term bridge; refi at stabilization.
Rent comps 2 comps
| Address | Beds | Baths | Sqft | Rent | $/sqft | DOM | Units | Dist |
|---|---|---|---|---|---|---|---|---|
| 821 Bunnell St Lanoka Harbor, NJ | 5.0 | 3.5 | 3012 | $20,000 | $6.64 | 15d | 1 | 0.92mi |
| 605 Farrelly Ave Bayville, NJ | 5.0 | 3.0 | 2274 | $3,500 | $1.54 | 43d | 1 | 0.94mi |
Listing history 15 events
-
2026-04-11$995,000 Active
-
2020-04-27soldstatus $545,000
-
2020-04-22soldstatus $545,000 Sold
-
2020-03-03status Pending
-
2020-02-27$545,000 Active
-
2020-02-13historical
-
2019-09-14price $589,900
-
2019-08-09$624,900 Active
-
2014-04-29soldstatus $465,000
-
2014-04-23soldstatus $465,000
-
2014-04-23soldstatus $465,000
-
2014-01-13$499,900
-
2014-01-13$499,900
-
1992-02-13soldstatus $80,000
-
1991-07-23soldstatus $86,500
ⓘ Source: listings_history table (triggers on properties + properties_extension) + one-shot
backfill from property_details.listing_events for pre-trigger history.
Tax reassessment forecast NJ · Partial reset (capped growth)
- Current annual tax
- $12,997 · $1,083/mo
- Projected year-2 tax
- $18,886 · $1,574/mo
- Expected delta
- +$5,889/yr (+$491/mo · 45.3%)
ⓘ Screening estimate from a state-policy table — verify with the county assessor before closing.
Climate risk First Street
- Flood 9/10 Extreme FEMA zone AE · 99% chance over 30 yrs
- Wildfire 4/10 Moderate
- Heat 7/10 Severe 7 d/yr ≥98°F today · 15 d/yr by 30 yrs out
- Wind 8/10 Severe 80% chance of damaging wind over 30 yrs
- Air quality 3/10 Moderate 3 unhealthy d/yr today · 3 by 30 yrs out
Nearby sold comps map
Loading sold comps map…
Walkable amenities ~0.75 mi
Loading nearby amenities…
Taxation est. · year 1
- Rental income
- $155,598
- − Mortgage interest
- −$55,735
- − Property taxes
- −$12,997
- − Insurance
- −$10,094
- − Repairs & maintenance
- −$12,448
- − Management
- −$12,448
- − Depreciation
- −$28,945
- Taxable income
- $22,931
- Est. tax owed @ 24.0%
- −$5,503
- After-tax cash flow
- $31,714/yr
For passive investors: Depreciation is non-cash, so a rental often shows a tax loss while cash-flowing — sheltering income. Rental losses are passive: they offset passive income freely, and up to $25,000/yr can offset ordinary (W-2) income if you actively participate and your MAGI is under $100k (phasing out to $0 by $150k); unused losses carry forward. On sale, claimed depreciation is recaptured at up to 25%, and gains may owe capital-gains tax (a 1031 exchange can defer both). Figures are a year-1 estimate at your 24.0% rate — not tax advice; consult a CPA.
Schools (NCES district)
- District
- Central Regional School District
- NCES district ID
- 3402910
- Math proficiency
- 17% ▼ -14.00%
- Reading proficiency
- 43% ▲ 7.00%
- Median HH income
- $44,676
- Composite
- 25.59/100
- National rank
- #7422
- State rank
- #357 of 472 in NJ
Livability — Forked River
- Score
- 61/100
- State rank
- #464
- US rank
- #17753
Category grades
Schools grade is shown separately in the Schools card above.
Census & demographics
- Population (ZIP)
- 22,464
Population outlook (Ocean County) Hauer SSP2
- Today (2025)
- 586,991 people
- By 2030
- 581,403 · -1.0%
- By 2040
- 564,913 · -3.8%
- By 2050
- 538,149 · -8.3%
- By 2075
- 468,845 · -20.1%
- By 2100
- 350,297 · -40.3%
Race, ethnicity, and origin ACS 2023
- Neighborhood character
- Predominantly White (83%)
- Race & ethnicity
- White 83% Hispanic / Latino 8% Two or more races 6% Asian 4% Black 2%
- Hispanic origin (detail)
- Puerto Rican 3%
- Common ancestry
- Romanian 7% Scotch-Irish 2% Slovak 2%
- Foreign-born
- 7% · Canada, South Korea, Jamaica
- Languages at home
- 90% English-only · Spanish 4% Other Indo-European 2% Tagalog/Filipino 2%
Political lean MEDSL · Ocean
- 2024 margin
- Solid R (+36.0) · D 31.4% · R 67.4% · Other 1.2%
- 2008→2024 swing
- -17.6pp toward R · 2008: -18.4pp · 2024: -36.0pp
- All cycles
- 2024: R+36.0 2020: R+28.7 2016: R+34.0 2012: R+17.7 2008: R+18.4
Not yet ingested
- Civics
- —
Market trends
- HPI YoY
- ▼ -320.09%
- Current HPI
- 346.8393
- Rent YoY
- —
- Metro
- —
- State GDP YoY
- ▲ 2.05%
- F500 in state
- 34
Industry mix (Fortune 500 HQ in NJ)
| Industry | F500 HQs | Revenue |
|---|---|---|
| Consumer Goods | 3 | $31B |
|
||
| Pharmaceuticals | 2 | $153B |
|
||
| Technology | 2 | $21B |
|
||
| Insurance | 2 | $20B |
|
||
| Healthcare | 2 | $19B |
|
||
| Financial Services | 1 | $70B |
|
||
Price history
+1050.3% since first listed15 events — show timeline
- 2026-04-11 Listed $995,000 MOMLS
- 2020-04-27 Sold (Public Records) $545,000 Public Records
- 2020-04-22 Sold (MLS) $545,000 MOMLS
- 2020-03-03 Pending — MOMLS
- 2020-02-27 Listed $545,000 MOMLS
- 2020-02-13 Delisted — MOMLS
- 2019-09-14 Price Changed $589,900 MOMLS
- 2019-08-09 Listed $624,900 MOMLS
- 2014-04-29 Sold (Public Records) $465,000 Public Records
- 2014-04-23 Sold (MLS) $465,000 BRIGHT MLS
- 2014-04-23 Sold (MLS) $465,000 MOMLS
- 2014-01-13 Listed $499,900 BRIGHT MLS
- 2014-01-13 Listed $499,900 MOMLS
- 1992-02-13 Sold (Public Records) $80,000 Public Records
- 1991-07-23 Sold (Public Records) $86,500 Public Records
Property tax history
+3.0%/yrLatest (2025): $12,997 · +7.4% YoY. Source: county tax records.
Cash-flow waterfall
monthlySold comps — $/sqft
last 12 mo · ≤1 miLoading sold comps…