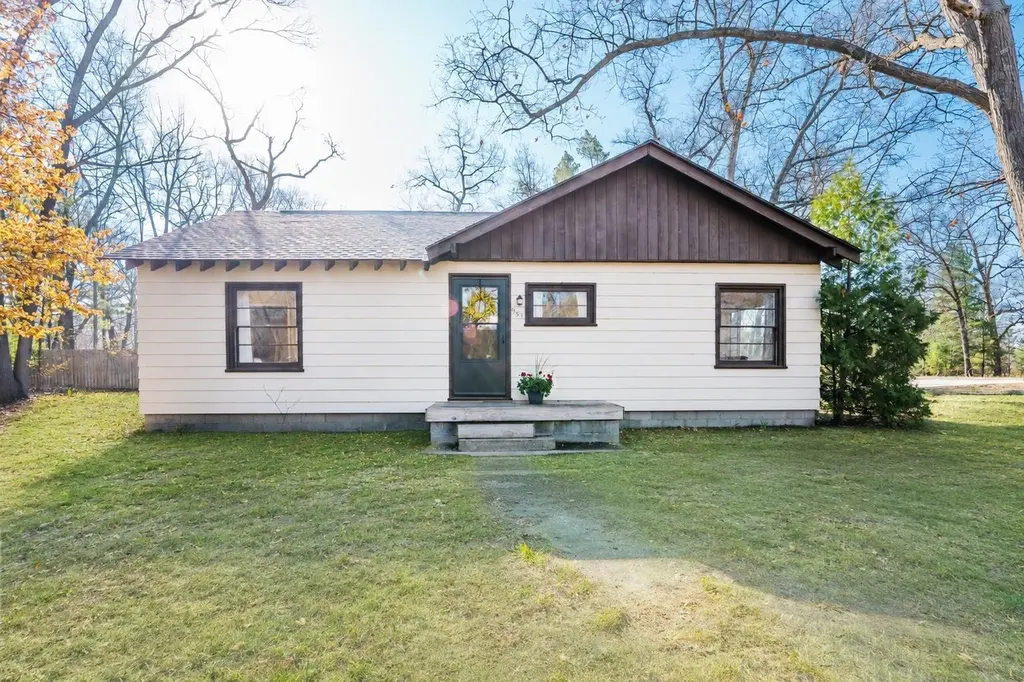
951 Tamarack St Lot : 20 · Traverse City, MI
Flood risk 1/10 · Minimal
- FEMA flood zone
- X (unshaded)
- Chance of flooding over 30 yrs
- 0.0%
- Est. flood insurance / yr
- $507 – $1,088
Fire risk 2/10 · Minimal
- Est. fire insurance / yr
- $784 – $1,456
Heat risk 1/10 · Minimal
- Hot days now (above 94°F)
- 7 days/yr
- Hot days in 30 yrs
- 14 days/yr
Wind risk 1/10 · Minimal
- Chance of severe wind over 30 yrs
- —
Air-quality risk 2/10 · Minimal
- Unhealthy air days now
- 1 days/yr
- Unhealthy air days in 30 yrs
- 1 days/yr
Risk factors via First Street. Map © Google.
Why this score? — see what drove the C- grade
The composite is a weighted blend of 9 inputs, each scored 0–100. Each bar is that input's sub-score; the figure is the points it added to the 100-point composite (weight × sub-score).
- ARV discount +15.0/15.0
- Cash flow +14.3/30.0
- Livability +4.5/5.0
- DSCR +4.4/10.0
- Schools +4.4/10.0
- 1% rule +4.0/10.0
- Condition / age +3.8/5.0
- Rent growth +2.4/5.0
- Appreciation +0.0/10.0
$220,000
🖨 Deal sheet (PDF) 📄 Offer letter ✓ Due diligence
Listing remarks
East side opportunity in the Pinegrove neighborhood! This 1950s ranch offers main-floor living with 3 bedrooms and 1 full bath, set on a desirable corner lot. Refinished hardwood floors (2020) run through the living room and bedrooms, and the home features a full basement providing additional space and storage. New roof already completed. Patio off the home for outdoor enjoyment. Ideal for buyers looking to add their own updates, this property offers solid potential in a sought-after location. Just steps from the TART Trail and close to the state park and beach, with convenient access to town while benefiting from East Bay Township taxes.
Key facts
- Full basement
- Patio
- Main-floor living
Tags
Property features AI
Exterior
- Utilities: Public water; Community sewer; Cable available
- Home design: Residential, single-story home (1 story); Built in 1949; Below-grade area present (unfinished); Entry lot identified as Lot 20
- Construction: Wood construction; Built in 1949; Full, unfinished basement with block construction and egress/daylight windows, interior access
- Exterior features: Wood exterior; Covered porch; Subdivision lot with wooded surroundings
Interior
- Kitchen: 8 x 8 kitchen; Range/oven; Microwave; Refrigerator; Freezer
- Bedrooms: Main floor bedroom; Bedroom sizes approximately 11'3" x 9', 11' x 9', and 9' (all on the main level); Wood flooring in bedrooms
- Flooring: Wood flooring in living, dining and bedrooms; Concrete flooring in laundry room
- Bathrooms: One full bathroom (main level)
- Heating & cooling: Forced air heating; Natural gas heat; Gas water heater
- Interior features: Bay window
- Laundry & utility: Washer and dryer; Laundry room on the lower level with concrete floor
Neighborhood map
What this means for you Summary
Snapshot
- This is a 3-bed/1.0-bath single-family listed at $220k. Condition is rated good.
Deal economics
- At list price, monthly cash flow is $41 ($497/yr) — positive.
- The deal already cash-flows at list — no discount required.
- To meet the 1% rule (rent ≥ 1% of price), the offer needs to be $198k (10.1% below list).
- Recommended offer: $198k (10.1% below list) — sets the bar for 1% rule.
- Cap rate 6.5% vs local median 1.1% in Traverse City — top-decile yield for the area; either an underpriced asset or a hidden risk that comps aren't pricing in. Stress-test before assuming the spread holds.
Location & tenants
- Location reads 91/100 on livability (#4 in MI, #46 nationally) — a professional / high-income tenant draw. Strengths: amenities A+, commute A+, housing A+.
- Traverse City Area Public Schools (town): math 45% / reading 56% proficiency, ranked #94 of 540 in MI (top 17%) — acceptable for families but not a draw, mixed tenant base, ~2y average lease.
- Zoned schools: Eastern Elementary School (math 47% / reading 57%, grade C-, #328 of 1,397 statewide, top 26%, 454 students, 27% FRL); East Middle School (math 45% / reading 55%, grade C, #117 of 493 statewide, top 25%, 786 students, 38% FRL); Central High School (math 52% / reading 72%, grade B-, #58 of 713 statewide, top 9%, 1,387 students, 29% FRL) — zoned schools at 31% FRL track the district average.
- Market conditions: Rents soft (-0.5%/yr); 330 active listings in the ZIP; 1 comparable units currently listed for rent nearby; 883 units permitted in Grand Traverse County in 2024 (501 in 5+ unit buildings).
- This rent runs 33% of the median local income ($72k/yr) — at the standard rent-burdened threshold; future hikes will face affordability resistance.
Forward outlook
- Local home prices are declining (-3.0%/yr); year-one equity from $2k of loan paydown is wiped out by about $7k of value loss. Plan a longer hold.
- Grand Traverse County population projected at +20% by 2050 — long-run rental-demand tailwind backs the buy-and-hold thesis.
Negotiation context
- Only 5 days on market — expect competitive offers; lowballing is unlikely to land.
Risks & watch-outs
- Watch-outs: built in 1949 — expect roof / HVAC / electrical / plumbing capex.
Questions for the listing agent
- Built in 1949 — when were the roof, HVAC, electrical panel, plumbing, and water heater last replaced?
- Is there a deadline driving the sale (1031 exchange, divorce, estate, relocation)? That informs how much negotiation room exists.
- Schools are A-rated — typically a magnet for longer-tenancy family renters. What's the average tenant stay here, and is there a school-zone premium baked into asking?
- What's the average days-on-market for RENTAL listings here right now (not sales)? A rising rental-DOM trend means longer vacancies and softer asking-rent achievability than the comps imply.
- What's the recent tenant-quality profile in this submarket — average credit score on applications, eviction rate, late-payment / NSF rate, and stable-employment percentage? A property-management company in the area should have these aggregated.
- How much new for-sale + rental construction is in the pipeline within 1–3 miles? Heavy new supply typically softens prices + rents 12–24 months out; constrained supply supports both.
Investment metrics
- 1% rule
- 0.90% ✗
- Cap rate
- 6.52%
- Cash-on-cash
- 0.81%
- DSCR
- 1.04
- GRM
- 9.3
CMA / ARV
- ARV (on-the-fly)
- $316,260
- Comps found
- 7
Show comp detail 7 sales within ~0.75 mi
| Address | Dist | Beds/Ba | Sqft | Sold | Price | $/sf | Match |
|---|---|---|---|---|---|---|---|
| 951 Tamarack St | 0.00mi | 3/1.0 | 1,004 (0%) | 1mo | $252,000 | $251 | 100 |
| 951 Tamarack St Lot : 20 | 0.00mi | 3/1.0 | 1,004 (0%) | 1mo | $252,000 | $251 | 100 |
| 877 Parsons Rd | 0.37mi | 3/1.0 | 967 (-4%) | 2mo | $305,000 | $315 | 75 |
| 928 Avenue E | 0.12mi | 3/1.0 | 906 (-10%) | 8mo | $350,000 | $386 | 72 |
| 966 Avenue D | 0.19mi | 3/1.0 | 1,069 (+6%) | 17mo | $313,600 | $293 | 66 |
| 870 Pine Grove Ave | 0.35mi | 3/1.0 | 936 (-7%) | 16mo | $305,000 | $326 | 60 |
| 880 Pine Grove Ave | 0.40mi | 2/1.0 (-1) | 864 (-14%) | 23mo | $320,000 | $370 | 34 |
Match score weights: distance 35% · size 25% · config 20% · recency 20%. Top-matched comps best support the ARV.
Projected returns pro-forma
-3.0% appreciation · 0.0% rent growth · sell at horizon
- IRR
- -18.4%
- Equity multiple
- 0.37×
- Total profit
- $-38,775
- Equity at exit
- $32,803
- IRR
- -18.2%
- Equity multiple
- 0.15×
- Total profit
- $-52,636
- Equity at exit
- $19,022
Cash invested: $61,600 (down + closing). Projections, not guarantees.
Landlord ↔ Tenant lean methodology
- Overall (STATE)
- 62 Landlord-Friendly
- State Michigan
- 62 Landlord-Friendly · EVEN
- County
- — inherits STATE
- City
- — inherits STATE
ZIP-level market 49686
- Rents YoY
- -0.5%
- Active inventory
- 330
- Price-to-rent
- 9.3×
Monthly cashflow live
- Estimated rent
- $1,977 medium interval (Pro) →
- Mortgage (P&I)
- −$1,154
- Tax est. 1.5%
- −$275 /mo · $3,300/yr
- Insurance
- −$92
- HOA
- −$0
- Vacancy / Maint / Mgmt
- −$415
- Net cashflow
- $41
Break-even live
Sensitivity live
| Price | -10% $193 | -5% $117 | +0% $41 | +5% $-35 | +10% $-111 |
|---|---|---|---|---|---|
| Rent | -10% $-115 | -5% $-37 | +0% $41 | +5% $120 | +10% $198 |
| Rate | -1.0pp $152 | -0.5pp $97 | base $41 | +0.5pp $-16 | +1.0pp $-74 |
UW: 25.0% down · 7.5% · 30yr · 1.5% tax · 5.0% vac · 8.0% maint · 8.0% mgmt
Financing live
Cash to close
- Down payment
- $55,000
- Closing costs
- $6,600
- Reserves months
- —
- Total cash needed
- —
Loan-product check · same deal, 3 products live
Conventional
25% down · 7.5% · 30yr
- Down + closing
- —
- Monthly P&I
- —
- Monthly cashflow
- —
- DSCR
- —
- Eligible?
- —
Personal DTI + credit; lowest rate.
DSCR
20% down · 8.5% · 30yr
- Down + closing
- —
- Monthly P&I
- —
- Monthly cashflow
- —
- DSCR
- —
- Eligible?
- —
No personal income docs; deal must DSCR.
Hard money
10% down · 12.0% · 12mo
- Down + closing
- —
- Monthly P&I
- —
- Monthly cashflow
- —
- DSCR
- —
- Eligible?
- —
Short-term bridge; refi at stabilization.
Rent comps 1 comps
| Address | Beds | Baths | Sqft | Rent | $/sqft | DOM | Units | Dist |
|---|---|---|---|---|---|---|---|---|
| 426 Munson Pl Unit 426-203 Traverse City, MI | 2.0 | 2.0 | 950 | $1,395 | $1.47 | 45d | 1 | 1.05mi |
Listing history 3 events
-
2026-05-13status Pending
-
2026-05-12historical Accepting Backup Offers
-
2026-05-08$220,000 Active
ⓘ Source: listings_history table (triggers on properties + properties_extension) + one-shot
backfill from property_details.listing_events for pre-trigger history.
Climate risk First Street
- Flood 1/10 Low FEMA zone X (unshaded) · 0% chance over 30 yrs
- Wildfire 2/10 Low
- Heat 1/10 Low 7 d/yr ≥94°F today · 14 d/yr by 30 yrs out
- Wind 1/10 Low
- Air quality 2/10 Low 1 unhealthy d/yr today · 1 by 30 yrs out
Nearby sold comps map
Loading sold comps map…
Walkable amenities ~0.75 mi
Loading nearby amenities…
Taxation est. · year 1
- Rental income
- $23,724
- − Mortgage interest
- −$12,323
- − Property taxes
- −$3,300
- − Insurance
- −$1,100
- − Repairs & maintenance
- −$1,898
- − Management
- −$1,898
- − Depreciation
- −$6,400
- Taxable loss
- −$3,196
- Est. tax savings @ 24.0%
- +$767
- After-tax cash flow
- $1,264/yr
For passive investors: Depreciation is non-cash, so a rental often shows a tax loss while cash-flowing — sheltering income. Rental losses are passive: they offset passive income freely, and up to $25,000/yr can offset ordinary (W-2) income if you actively participate and your MAGI is under $100k (phasing out to $0 by $150k); unused losses carry forward. On sale, claimed depreciation is recaptured at up to 25%, and gains may owe capital-gains tax (a 1031 exchange can defer both). Figures are a year-1 estimate at your 24.0% rate — not tax advice; consult a CPA.
Condition & rehab AI · 12 photos
This 1950s ranch offers main-floor living with 3 bedrooms and 1 full bath, set on a desirable corner lot. The home features refinished hardwood floors and a new roof, making it a good candidate for cosmetic updates to enhance its resale and rental value.
Repairs flagged
- Minor kitchen countertops — Simple, dated design
- Minor bathroom fixtures — Simple design
Value-add opportunities
- Resale Paint interior walls — Fresh paint enhances curb appeal
- Resale Replace kitchen countertops — Modern countertops improve functionality and aesthetics
- Both Add smart home features — Enhances both resale and rental value
- Both Landscaping improvements — Enhances curb appeal and adds value
Renovation cost estimate screening
| Repair item | Severity | Est. cost |
|---|---|---|
| kitchen countertops · Simple, dated design | Minor | $500–3,000 |
| bathroom fixtures · Simple design | Minor | $500–3,000 |
| Total estimated repair cost · 2 items | $1,000–6,000 |
Value-add ROI direction
- Resale Paint interior walls — Fresh paint enhances curb appeal ↑
- Resale Replace kitchen countertops — Modern countertops improve functionality and aesthetics ↑
- Both Add smart home features — Enhances both resale and rental value ↑
- Both Landscaping improvements — Enhances curb appeal and adds value ↑
ⓘ Cost ranges are severity-bucket heuristics (US national rule-of-thumb). Get contractor quotes + a written scope before underwriting a rehab budget.
Schools (NCES district)
- District
- Traverse City Area Public Schools
- NCES district ID
- 2633870
- Math proficiency
- 45% ▼ -3.00%
- Reading proficiency
- 56% ▼ -6.00%
- Median HH income
- $53,645
- Composite
- 43.51/100
- National rank
- #2990
- State rank
- #94 of 540 in MI
Livability — Traverse City
- Score
- 91/100
- State rank
- #4
- US rank
- #46
Category grades
Schools grade is shown separately in the Schools card above.
Census & demographics
- County
- Grand Traverse County · 47,077 people
- City population
- 47,077
- Metro
- Traverse City, MI
- Population (ZIP)
- 25,492
- Household income
- $71,609
- Rent vs Own
- Severe rent burden
- 676.0
Population outlook (Grand Traverse County) Hauer SSP2
- Today (2025)
- 102,241 people
- By 2030
- 107,172 · +4.8%
- By 2040
- 115,676 · +13.1%
- By 2050
- 122,377 · +19.7%
- By 2075
- 136,554 · +33.6%
- By 2100
- 137,871 · +34.8%
Race, ethnicity, and origin ACS 2023
- Neighborhood character
- Predominantly White (91%)
- Race & ethnicity
- White 91% Two or more races 6% Hispanic / Latino 5% Native American 1%
- Hispanic origin (detail)
- Mexican 4%
- Common ancestry
- Romanian 11% Lithuanian 5% Slovak 4%
- Foreign-born
- 2% · Canada
- Languages at home
- 96% English-only · Spanish 3%
Political lean MEDSL · Grand Traverse
- 2024 margin
- Toss-up / Even · D 48.3% · R 50.1% · Other 1.6%
- 2008→2024 swing
- +1.3pp toward D · 2008: -3.0pp · 2024: -1.7pp
- All cycles
- 2024: R+1.7 2020: R+3.0 2016: R+12.5 2012: R+11.8 2008: R+3.0
Not yet ingested
- Civics
- —
Market trends
- HPI YoY
- ▼ -276.28%
- Current HPI
- 352.4866
- Rent YoY
- ▼ -0.49%
- Metro
- Traverse City, MI
- State GDP YoY
- ▲ 1.37%
- F500 in state
- 28
Industry mix (Fortune 500 HQ in MI)
| Industry | F500 HQs | Revenue |
|---|---|---|
| Automotive Parts | 3 | $48B |
|
||
| Automotive | 2 | $372B |
|
||
| Chemicals | 1 | $45B |
|
||
| Automotive Retail | 1 | $29B |
|
||
| Healthcare / Medical Devices | 1 | $23B |
|
||
| Automotive Technology | 1 | $20B |
|
||
Price history
3 events — show timeline
- 2026-05-13 Pending — MiRealSource-MiMLS
- 2026-05-12 Contingent — MiRealSource-MiMLS
- 2026-05-08 Listed $220,000 MiRealSource-MiMLS
Cash-flow waterfall
monthlySold comps — $/sqft
last 12 mo · ≤1 miLoading sold comps…