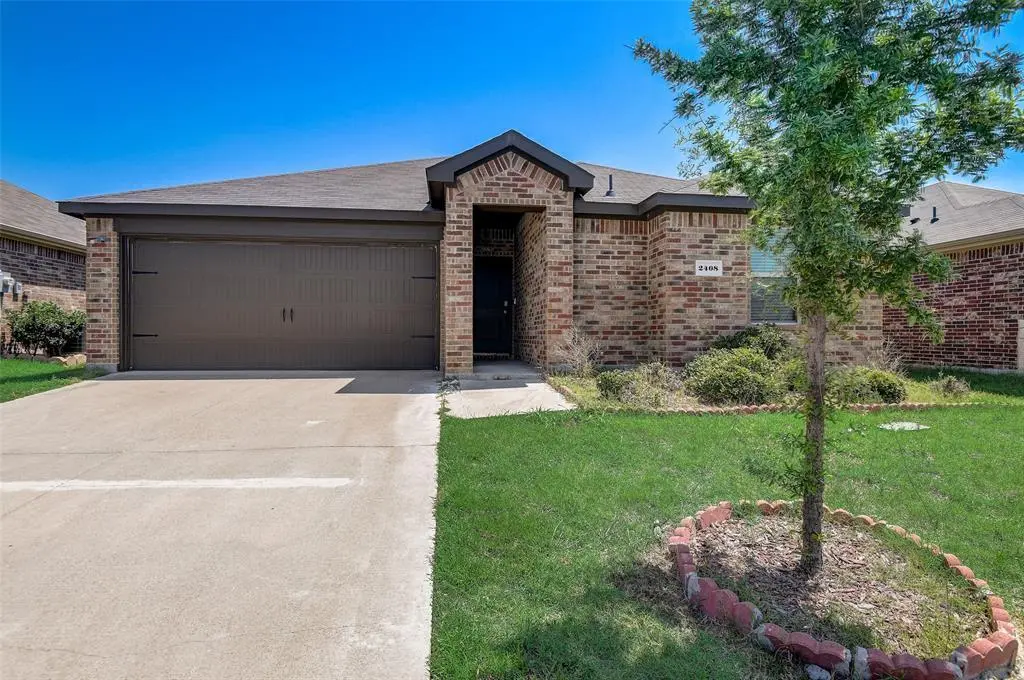
2408 Anton Dr · Travis Ranch, TX
Flood risk 1/10 · Minimal
- FEMA flood zone
- X (unshaded)
- Chance of flooding over 30 yrs
- 0.0%
- Est. flood insurance / yr
- $507 – $1,088
Fire risk 3/10 · Minor
- Est. fire insurance / yr
- $1,222 – $2,270
Heat risk 8/10 · Major
- Hot days now (above 110°F)
- 7 days/yr
- Hot days in 30 yrs
- 25 days/yr
Wind risk 6/10 · Moderate
- Chance of severe wind over 30 yrs
- 27.0%
Air-quality risk 2/10 · Minimal
- Unhealthy air days now
- 1 days/yr
- Unhealthy air days in 30 yrs
- 1 days/yr
Risk factors via First Street. Map © Google.
Why this score? — see what drove the D grade
The composite is a weighted blend of 9 inputs, each scored 0–100. Each bar is that input's sub-score; the figure is the points it added to the 100-point composite (weight × sub-score).
- ARV discount +13.5/15.0
- Cash flow +10.8/30.0
- 1% rule +5.0/10.0
- Schools +4.0/10.0
- DSCR +3.1/10.0
- Livability +3.1/5.0
- Rent growth +2.9/5.0
- Condition / age +2.5/5.0
- Appreciation +0.0/10.0
$204,900
🖨 Deal sheet (PDF) 📄 Offer letter ✓ Due diligence
Listing remarks MLS
This fabulous single story has great curb appeal, livable floorplan, and no wasted space. The light & bright living room and kitchen makes entertaining a breeze offering an open airy feel while still emitting a sense of warmth & coziness. This kitchen is a chef's delight offering a large center island & comes equipped with stainless appliances, recessed lighting, pantry, and granite countertops! The private primary suite is split from the other bedrooms & features an en-suite bath with a walk-in shower & large walk-in closet! Enjoy this private backyard with a covered patio and plenty of grass space for a trampoline, playscape, and entertaining friends and family! Fabulous community amenities to keep the whole family busy! Lake enthusiasts will love being near Lake Ray Hubbard for fun-filled weekends on the water! A must see! Home has solar panels that need to convey with the home. Seller will give a $5k credit to buyer.
Key facts
- Granite counter tops
- Great sized backyard
- Open-concept layout
Tags
Property features AI
Finance
- HOA & community: Mandatory association; Annual HOA fee of 409; HOA covers full use of facilities; HOA managed by Essex Management
Exterior
- Parking: Attached 2-car garage; 2 covered parking spaces
- Utilities: City water; City sewer; Electricity available; Located in a municipal utility district
- Home design: Single-family residence; Attached property; One story; Built in 2019
- Construction: Year built: 2019
- Exterior features: Lot under 0.5 acre (approximately 0.128 acre); Subdivision: Travis Ranch Ph 2g
Interior
- Kitchen: Dishwasher; Disposal; Microwave
- Bedrooms: 3 bedrooms (primary bedroom on level 1)
- Bathrooms: 2 full bathrooms
- Heating & cooling: Electric heating; Electric cooling
- Interior features: Granite counters; One living area; One dining area; Room count: 2
Neighborhood map
What this means for you Summary
Snapshot
- This is a 3-bed/2.0-bath single-family listed at $205k.
Deal economics
- At list price, monthly cash flow is $-93 ($-1k/yr) — negative.
- To cash-flow at today's rent, offer at most $188k (8.0% below list).
- To meet the 1% rule (rent ≥ 1% of price), the offer needs to be $204k (0.4% below list).
- Recommended offer: $188k (8.0% below list) — sets the bar for cash-flow.
- Cap rate 5.7% vs local median 4.2% in Travis Ranch — top-decile yield for the area; either an underpriced asset or a hidden risk that comps aren't pricing in. Stress-test before assuming the spread holds.
Location & tenants
- Location reads 61/100 on livability (#983 in TX) — a middle-class / working-renter tenant base. Strengths: employment A+, housing A+, crime B+; Watch: amenities F, commute F, health & safety F.
- Forney ISD (rural): math 41% / reading 44% proficiency, ranked #234 of 826 in TX (top 28%) — families likely to look elsewhere, expect single-tenant / working-renter base with shorter leases.
- Zoned schools: Lewis El (math 32% / reading 32%, grade F, #2,268 of 4,322 statewide, top 55%, 763 students, 50% FRL); Brown Middle (math 29% / reading 39%, grade F, #892 of 1,662 statewide, top 55%, 673 students, 56% FRL); North Forney H S (math 32% / reading 45%, grade F, #866 of 1,632 statewide, top 54%, 2,502 students, 49% FRL) — zoned schools average 52% FRL vs 26% district-wide (25 pts higher); higher-poverty schools than district average — tighter screening recommended.
- Market conditions: Rents rising (+1.4%/yr); 2200 active listings in the ZIP; 40 comparable units currently listed for rent nearby; rentals at typical pace (median 19d on market — plan ~3-4 weeks tenant-placement turnaround); solid renter incomes; 1,747 units permitted in Kaufman County in 2024 (180 in 5+ unit buildings).
Forward outlook
- Local home prices are declining (-3.0%/yr); year-one equity from $1k of loan paydown is wiped out by about $6k of value loss. Plan a longer hold.
- Kaufman County population projected at +43% by 2050 — long-run rental-demand tailwind backs the buy-and-hold thesis.
Negotiation context
- It's been on market 16 days — a 2% lower offer ($202k) is reasonable based on typical stale-listing flexibility.
- 4 sale attempts since 3y ago with the ask held roughly flat each time — persistent listings suggest the price (not the market) is what's stuck; bring a comps-based counter.
Risks & watch-outs
- Watch-outs: property tax is 3.0% of price.
- Climate carrying-cost: major wind risk, 27% chance of damaging wind over 30y; extreme-heat days projected 7→25/yr by 2055 (HVAC capex compounding) — expect insurance premiums to compound above CPI over the hold.
Questions for the listing agent
- What do current leases actually rent for vs. the listed asking? Can we see a recent rent roll and the last 12 months of T-12 income?
- Property tax is high relative to price — has the assessment been appealed recently, and will the sale trigger a re-assessment?
- What does the HOA fee cover, when was the last increase, and are there any pending special assessments or reserve-fund shortfalls?
- Is there a deadline driving the sale (1031 exchange, divorce, estate, relocation)? That informs how much negotiation room exists.
- The area grade is low — what's the realistic commute time and amenity access for the typical tenant pool here? Any planned neighborhood developments (good or bad) we should know about?
- What's the average days-on-market for RENTAL listings here right now (not sales)? A rising rental-DOM trend means longer vacancies and softer asking-rent achievability than the comps imply.
- What's the recent tenant-quality profile in this submarket — average credit score on applications, eviction rate, late-payment / NSF rate, and stable-employment percentage? A property-management company in the area should have these aggregated.
- How much new for-sale + rental construction is in the pipeline within 1–3 miles? Heavy new supply typically softens prices + rents 12–24 months out; constrained supply supports both.
Investment metrics
- 1% rule
- 1.00% ✗
- Cap rate
- 5.75%
- Cash-on-cash
- -1.95%
- DSCR
- 0.91
- GRM
- 8.4
CMA / ARV
- ARV (on-the-fly)
- $236,250
- Comps found
- 12
Show comp detail 12 sales within ~0.75 mi
| Address | Dist | Beds/Ba | Sqft | Sold | Price | $/sf | Match |
|---|---|---|---|---|---|---|---|
| 1029 Bedias Rd | 0.16mi | 3/2.0 | 1,431 (+6%) | 6mo | $249,900 | $175 | 77 |
| 2031 Jack County Dr | 0.51mi | 3/2.0 | 1,350 (0%) | 2mo | $245,000 | $181 | 75 |
| 1202 Trevino Rd | 0.36mi | 3/2.0 | 1,286 (-5%) | 2mo | $243,000 | $189 | 73 |
| 5649 Hepburn St | 0.35mi | 3/2.0 | 1,300 (-4%) | 10mo | $235,000 | $181 | 69 |
| 2423 Lemco Dr | 0.42mi | 3/2.0 | 1,490 (+10%) | 1mo | $240,000 | $161 | 63 |
| 2804 Lenham Ln | 0.54mi | 3/2.0 | 1,440 (+7%) | 2mo | $243,000 | $169 | 62 |
| 1050 Rio Bravo Dr | 0.40mi | 3/2.0 | 1,519 (+12%) | 0mo | $235,000 | $155 | 60 |
| 4110 Wintergreen Dr | 0.63mi | 3/2.0 | 1,247 (-8%) | 2mo | $225,000 | $180 | 57 |
| 4138 Wintergreen Dr | 0.62mi | 3/2.0 | 1,204 (-11%) | 2mo | $199,900 | $166 | 51 |
| 5402 Majestro Way | 0.71mi | 3/2.0 | 1,204 (-11%) | 1mo | $225,000 | $187 | 48 |
| 2124 Hobby Dr | 0.71mi | 3/2.0 | 1,530 (+13%) | 3mo | $220,000 | $144 | 42 |
| 4423 Culrin Way | 0.68mi | 4/2.0 (+1) | 1,497 (+11%) | 4mo | $229,900 | $154 | 42 |
Match score weights: distance 35% · size 25% · config 20% · recency 20%. Top-matched comps best support the ARV.
Projected returns pro-forma
-3.0% appreciation · 1.42% rent growth · sell at horizon
- IRR
- -21.6%
- Equity multiple
- 0.27×
- Total profit
- $-42,124
- Equity at exit
- $30,551
- IRR
- -20.2%
- Equity multiple
- 0.02×
- Total profit
- $-56,171
- Equity at exit
- $17,716
Cash invested: $57,372 (down + closing). Projections, not guarantees.
Landlord ↔ Tenant lean methodology
- Overall (STATE)
- 87 Strongly Landlord-Friendly
- State Texas
- 87 Strongly Landlord-Friendly · R+5
- County
- — inherits STATE
- City
- — inherits STATE
ZIP-level market 75126
- Rents YoY
- 1.4%
- Active inventory
- 2200
- Price-to-rent
- 8.4×
Monthly cashflow live
- Estimated rent
- $2,040 high interval (Pro) →
- Mortgage (P&I)
- −$1,075
- Tax from tax record
- −$511 /mo · $6,129/yr
- Insurance
- −$85
- HOA
- −$34
- Vacancy / Maint / Mgmt
- −$428
- Net cashflow
- $-93
Break-even live
Sensitivity live
| Price | -10% $23 | -5% $-35 | +0% $-93 | +5% $-151 | +10% $-209 |
|---|---|---|---|---|---|
| Rent | -10% $-254 | -5% $-174 | +0% $-93 | +5% $-13 | +10% $68 |
| Rate | -1.0pp $10 | -0.5pp $-41 | base $-93 | +0.5pp $-146 | +1.0pp $-200 |
UW: 25.0% down · 7.5% · 30yr · 1.5% tax · 5.0% vac · 8.0% maint · 8.0% mgmt
Financing live
Cash to close
- Down payment
- $51,225
- Closing costs
- $6,147
- Reserves months
- —
- Total cash needed
- —
Loan-product check · same deal, 3 products live
Conventional
25% down · 7.5% · 30yr
- Down + closing
- —
- Monthly P&I
- —
- Monthly cashflow
- —
- DSCR
- —
- Eligible?
- —
Personal DTI + credit; lowest rate.
DSCR
20% down · 8.5% · 30yr
- Down + closing
- —
- Monthly P&I
- —
- Monthly cashflow
- —
- DSCR
- —
- Eligible?
- —
No personal income docs; deal must DSCR.
Hard money
10% down · 12.0% · 12mo
- Down + closing
- —
- Monthly P&I
- —
- Monthly cashflow
- —
- DSCR
- —
- Eligible?
- —
Short-term bridge; refi at stabilization.
Rent comps 40 comps
| Address | Beds | Baths | Sqft | Rent | $/sqft | DOM | Units | Dist |
|---|---|---|---|---|---|---|---|---|
| 5529 McClelland St Forney, TX | 3.0 | 2.0 | 1450 | $1,750 | $1.21 | 8d | 1 | 0.30mi |
| 5529 McClelland St Forney, TX | 3.0 | 2.0 | 1450 | $1,750 | $1.21 | 14d | 1 | 0.30mi |
| 5516 Berea St Forney, TX | 3.0 | 2.0 | 1266 | $1,875 | $1.48 | 45d | 1 | 0.32mi |
| 2401 Lalun Ln Forney, TX | 4.0 | 2.0 | 1854 | $2,089 | $1.13 | 9d | 1 | 0.33mi |
| 2402 Buchanan Ln Forney, TX | 4.0 | 2.0 | 1858 | $2,299 | $1.24 | 3d | 1 | 0.36mi |
| 2402 Buchanan Ln Forney, TX | 4.0 | 2.0 | 1858 | $2,399 | $1.29 | 26d | 1 | 0.36mi |
| 5537 Berea St Forney, TX | 3.0 | 2.0 | 1239 | $1,780 | $1.44 | 0d | 1 | 0.36mi |
| 2047 Enchanted Rock Dr Forney, TX | 4.0 | 2.0 | 1636 | $2,000 | $1.22 | 5d | 1 | 0.44mi |
| 5661 McClelland St Forney, TX | 3.0 | 2.0 | 1590 | $1,995 | $1.25 | 6d | 1 | 0.47mi |
| 5693 McClelland St Forney, TX | 4.0 | 2.5 | 1685 | $1,839 | $1.09 | 9d | 1 | 0.53mi |
| 2157 Clarion Dr Forney, TX | 3.0 | 2.0 | 1608 | $1,975 | $1.23 | 45d | 1 | 0.57mi |
| 2412 Bold Venture Dr Forney, TX | 3.0 | 2.0 | 1448 | $1,895 | $1.31 | 45d | 1 | 0.61mi |
| 4307 Johnstown Ln Forney, TX | 3.0 | 2.0 | 1247 | $1,745 | $1.40 | 26d | 1 | 0.63mi |
| 4119 Wintergreen Dr Forney, TX | 2.0 | 1.0 | 1011 | $1,500 | $1.48 | 20d | 1 | 0.67mi |
| 4101 Wintergreen Dr Forney, TX | 3.0 | 2.0 | 1239 | $1,645 | $1.33 | 8d | 1 | 0.68mi |
| 2117 Silsbee Ct Forney, TX | 3.0 | 2.0 | 1663 | $1,995 | $1.20 | 18d | 1 | 0.68mi |
| 1004 Trickham Dr Forney, TX | 3.0 | 2.0 | 1825 | $2,250 | $1.23 | 0d | 1 | 0.87mi |
| 5906 Nyquist Way Forney, TX | 3.0 | 2.0 | 1500 | $1,999 | $1.33 | 45d | 1 | 0.87mi |
| 5452 Montrose Dr Forney, TX | 3.0 | 2.0 | 1185 | $1,750 | $1.48 | 6d | 1 | 0.88mi |
| 6001 Determine Ln Forney, TX | 3.0 | 2.0 | 1440 | $1,679 | $1.17 | 23d | 1 | 0.88mi |
| 6011 Determine Ln Forney, TX | 4.0 | 2.0 | 1514 | $1,800 | $1.19 | 5d | 1 | 0.92mi |
| 1804 Arcola Ct Forney, TX | 4.0 | 3.0 | 1619 | $1,895 | $1.17 | 14d | 1 | 0.95mi |
| 1804 Arcola Ct Forney, TX | 4.0 | 2.5 | 1619 | $1,895 | $1.17 | 17d | 1 | 0.95mi |
| 6021 Determine Ln Forney, TX | 4.0 | 2.0 | 1500 | $2,095 | $1.40 | 26d | 1 | 0.96mi |
| 5628 Elwood Dr Forney, TX | 3.0 | 2.0 | 1484 | $1,750 | $1.18 | 0d | 1 | 0.96mi |
| 5811 Grindstone Dr Forney, TX | 3.0 | 2.0 | 1440 | $1,999 | $1.39 | 45d | 1 | 0.99mi |
| 6038 Determine Ln Forney, TX | 3.0 | 2.0 | 1233 | $1,895 | $1.54 | 45d | 1 | 1.01mi |
| 1427 Ganado Dr Forney, TX | 4.0 | 2.0 | 1512 | $2,095 | $1.39 | 23d | 1 | 1.03mi |
| 1427 Ganado Dr Forney, TX | 3.0 | 2.0 | 1520 | $1,995 | $1.31 | 9d | 1 | 1.03mi |
| 5603 Elwood Dr Forney, TX | 2.0 | 1.0 | 1008 | $1,500 | $1.49 | 45d | 1 | 1.04mi |
| 5733 Barbaro Dr Forney, TX | 2.0 | 1.0 | 1011 | $1,790 | $1.77 | 0d | 1 | 1.07mi |
| 6084 Determine Ln Forney, TX | 3.0 | 2.0 | 1239 | $1,700 | $1.37 | 4d | 1 | 1.08mi |
| 6077 Determine Ln Forney, TX | 4.0 | 2.0 | 1500 | $1,995 | $1.33 | 26d | 1 | 1.10mi |
| 1031 Johnson City Ave Forney, TX | 3.0 | 2.0 | 1609 | $1,950 | $1.21 | 6d | 1 | 1.10mi |
| 1037 Johnson City Ave Forney, TX | 3.0 | 2.0 | 1660 | $1,895 | $1.14 | 26d | 1 | 1.12mi |
| 1037 Johnson City Ave Forney, TX | 3.0 | 2.0 | 1660 | $1,895 | $1.14 | 21d | 1 | 1.12mi |
| 2014 Zavala Forney, TX | 3.0 | 2.0 | 1616 | $2,100 | $1.30 | 6d | 1 | 1.13mi |
| 6101 Determine Ln Forney, TX | 3.0 | 2.0 | 1440 | $1,850 | $1.28 | 45d | 1 | 1.15mi |
| 2010 Diamondback Forney, TX | 3.0 | 2.0 | 1750 | $2,099 | $1.20 | 26d | 1 | 1.21mi |
| 2143 Erika Ln Forney, TX | 3.0 | 2.0 | 1680 | $2,200 | $1.31 | 18d | 1 | 1.21mi |
HOA detail
- Monthly dues
- $34 · $408/yr
- Likely covers
- water
Listing history 13 events
-
2026-06-16status $204,900 Pending 16 DOM
-
2026-06-15days on market $204,900 Active 16 DOM
-
2026-06-13days on market $204,900 Active 14 DOM
-
2026-06-13days on market $204,900 Active 13 DOM
-
2026-06-09pricedays on market $204,900 Active 10 DOM
-
2026-06-08days on market $214,900 Active 9 DOM
-
2026-06-07days on market $214,900 Active 8 DOM
-
2026-06-04days on market $214,900 Active 5 DOM
-
2026-06-03days on market $214,900 Active 4 DOM
-
2026-06-02days on market $214,900 Active 3 DOM
-
2026-06-01days on market $214,900 Active 2 DOM
-
2026-05-31remarks 687-char remark
-
2026-05-31$214,900 Active 1 DOM
ⓘ Source: listings_history table (triggers on properties + properties_extension) + one-shot
backfill from property_details.listing_events for pre-trigger history.
Tax reassessment forecast TX · Resets to sale price
- Current annual tax
- $6,129 · $511/mo
- Projected year-2 tax
- $6,129 · $511/mo
- Expected delta
- $0/yr ($0/mo · 0.0%)
ⓘ Screening estimate from a state-policy table — verify with the county assessor before closing.
Climate risk First Street
- Flood 1/10 Low FEMA zone X (unshaded) · 0% chance over 30 yrs
- Wildfire 3/10 Moderate
- Heat 8/10 Severe 7 d/yr ≥110°F today · 25 d/yr by 30 yrs out
- Wind 6/10 Major 27% chance of damaging wind over 30 yrs
- Air quality 2/10 Low 1 unhealthy d/yr today · 1 by 30 yrs out
Nearby sold comps map
Loading sold comps map…
Walkable amenities ~0.75 mi
Loading nearby amenities…
Taxation est. · year 1
- Rental income
- $24,477
- − Mortgage interest
- −$11,478
- − Property taxes
- −$6,129
- − Insurance
- −$1,024
- − Repairs & maintenance
- −$1,958
- − Management
- −$1,958
- − HOA
- −$408
- − Depreciation
- −$5,961
- Taxable loss
- −$4,439
- Est. tax savings @ 24.0%
- +$1,065
- After-tax cash flow
- $-53/yr
For passive investors: Depreciation is non-cash, so a rental often shows a tax loss while cash-flowing — sheltering income. Rental losses are passive: they offset passive income freely, and up to $25,000/yr can offset ordinary (W-2) income if you actively participate and your MAGI is under $100k (phasing out to $0 by $150k); unused losses carry forward. On sale, claimed depreciation is recaptured at up to 25%, and gains may owe capital-gains tax (a 1031 exchange can defer both). Figures are a year-1 estimate at your 24.0% rate — not tax advice; consult a CPA.
Schools (NCES district)
- District
- Forney ISD
- NCES district ID
- 4819560
- Math proficiency
- 41% ▼ -20.00%
- Reading proficiency
- 44% ▼ -12.00%
- Median HH income
- $86,679
- Composite
- 40.07/100
- National rank
- #3812
- State rank
- #234 of 826 in TX
Livability — Travis Ranch
- Score
- 61/100
- State rank
- #983
- US rank
- #17440
Category grades
Schools grade is shown separately in the Schools card above.
Census & demographics
- Census place
- Travis Ranch, TX
- County
- Kaufman County · 122,338 people
- City population
- 84,799
- Metro
- Dallas-Fort Worth-Arlington, TX
- Population (ZIP)
- 84,799
- Household income
- $103,673
- Rent vs Own
- Severe rent burden
- 1306.0
Population outlook (Kaufman County) Hauer SSP2
- Today (2025)
- 138,716 people
- By 2030
- 150,815 · +8.7%
- By 2040
- 174,877 · +26.1%
- By 2050
- 198,020 · +42.8%
- By 2075
- 251,908 · +81.6%
- By 2100
- 285,325 · +105.7%
Race, ethnicity, and origin ACS 2023
- Neighborhood character
- Diverse neighborhood (Simpson 0.68)
- Race & ethnicity
- White 45% Black 25% Hispanic / Latino 23% Two or more races 14% Asian 3%
- Hispanic origin (detail)
- Mexican 18% Puerto Rican 1%
- Common ancestry
- Italian 2% Slovak 1% Portuguese 1%
- Foreign-born
- 12% · Canada, Vietnam
- Languages at home
- 79% English-only · Spanish 14% Arabic 1% Vietnamese 1%
Political lean MEDSL · Kaufman
- 2024 margin
- Strong R (+27.9) · D 35.6% · R 63.5%
- 2008→2024 swing
- +7.9pp toward D · 2008: -35.8pp · 2024: -27.9pp
- All cycles
- 2024: R+27.9 2020: R+33.9 2016: R+47.0 2012: R+44.4 2008: R+35.8
Not yet ingested
- Civics
- —
Market trends
- HPI YoY
- ▼ -102.93%
- Current HPI
- 148.5749
- Rent YoY
- ▲ 1.42%
- Metro
- Dallas-Fort Worth-Arlington, TX
- State GDP YoY
- ▲ 3.95%
- F500 in state
- 110
Industry mix (Fortune 500 HQ in TX)
| Industry | F500 HQs | Revenue |
|---|---|---|
| Energy | 16 | $1,198B |
|
||
| Technology | 5 | $198B |
|
||
| Engineering / Construction | 4 | $72B |
|
||
| Energy Services | 3 | $60B |
|
||
| Utilities | 3 | $41B |
|
||
| Healthcare | 2 | $330B |
|
||
Price history
-21.9% since first listed12 events — show timeline
- 2026-05-30 Listed $214,900 NTREIS
- 2025-10-29 Listing Removed — NTREIS
- 2025-04-29 Listed $295,000 NTREIS
- 2023-10-12 Sold (Public Records) — Public Records
- 2023-10-05 Sold (MLS) — NTREIS
- 2023-09-18 Pending — NTREIS
- 2023-09-07 Contingent — NTREIS
- 2023-08-28 Price Changed $272,000 NTREIS
- 2023-07-28 Price Changed $272,500 NTREIS
- 2023-07-13 Relisted — NTREIS
- 2023-07-11 Contingent — NTREIS
- 2023-07-03 Listed $275,000 NTREIS
Property tax history
+26.9%/yrLatest (2025): $6,129 · -6.3% YoY. Source: county tax records.
Cash-flow waterfall
monthlySold comps — $/sqft
last 12 mo · ≤1 miLoading sold comps…