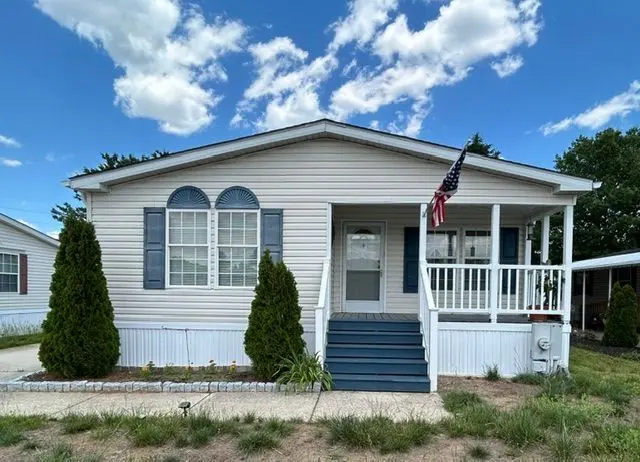
277 Andrew Ave · Sewell, NJ
Flood risk No data
- FEMA flood zone
- —
- Chance of flooding over 30 yrs
- —
- Est. flood insurance / yr
- —
Fire risk No data
- Est. fire insurance / yr
- —
Heat risk No data
- Hot days now (above threshold)
- —
- Hot days in 30 yrs
- —
Wind risk No data
- Chance of severe wind over 30 yrs
- —
Air-quality risk No data
- Unhealthy air days now
- —
- Unhealthy air days in 30 yrs
- —
Risk factors via First Street. Map © Google.
Why this score? — see what drove the C grade
The composite is a weighted blend of 9 inputs, each scored 0–100. Each bar is that input's sub-score; the figure is the points it added to the 100-point composite (weight × sub-score).
- Cash flow +23.5/30.0
- DSCR +7.6/10.0
- ARV discount +7.5/15.0
- 1% rule +6.1/10.0
- Schools +3.7/10.0
- Rent growth +2.5/5.0
- Livability +2.5/5.0
- Condition / age +2.2/5.0
- Appreciation +0.0/10.0
$180,000
🖨 Deal sheet 📄 Offer letter ✓ Due diligence
Listing remarks
Sale Pending - Welcome to Maplewood Village! Spacious and well-maintained 2-bedroom, 2-bath manufactured home built in 1999, featuring a versatile den with elegant French doors perfect for a home office, hobby room, or guest space. The large eat-in kitchen offers plenty of room for cooking and gathering and comes complete with a gas range, microwave, dishwasher, refrigerator, and washer/dryer. Enjoy year-round comfort with gas heat and central air conditioning. The primary bedroom offers a walk-in closet and an attached oversized bathroom with a step-in shower and convenient grab bars. A skylight brightens the hall bathroom, adding natural light and charm. Additional highlights include dura
Key facts
- Large eat-in kitchen
- Versatile den
- Walk-in closet
Tags
Property features AI
Finance
- Financial info: List price $180,000
Exterior
- Utilities: Natural gas; Central air conditioning; Electric service (standard)
- Home design: Spec home — BRE Maplewood Village plan; Located at 277 Andrew Ave, Mantua Township, NJ 08051
- Exterior features: Shake roof
Interior
- Kitchen: Dishwasher; Microwave; Refrigerator
- Bedrooms: 2 bedrooms
- Bathrooms: 2 bathrooms
- Heating & cooling: Natural gas heating; Central air; Ceiling fan(s)
- Interior features: Dishwasher; Microwave; Refrigerator
- Laundry & utility: Washer; Dryer
Neighborhood map
What this means for you Summary
Snapshot
- This is a 2-bed/2.0-bath manufactured listed at $180k. Condition is rated fair.
Deal economics
- At list price, monthly cash flow is $335 ($4k/yr) — positive.
- The deal already cash-flows at list — no discount required.
- Meets the 1% rule at list price ($2k rent vs $180k).
- Recommended offer: $177k (1.5% below list) — sets the bar for market timing.
- Cap rate 8.5% vs local median 4.4% in Sewell — top-decile yield for the area; either an underpriced asset or a hidden risk that comps aren't pricing in. Stress-test before assuming the spread holds.
Location & tenants
- Location reads: area grade C — affects rentability + tenant quality, not the cash-flow math above.
- Mantua Township School District (suburban): math 27% / reading 53% proficiency, ranked #210 of 472 in NJ (top 44%) — families likely to look elsewhere, expect single-tenant / working-renter base with shorter leases; only 12% free/reduced lunch — higher-income household profile.
- Market conditions: 59 active listings in the ZIP; 3 comparable units currently listed for rent nearby; rentals leasing fast (median 2d on market — plan ~1-2 weeks tenant-placement turnaround); solid renter incomes; 1,047 units permitted in Gloucester County in 2024 (183 in 5+ unit buildings).
Forward outlook
- Local home prices are declining (-3.0%/yr); year-one equity from $1k of loan paydown is wiped out by about $5k of value loss. Plan a longer hold.
- Gloucester County population projected to shrink 5% by 2050 — rents likely to lag national; underwrite the cash flow, not the appreciation.
Negotiation context
- It's been on market 15 days — a 2% lower offer ($177k) is reasonable based on typical stale-listing flexibility.
Questions for the listing agent
- Have any recent inspections been done? Can we get a copy of the seller's disclosures and any deferred-maintenance estimates?
- Is there a deadline driving the sale (1031 exchange, divorce, estate, relocation)? That informs how much negotiation room exists.
- What's the average days-on-market for RENTAL listings here right now (not sales)? A rising rental-DOM trend means longer vacancies and softer asking-rent achievability than the comps imply.
- What's the recent tenant-quality profile in this submarket — average credit score on applications, eviction rate, late-payment / NSF rate, and stable-employment percentage? A property-management company in the area should have these aggregated.
- How much new for-sale + rental construction is in the pipeline within 1–3 miles? Heavy new supply typically softens prices + rents 12–24 months out; constrained supply supports both.
Investment metrics
- 1% rule
- 1.11% ✓
- Cap rate
- 8.53%
- Cash-on-cash
- 7.98%
- DSCR
- 1.36
- GRM
- 7.5
CMA / ARV
No comps found within radius.
Projected returns pro-forma
-3.0% appreciation · 3.0% rent growth · sell at horizon
- IRR
- -4.1%
- Equity multiple
- 0.85×
- Total profit
- $-7,786
- Equity at exit
- $26,839
- IRR
- 5.6%
- Equity multiple
- 1.41×
- Total profit
- $20,837
- Equity at exit
- $15,563
Cash invested: $50,400 (down + closing). Projections, not guarantees.
Landlord ↔ Tenant lean methodology
- Overall (STATE)
- 21 Tenant-Leaning
- State New Jersey
- 21 Tenant-Leaning · D+6
- County
- — inherits STATE
- City
- — inherits STATE
ZIP-level market 08051
- Home prices YoY
- -23.3%
- Active inventory
- 59
- Price-to-rent
- 7.5×
Monthly cashflow live
- Estimated rent
- $1,999 medium interval (Pro) →
- Mortgage (P&I)
- −$944
- Tax est. 1.5%
- −$225 /mo · $2,700/yr
- Insurance
- −$75
- HOA
- −$0
- Vacancy / Maint / Mgmt
- −$420
- Net cashflow
- $335
Break-even live
UW: 25.0% down · 7.5% · 30yr · 1.5% tax · 5.0% vac · 8.0% maint · 8.0% mgmt
Financing live
Cash to close
- Down payment
- $45,000
- Closing costs
- $5,400
- Reserves months
- —
- Total cash needed
- —
Loan-product check · same deal, 3 products live
Conventional
25% down · 7.5% · 30yr
- Down + closing
- —
- Monthly P&I
- —
- Monthly cashflow
- —
- DSCR
- —
- Eligible?
- —
Personal DTI + credit; lowest rate.
DSCR
20% down · 8.5% · 30yr
- Down + closing
- —
- Monthly P&I
- —
- Monthly cashflow
- —
- DSCR
- —
- Eligible?
- —
No personal income docs; deal must DSCR.
Hard money
10% down · 12.0% · 12mo
- Down + closing
- —
- Monthly P&I
- —
- Monthly cashflow
- —
- DSCR
- —
- Eligible?
- —
Short-term bridge; refi at stabilization.
Rent comps 3 comps
| Address | Beds | Baths | Sqft | Rent | $/sqft | DOM | Units | Dist |
|---|---|---|---|---|---|---|---|---|
| 106 Main St Mantua, NJ | 2.0 | 1.0 | 2224 | $1,900 | $0.85 | 1d | 1 | 0.77mi |
| 272 Elm Ave Unit A Mantua Township, NJ | 2.0 | 1.0 | 2176 | $1,900 | $0.87 | 1d | 1 | 0.86mi |
| 752 Howard Ave Unit 1 Wenonah, NJ | 3.0 | 1.0 | 1150 | $2,525 | $2.20 | 3d | 1 | 1.47mi |
Listing history 11 events
-
2026-06-18days on market $180,000 Active 15 DOM
-
2026-06-17days on market $180,000 Active 14 DOM
-
2026-06-16days on market $180,000 Active 13 DOM
-
2026-06-15days on market $180,000 Active 12 DOM
-
2026-06-13days on market $180,000 Active 10 DOM
-
2026-06-13days on market $180,000 Active 9 DOM
-
2026-06-09days on market $180,000 Active 6 DOM
-
2026-06-08days on market $180,000 Active 5 DOM
-
2026-06-07days on market $180,000 Active 4 DOM
-
2026-06-04remarks 699-char remark
-
2026-06-04$180,000 Active 1 DOM
ⓘ Source: listings_history table (triggers on properties + properties_extension) + one-shot
backfill from property_details.listing_events for pre-trigger history.
Nearby sold comps map
Loading sold comps map…
Walkable amenities ~0.75 mi
Loading nearby amenities…
Taxation est. · year 1
- Rental income
- $23,988
- − Mortgage interest
- −$10,083
- − Property taxes
- −$2,700
- − Insurance
- −$900
- − Repairs & maintenance
- −$1,919
- − Management
- −$1,919
- − Depreciation
- −$5,236
- Taxable income
- $1,230
- Est. tax owed @ 24.0%
- −$295
- After-tax cash flow
- $3,728/yr
For passive investors: Depreciation is non-cash, so a rental often shows a tax loss while cash-flowing — sheltering income. Rental losses are passive: they offset passive income freely, and up to $25,000/yr can offset ordinary (W-2) income if you actively participate and your MAGI is under $100k (phasing out to $0 by $150k); unused losses carry forward. On sale, claimed depreciation is recaptured at up to 25%, and gains may owe capital-gains tax (a 1031 exchange can defer both). Figures are a year-1 estimate at your 24.0% rate — not tax advice; consult a CPA.
Condition & rehab AI · 2 photos
This manufactured home requires moderate repairs and maintenance, with potential for significant value increase through cosmetic updates and improvements to curb appeal.
Repairs flagged
- Minor Paint touch-ups — Paint appears intact but may need touch-ups.
- Minor Landscaping improvements — Landscaping appears maintained but could be improved.
Value-add opportunities
- Both Paint touch-ups — Enhances curb appeal and interior aesthetics.
- Both Landscaping improvements — Enhances curb appeal and property value.
- Both HVAC maintenance — Improves comfort and energy efficiency, attracting buyers/renters.
- Both Interior cleaning — Enhances cleanliness and appeal, attracting buyers/renters.
- Both Roof inspection — Ensures structural integrity and prevents future costly repairs.
Renovation cost estimate screening
| Repair item | Severity | Est. cost |
|---|---|---|
| Paint touch-ups · Paint appears intact but may need touch-ups. | Minor | $500–3,000 |
| Landscaping improvements · Landscaping appears maintained but could be improved. | Minor | $500–3,000 |
| Total estimated repair cost · 2 items | $1,000–6,000 |
Value-add ROI direction
- Both Paint touch-ups — Enhances curb appeal and interior aesthetics. ↑
- Both Landscaping improvements — Enhances curb appeal and property value. ↑
- Both HVAC maintenance — Improves comfort and energy efficiency, attracting buyers/renters. ↑
- Both Interior cleaning — Enhances cleanliness and appeal, attracting buyers/renters. ↑
- Both Roof inspection — Ensures structural integrity and prevents future costly repairs. ↑
ⓘ Cost ranges are severity-bucket heuristics (US national rule-of-thumb). Get contractor quotes + a written scope before underwriting a rehab budget.
Schools (NCES district)
- District
- Mantua Township School District
- NCES district ID
- 3409600
- Math proficiency
- 27% ▼ -26.00%
- Reading proficiency
- 53% ▼ -18.00%
- Median HH income
- $81,565
- Composite
- 37.41/100
- National rank
- #4422
- State rank
- #210 of 472 in NJ
Livability — Sewell
No livability data for this city. (Only ~50 U.S. cities are tracked.)
Census & demographics
- County
- Gloucester County · 160,422 people
- City population
- 38,159
- Metro
- Philadelphia-Camden-Wilmington, PA-NJ-DE-MD
- Population (ZIP)
- 12,474
- Household income
- $92,071
- Rent vs Own
- Severe rent burden
- 155.0
Population outlook (Gloucester County) Hauer SSP2
- Today (2025)
- 298,895 people
- By 2030
- 299,031 · +0.0%
- By 2040
- 294,020 · -1.6%
- By 2050
- 284,188 · -4.9%
- By 2075
- 260,720 · -12.8%
- By 2100
- 229,565 · -23.2%
Race, ethnicity, and origin ACS 2023
- Neighborhood character
- Predominantly White (85%)
- Race & ethnicity
- White 85% Black 6% Hispanic / Latino 4% Two or more races 3% Asian 2%
- Common ancestry
- Romanian 6% Slovak 3% Lithuanian 1%
- Foreign-born
- 4% · Canada
- Languages at home
- 92% English-only · Spanish 3% Tagalog/Filipino 2% Other Indo-European 1%
Political lean MEDSL · Gloucester
- 2024 margin
- Toss-up / Even · D 47.8% · R 50.6% · Other 1.6%
- 2008→2024 swing
- -15.0pp toward R · 2008: 12.2pp · 2024: -2.8pp
- All cycles
- 2024: R+2.8 2020: D+1.9 2016: R+0.4 2012: D+10.5 2008: D+12.2
Not yet ingested
- Civics
- —
Market trends
- HPI YoY
- ▼ -90.45%
- Current HPI
- 297.7611
- Rent YoY
- —
- Metro
- Philadelphia-Camden-Wilmington, PA-NJ-DE-MD
- State GDP YoY
- ▲ 2.05%
- F500 in state
- 34
Industry mix (Fortune 500 HQ in NJ)
| Industry | F500 HQs | Revenue |
|---|---|---|
| Consumer Goods | 3 | $31B |
|
||
| Pharmaceuticals | 2 | $153B |
|
||
| Technology | 2 | $21B |
|
||
| Insurance | 2 | $20B |
|
||
| Healthcare | 2 | $19B |
|
||
| Financial Services | 1 | $70B |
|
||
Cash-flow waterfall
monthlySold comps — $/sqft
last 12 mo · ≤1 miLoading sold comps…