 Multi-family
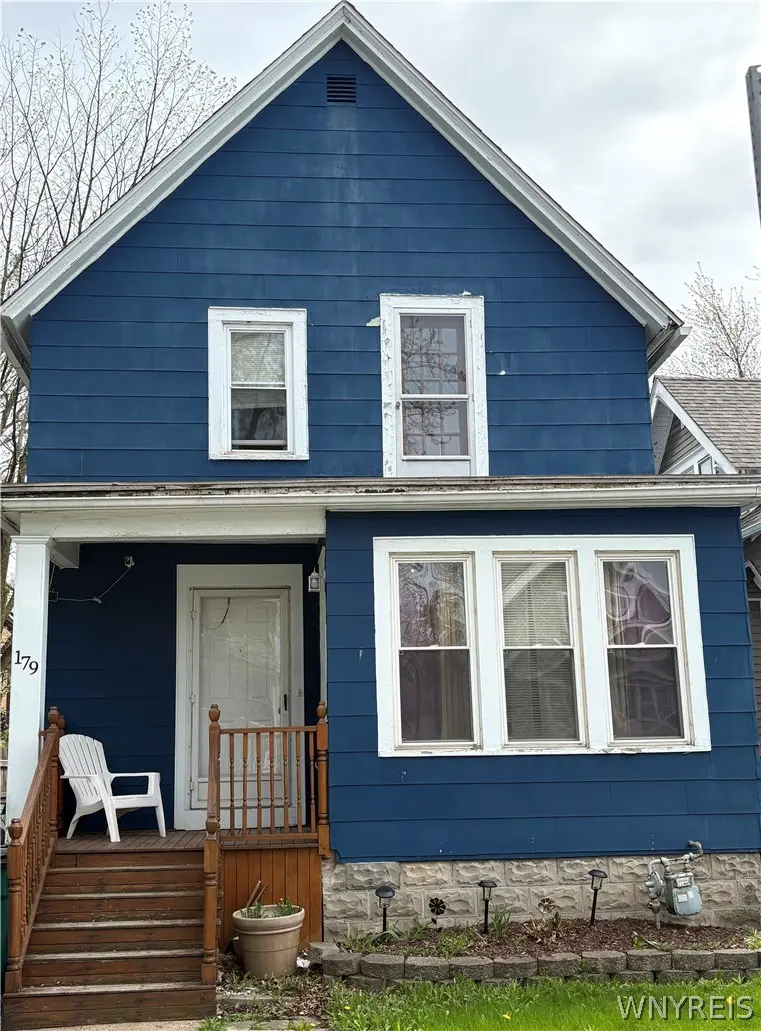
179 Villa Ave · Buffalo, NY
Flood risk 1/10 · Minimal
- FEMA flood zone
- X (unshaded)
- Chance of flooding over 30 yrs
- 0.0%
- Est. flood insurance / yr
- $473 – $860
Fire risk 1/10 · Minimal
- Est. fire insurance / yr
- $691 – $1,283
Heat risk 3/10 · Minor
- Hot days now (above 92°F)
- 7 days/yr
- Hot days in 30 yrs
- 15 days/yr
Wind risk 1/10 · Minimal
- Chance of severe wind over 30 yrs
- —
Air-quality risk 3/10 · Minor
- Unhealthy air days now
- 3 days/yr
- Unhealthy air days in 30 yrs
- 4 days/yr
Risk factors via First Street. Map © Google.
Why this score? — see what drove the C+ grade
The composite is a weighted blend of 9 inputs, each scored 0–100. Each bar is that input's sub-score; the figure is the points it added to the 100-point composite (weight × sub-score).
- Cash flow +21.1/30.0
- ARV discount +15.0/15.0
- DSCR +6.7/10.0
- 1% rule +4.3/10.0
- Livability +3.9/5.0
- Rent growth +3.4/5.0
- Schools +3.3/10.0
- Condition / age +2.5/5.0
- Appreciation +0.0/10.0
$200,000
🖨 Deal sheet 📄 Offer letter ✓ Due diligence
Multi-family units
County records classify this as Multi-Family (2-4 Unit). Listing-text estimate: 1 unit. estimate disagrees with records
Listing remarks MLS
VRP-Owner will consider offers between $200,000-230,000 or higher. Currently being used as a single-family residence, this property offers flexible living space and retains a layout that may provide the potential to be converted back to a two-family home. The first floor features a spacious living room, formal dining room, large kitchen, bedroom or study, and a full bath. The second floor includes a kitchen, full bath, bedroom, and a living room currently being used as a second bedroom, offering a variety of options for extended living arrangements, multi-generational living, or future investment potential. Recent improvements include freshly painted kitchen walls with new recessed lighting and new flooring on the second floor. The full basement provides ample storage space. Conveniently located near shopping, restaurants, schools, and major commuter routes. Whether you’re looking for a spacious home with flexible living arrangements or exploring investment opportunities, this property offers exceptional value and potential. Also listed as SFR -B1689150
Key facts
- Formal dining room
- Large kitchen
- Full bath
Tags
Property features AI
Exterior
- Parking: Detached garage (1 car)
- Utilities: Electricity connected (circuit breakers); Public water connected; Sewer connected
- Home design: 2-story house; Existing construction
- Construction: Composite siding; Asphalt roof
- Exterior features: Concrete driveway; Deck; Fully fenced yard; Near public transit; Rectangular residential lot; City street frontage
Interior
- Kitchen: Kitchen on first level
- Bedrooms: One main-level bedroom; Two additional bedrooms (second level)
- Flooring: Carpet; Varies
- Bathrooms: One full bathroom (main level)
- Heating & cooling: Gas hot water heating
- Interior features: Separate/formal living room; Bedroom on main level; See remarks
- Laundry & utility: Gas water heater
Neighborhood map
What this means for you Summary
Snapshot
- This is a 4-bed/2.0-bath multifamily listed at $200k.
Deal economics
- At list price, monthly cash flow is $285 ($3k/yr) — positive.
- The deal already cash-flows at list — no discount required.
- To meet the 1% rule (rent ≥ 1% of price), the offer needs to be $186k (7.1% below list).
- Recommended offer: $186k (7.1% below list) — sets the bar for 1% rule.
Location & tenants
- Location reads 77/100 on livability (#195 in NY, #3,011 nationally) — a middle-class / working-renter tenant base. Strengths: commute A+, housing A+, health & safety A+; Watch: crime F, employment D-.
- Buffalo City School District (urban): math 41% / reading 40% proficiency, ranked #535 of 590 in NY (top 91%) — families likely to look elsewhere, expect single-tenant / working-renter base with shorter leases; 75% free/reduced lunch — lower-income household profile, screen leases tightly.
- Market conditions: Rents rising (+3.6%/yr); 88 active listings in the ZIP; 15 comparable units currently listed for rent nearby; rentals at typical pace (median 14d on market — plan ~3-4 weeks tenant-placement turnaround); 1,244 units permitted in Erie County in 2024 (563 in 5+ unit buildings).
- This rent runs 32% of the median local income ($70k/yr) — at the standard rent-burdened threshold; future hikes will face affordability resistance.
Forward outlook
- Local home prices are declining (-3.0%/yr); year-one equity from $1k of loan paydown is wiped out by about $6k of value loss. Plan a longer hold.
Negotiation context
- Only 9 days on market — expect competitive offers; lowballing is unlikely to land.
- 6 sale attempts since 3y ago with the ask held roughly flat each time — persistent listings suggest the price (not the market) is what's stuck; bring a comps-based counter.
Risks & watch-outs
- Watch-outs: built in 1920 — expect roof / HVAC / electrical / plumbing capex.
Questions for the listing agent
- Built in 1920 — when were the roof, HVAC, electrical panel, plumbing, and water heater last replaced?
- Is there a deadline driving the sale (1031 exchange, divorce, estate, relocation)? That informs how much negotiation room exists.
- Crime grade is F in this area — have there been break-ins, vandalism, or insurance claims at this property in the last 3 years? What carrier currently insures it and at what premium?
- What's the average days-on-market for RENTAL listings here right now (not sales)? A rising rental-DOM trend means longer vacancies and softer asking-rent achievability than the comps imply.
- What's the recent tenant-quality profile in this submarket — average credit score on applications, eviction rate, late-payment / NSF rate, and stable-employment percentage? A property-management company in the area should have these aggregated.
- How much new apartment / multifamily construction is in the pipeline within 1–3 miles? Heavy new supply (>2% of stock underway) typically softens rents 12–24 months out; light construction supports rent growth.
Investment metrics
- 1% rule
- 0.93% ✗
- Cap rate
- 8.01%
- Cash-on-cash
- 6.12%
- DSCR
- 1.27
- GRM
- 9.0
CMA / ARV
- ARV (median comp)
- $272,884
- List price
- $200,000
- Delta
- -15.71%
- Verdict
- UNDERPRICED
- Comps
- 20 within 1.0 mi
Show comp detail 4 sales within ~0.75 mi
| Address | Dist | Beds/Ba | Sqft | Sold | Price | $/sf | Match |
|---|---|---|---|---|---|---|---|
| 142 E Hazeltine Ave | 0.14mi | 4/2.0 | 1,536 (+4%) | 15mo | $210,000 | $137 | 75 |
| 185 Villa Ave | 0.01mi | 3/2.0 (-1) | 1,343 (-9%) | 11mo | $263,500 | $196 | 69 |
| 142 Camden Ave | 0.68mi | 3/2.0 (-1) | 1,540 (+4%) | 4mo | $205,000 | $133 | 53 |
| 120 Victoria Blvd | 0.72mi | 4/2.0 | 1,592 (+7%) | 8mo | $300,000 | $188 | 48 |
Match score weights: distance 35% · size 25% · config 20% · recency 20%. Top-matched comps best support the ARV.
Projected returns pro-forma
-3.0% appreciation · 3.65% rent growth · sell at horizon
- IRR
- -6.3%
- Equity multiple
- 0.77×
- Total profit
- $-13,097
- Equity at exit
- $29,821
- IRR
- 4.0%
- Equity multiple
- 1.30×
- Total profit
- $16,713
- Equity at exit
- $17,292
Cash invested: $56,000 (down + closing). Projections, not guarantees.
Landlord ↔ Tenant lean methodology
- Overall (STATE)
- 15 Strongly Tenant-Friendly
- State New York
- 15 Strongly Tenant-Friendly · D+10
- County
- — inherits STATE
- City
- — inherits STATE
ZIP-level market 14216
- Rents YoY
- 3.6%
- Active inventory
- 88
- Price-to-rent
- 9.0×
Monthly cashflow live
- Estimated rent
- $1,859 high interval (Pro) →
- Mortgage (P&I)
- −$1,049
- Tax from tax record
- −$51 /mo · $611/yr
- Insurance
- −$83
- HOA
- −$0
- Vacancy / Maint / Mgmt
- −$390
- Net cashflow
- $285
Break-even live
UW: 25.0% down · 7.5% · 30yr · 1.5% tax · 5.0% vac · 8.0% maint · 8.0% mgmt
Financing live
Cash to close
- Down payment
- $50,000
- Closing costs
- $6,000
- Reserves months
- —
- Total cash needed
- —
Loan-product check · same deal, 3 products live
Conventional
25% down · 7.5% · 30yr
- Down + closing
- —
- Monthly P&I
- —
- Monthly cashflow
- —
- DSCR
- —
- Eligible?
- —
Personal DTI + credit; lowest rate.
DSCR
20% down · 8.5% · 30yr
- Down + closing
- —
- Monthly P&I
- —
- Monthly cashflow
- —
- DSCR
- —
- Eligible?
- —
No personal income docs; deal must DSCR.
Hard money
10% down · 12.0% · 12mo
- Down + closing
- —
- Monthly P&I
- —
- Monthly cashflow
- —
- DSCR
- —
- Eligible?
- —
Short-term bridge; refi at stabilization.
Rent comps 15 comps
| Address | Beds | Baths | Sqft | Rent | $/sqft | DOM | Units | Dist |
|---|---|---|---|---|---|---|---|---|
| 244 Hartwell Rd Buffalo, NY | 3.0 | 1.0 | 1250 | $1,500 | $1.20 | 2d | 1 | 0.39mi |
| 2522 Delaware Ave Buffalo, NY | 3.0 | 1.0 | 1150 | $1,625 | $1.41 | 1d | 1 | 0.48mi |
| 2514 Delaware Ave Unit 1 Buffalo, NY | 3.0 | 1.0 | 1620 | $1,650 | $1.02 | 1d | 1 | 0.49mi |
| 77 Lovering Ave #2 Buffalo, NY | 3.0 | 1.0 | 1450 | $1,895 | $1.31 | 43d | 1 | 0.55mi |
| 307 Sterling Ave Buffalo, NY | 3.0 | 1.0 | 1632 | $1,800 | $1.10 | 3d | 1 | 0.61mi |
| 140 Commonwealth Ave Unit 1 Buffalo, NY | 3.0 | 1.0 | 1250 | $3,500 | $2.80 | 43d | 1 | 0.62mi |
| 414 Taunton Pl Unit Lowet Buffalo, NY | 3.0 | 1.0 | 1232 | $1,700 | $1.38 | 14d | 1 | 0.75mi |
| 88 Commonwealth Ave Buffalo, NY | 3.0 | 1.0 | 1355 | $1,695 | $1.25 | 19d | 1 | 0.75mi |
| 79 Commonwealth Ave Buffalo, NY | 3.0 | 1.0 | 1450 | $1,600 | $1.10 | 23d | 1 | 0.77mi |
| 172 Tremont Ave Kenmore, NY | 3.0 | 1.5 | 1569 | $2,500 | $1.59 | 10d | 1 | 0.89mi |
| 237 W Girard Blvd Buffalo, NY | 4.0 | 1.5 | 1329 | $4,000 | $3.01 | 23d | 1 | 1.24mi |
| 480 W Hazeltine Ave Buffalo, NY | 3.0 | 1.0 | 989 | $1,900 | $1.92 | 23d | 1 | 1.25mi |
| 163 Carmel Rd Buffalo, NY | 3.0 | 1.0 | 1400 | $1,800 | $1.29 | 2d | 1 | 1.36mi |
| 33 Tillotson Pl Buffalo, NY | 3.0 | 1.0 | 1143 | $2,095 | $1.83 | 14d | 1 | 1.39mi |
| 151 Lamson Rd Buffalo, NY | 4.0 | 2.0 | 1382 | $2,350 | $1.70 | 16d | 1 | 1.45mi |
Listing history 20 events
-
2026-06-18days on market $200,000 Active 9 DOM
-
2026-06-17days on market $200,000 Active 8 DOM
-
2026-06-16days on market $200,000 Active 7 DOM
-
2026-06-15days on market $200,000 Active 6 DOM
-
2026-06-13days on market $200,000 Active 4 DOM
-
2026-06-13days on market $200,000 Active 3 DOM
-
2026-06-10remarks 693-char remark
-
2026-06-10pricestatus $200,000 Active 1 DOM
-
2026-05-07historical
-
2026-05-06$230,000 Active
-
2026-05-06$230,000 Active 592-char remark
-
2024-01-03soldstatus $175,000 Closed
-
2024-01-03soldstatus $175,000 Closed
-
2024-01-03soldstatus $175,000
-
2023-12-27status Pending
-
2023-12-27status Pending
-
2023-10-19status Under Contract- Do Not Show
-
2023-10-19status Under Contract- Do Not Show
-
2023-10-11$149,900 Active
-
2023-10-11$149,900 Active
ⓘ Source: listings_history table (triggers on properties + properties_extension) + one-shot
backfill from property_details.listing_events for pre-trigger history.
Tax reassessment forecast NY · Partial reset (capped growth)
- Current annual tax
- $611 · $51/mo
- Projected year-2 tax
- $1,995 · $166/mo
- Expected delta
- +$1,385/yr (+$115/mo · 226.6%)
ⓘ Screening estimate from a state-policy table — verify with the county assessor before closing.
Climate risk First Street
- Flood 1/10 Low FEMA zone X (unshaded) · 0% chance over 30 yrs
- Wildfire 1/10 Low
- Heat 3/10 Moderate 7 d/yr ≥92°F today · 15 d/yr by 30 yrs out
- Wind 1/10 Low
- Air quality 3/10 Moderate 3 unhealthy d/yr today · 4 by 30 yrs out
Nearby sold comps map
Loading sold comps map…
Walkable amenities ~0.75 mi
Loading nearby amenities…
Taxation est. · year 1
- Rental income
- $22,307
- − Mortgage interest
- −$11,203
- − Property taxes
- −$611
- − Insurance
- −$1,000
- − Repairs & maintenance
- −$1,785
- − Management
- −$1,785
- − Depreciation
- −$5,818
- Taxable income
- $106
- Est. tax owed @ 24.0%
- −$25
- After-tax cash flow
- $3,400/yr
For passive investors: Depreciation is non-cash, so a rental often shows a tax loss while cash-flowing — sheltering income. Rental losses are passive: they offset passive income freely, and up to $25,000/yr can offset ordinary (W-2) income if you actively participate and your MAGI is under $100k (phasing out to $0 by $150k); unused losses carry forward. On sale, claimed depreciation is recaptured at up to 25%, and gains may owe capital-gains tax (a 1031 exchange can defer both). Figures are a year-1 estimate at your 24.0% rate — not tax advice; consult a CPA.
Schools (NCES district)
- District
- Buffalo City School District
- NCES district ID
- 3605850
- Math proficiency
- 41% ▲ 11.00%
- Reading proficiency
- 40% ▲ 7.00%
- Median HH income
- $31,665
- Composite
- 33.17/100
- National rank
- #5544
- State rank
- #535 of 590 in NY
Livability — Buffalo
- Score
- 77/100
- State rank
- #195
- US rank
- #3011
Category grades
Schools grade is shown separately in the Schools card above.
Census & demographics
- Census place
- Buffalo, NY
- County
- Erie County · 714,559 people
- City population
- 440,021
- Metro
- Buffalo-Cheektowaga, NY
- Population (ZIP)
- 22,849
- Household income
- $69,629
- Rent vs Own
- Severe rent burden
- 1831.0
Population outlook (Erie County) Hauer SSP2
- Today (2025)
- 933,037 people
- By 2030
- 935,181 · +0.2%
- By 2040
- 928,531 · -0.5%
- By 2050
- 905,725 · -2.9%
- By 2075
- 834,037 · -10.6%
- By 2100
- 708,033 · -24.1%
Race, ethnicity, and origin ACS 2023
- Neighborhood character
- Predominantly White (72%)
- Race & ethnicity
- White 72% Black 16% Hispanic / Latino 7% Two or more races 5% Asian 1%
- Hispanic origin (detail)
- Puerto Rican 5%
- Common ancestry
- Romanian 10% Iranian 2% Lithuanian 1%
- Foreign-born
- 5% · Canada, China
- Languages at home
- 90% English-only · Spanish 5% French/Haitian/Cajun 1% Other Indo-European 1%
Political lean MEDSL · Erie
- 2024 margin
- Lean D (+9.7) · D 54.8% · R 45.2%
- 2008→2024 swing
- -7.9pp toward R · 2008: 17.5pp · 2024: 9.7pp
- All cycles
- 2024: D+9.7 2020: D+14.7 2016: D+4.8 2012: D+15.6 2008: D+17.5
Not yet ingested
- Civics
- —
Market trends
- HPI YoY
- ▼ -264.53%
- Current HPI
- 421.1138
- Rent YoY
- ▲ 3.65%
- Metro
- Buffalo-Cheektowaga, NY
- State GDP YoY
- ▲ 2.60%
- F500 in state
- 92
Industry mix (Fortune 500 HQ in NY)
| Industry | F500 HQs | Revenue |
|---|---|---|
| Financial Services | 10 | $950B |
|
||
| Consumer Goods | 9 | $162B |
|
||
| Insurance | 4 | $225B |
|
||
| Telecommunications | 2 | $144B |
|
||
| Pharmaceuticals | 2 | $112B |
|
||
| Media / Entertainment | 2 | $69B |
|
||
Price history
+33.4% since first listed17 events — show timeline
- 2026-06-09 Listed $200,000 WNYREIS
- 2026-06-09 Listed $200,000 WNYREIS
- 2026-05-23 Listing Removed — WNYREIS
- 2026-05-22 Listing Removed — WNYREIS
- 2026-05-22 Listing Removed — WNYREIS
- 2026-05-07 Listing Removed — WNYREIS
- 2026-05-06 Listed $230,000 WNYREIS
- 2026-05-06 Listed $230,000 WNYREIS
- 2024-01-03 Sold (Public Records) $175,000 Public Records
- 2024-01-03 Sold (MLS) $175,000 WNYREIS
- 2024-01-03 Sold (MLS) $175,000 WNYREIS
- 2023-12-27 Pending — WNYREIS
- 2023-12-27 Pending — WNYREIS
- 2023-10-19 Pending — WNYREIS
- 2023-10-19 Pending — WNYREIS
- 2023-10-11 Listed $149,900 WNYREIS
- 2023-10-11 Listed $149,900 WNYREIS
Property tax history
+4.4%/yrLatest (2025): $611 · -24.8% YoY. Source: county tax records.
Cash-flow waterfall
monthlySold comps — $/sqft
last 12 mo · ≤1 miLoading sold comps…