10351 Bowman Ave · Ensley, FL
Flood risk 1/10 · Minimal
- FEMA flood zone
- X (unshaded)
- Chance of flooding over 30 yrs
- 0.0%
- Est. flood insurance / yr
- $507 – $1,088
Fire risk 2/10 · Minimal
- Est. fire insurance / yr
- $947 – $1,759
Heat risk 10/10 · Severe
- Hot days now (above 106°F)
- 7 days/yr
- Hot days in 30 yrs
- 21 days/yr
Wind risk 9/10 · Severe
- Chance of severe wind over 30 yrs
- 99.0%
Air-quality risk 1/10 · Minimal
- Unhealthy air days now
- 0 days/yr
- Unhealthy air days in 30 yrs
- 0 days/yr
Risk factors via First Street. Map © Google.
Why this score? — see what drove the B grade
The composite is a weighted blend of 9 inputs, each scored 0–100. Each bar is that input's sub-score; the figure is the points it added to the 100-point composite (weight × sub-score).
- Cash flow +30.0/30.0
- 1% rule +10.0/10.0
- DSCR +10.0/10.0
- ARV discount +7.5/15.0
- Livability +4.0/5.0
- Schools +3.6/10.0
- Rent growth +3.4/5.0
- Condition / age +2.5/5.0
- Appreciation +0.0/10.0
$60,000
🖨 Deal sheet (PDF) 📄 Offer letter ✓ Due diligence
Listing remarks MLS
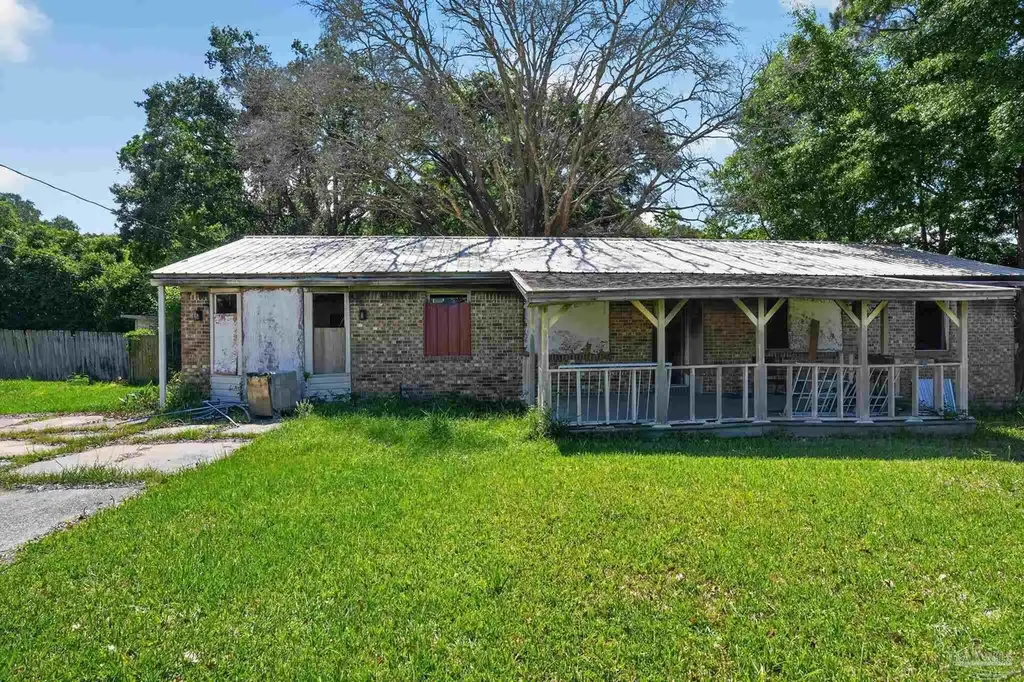
BRICK HOME LOCATED CLOSE TO SHOPPING, NAS PENSACOLA, CORRY STATION,UWF AND I- 10.THIS PROPERTY HAS GOOD POTENTIAL FOR THE RIGHT BUYER. PURCHASE THIS PROPERTY FOR AS LITTLE AS 3% DOWN.
Key facts
- 0.33 acre lot
- Built 1976
- Listed 21 days
Property features AI
Finance
- HOA & community: No homeowners association
Exterior
- Parking: Driveway with open parking
- Utilities: Public sewer
- Home design: One-story brick residence; Resale property; Not attached to another property; County-maintained road access
- Construction: Built on a slab foundation; Metal roof; Brick construction; One level
- Exterior features: Interior lot; Does not allow horses
Interior
- Kitchen: No kitchen feature details provided
- Bedrooms: Master bedroom on the first floor (approximately 7 x 7)
- Flooring: Flooring details listed in remarks
- Bathrooms: Two full bathrooms (bathrooms located on the first floor)
- Interior features: Storage
- Laundry & utility: No water heater
Neighborhood map
What this means for you Summary
Snapshot
- This is a 3-bed/2.0-bath single-family listed at $60k.
Deal economics
- At list price, monthly cash flow is $1k ($14k/yr) — positive.
- The deal already cash-flows at list — no discount required.
- Meets the 1% rule at list price ($2k rent vs $60k).
- Recommended offer: $59k (1.5% below list) — sets the bar for market timing.
- Cap rate 28.9% vs local median 4.6% in Ensley — top-decile yield for the area; either an underpriced asset or a hidden risk that comps aren't pricing in. Stress-test before assuming the spread holds.
Location & tenants
- Location reads 79/100 on livability (#133 in FL, #1,996 nationally) — a middle-class / working-renter tenant base. Strengths: cost of living A+, housing A+, health & safety A+; Watch: amenities D, employment D, schools F.
- Escambia (suburban): math 40% / reading 45% proficiency, ranked #56 of 73 in FL (top 77%) — families likely to look elsewhere, expect single-tenant / working-renter base with shorter leases.
- Market conditions: Rents rising (+3.6%/yr); 116 active listings in the ZIP; 14 comparable units currently listed for rent nearby; rentals at typical pace (median 23d on market — plan ~3-4 weeks tenant-placement turnaround); 1,479 units permitted in Escambia County in 2024 (0 in 5+ unit buildings).
- This rent runs 39% of the median local income ($59k/yr) — at the standard rent-burdened threshold; future hikes will face affordability resistance.
Forward outlook
- Local home prices are declining (-3.0%/yr); year-one equity from $415 of loan paydown is wiped out by about $2k of value loss. Plan a longer hold.
- Escambia County population projected at +13% by 2050 — modest demand growth; plan on rents tracking national, not racing it.
- At projected returns (-3.0% appreciation + 3.6% rent growth), your $17k cash investment doubles in ~2 years — after that, you're playing with house money.
Negotiation context
- It's been on market 21 days — a 2% lower offer ($59k) is reasonable based on typical stale-listing flexibility.
- 2 sale attempts since 13y ago; this cycle's ask has dropped $10k (14%) from the opening price — seller is motivated, your offer sets the floor, not the list.
- Current owner paid $39k; list at $60k implies a 54% gain — meaningful room to come down on a strong offer.
Risks & watch-outs
- Climate carrying-cost: severe wind risk, 99% chance of damaging wind over 30y; extreme-heat days projected 7→21/yr by 2055 (HVAC capex compounding) — expect insurance premiums to compound above CPI over the hold.
Questions for the listing agent
- Built in 1976 — when were the roof, HVAC, electrical panel, plumbing, and water heater last replaced?
- Is there a deadline driving the sale (1031 exchange, divorce, estate, relocation)? That informs how much negotiation room exists.
- Schools are F-rated, which usually means shorter tenancies and higher turnover. Who's the typical renter profile here, and what's been the actual vacancy rate?
- What's the average days-on-market for RENTAL listings here right now (not sales)? A rising rental-DOM trend means longer vacancies and softer asking-rent achievability than the comps imply.
- What's the recent tenant-quality profile in this submarket — average credit score on applications, eviction rate, late-payment / NSF rate, and stable-employment percentage? A property-management company in the area should have these aggregated.
- How much new for-sale + rental construction is in the pipeline within 1–3 miles? Heavy new supply typically softens prices + rents 12–24 months out; constrained supply supports both.
Investment metrics
- 1% rule
- 3.18% ✓
- Cap rate
- 28.94%
- Cash-on-cash
- 80.89%
- DSCR
- 4.60
- GRM
- 2.6
CMA / ARV
- ARV (on-the-fly)
- $298,220
- Comps found
- 12
Show comp detail 12 sales within ~0.75 mi
| Address | Dist | Beds/Ba | Sqft | Sold | Price | $/sf | Match |
|---|---|---|---|---|---|---|---|
| 3346 Bliss Ln Unit 8A | 0.40mi | 3/2.5 | 1,648 (+2%) | 8mo | $317,900 | $193 | 69 |
| 1762 Leigh Loop Unit 2D | 0.41mi | 3/2.0 | 1,717 (+6%) | 9mo | $318,750 | $186 | 62 |
| 3362 Bliss Ln Unit 4A | 0.40mi | 3/2.0 | 1,425 (-12%) | 4mo | $314,030 | $220 | 59 |
| 1778 Leigh Loop Unit 6D | 0.44mi | 3/2.0 | 1,425 (-12%) | 7mo | $306,000 | $215 | 54 |
| 535 Evening Falls Dr | 0.44mi | 3/2.0 | 1,428 (-11%) | 9mo | $233,000 | $163 | 53 |
| 3359 Bliss Ln Unit 4E | 0.37mi | 4/2.0 (+1) | 1,820 (+13%) | 6mo | $332,300 | $183 | 51 |
| 3367 Bliss Ln Unit 2E | 0.37mi | 4/2.0 (+1) | 1,820 (+13%) | 6mo | $333,170 | $183 | 51 |
| 3330 Bliss Ln Unit 12A | 0.41mi | 4/2.5 (+1) | 1,817 (+13%) | 4mo | $336,800 | $185 | 50 |
| 3338 Bliss Ln Unit 10A | 0.41mi | 4/2.5 (+1) | 1,817 (+13%) | 5mo | $333,100 | $183 | 49 |
| 1774 Leigh Loop Unit 5D | 0.43mi | 4/2.5 (+1) | 1,817 (+13%) | 6mo | $333,200 | $183 | 47 |
| 3844 Stefani Rd | 0.68mi | 3/1.0 | 1,426 (-12%) | 1mo | $215,000 | $151 | 44 |
| 1403 Twilight Dr | 0.70mi | 4/2.0 (+1) | 1,820 (+13%) | 5mo | $350,000 | $192 | 37 |
Match score weights: distance 35% · size 25% · config 20% · recency 20%. Top-matched comps best support the ARV.
Projected returns pro-forma
-3.0% appreciation · 3.63% rent growth · sell at horizon
- IRR
- 81.8%
- Equity multiple
- 4.79×
- Total profit
- $63,623
- Equity at exit
- $8,946
- IRR
- 85.3%
- Equity multiple
- 10.13×
- Total profit
- $153,344
- Equity at exit
- $5,188
Cash invested: $16,800 (down + closing). Projections, not guarantees.
Landlord ↔ Tenant lean methodology
- Overall (STATE)
- 87 Strongly Landlord-Friendly
- State Florida
- 87 Strongly Landlord-Friendly · R+3
- County
- — inherits STATE
- City
- — inherits STATE
ZIP-level market 32534
- Home prices YoY
- -19.1%
- Rents YoY
- 3.6%
- Active inventory
- 116
- Price-to-rent
- 2.6×
Monthly cashflow live
- Estimated rent
- $1,906 high interval (Pro) →
- Mortgage (P&I)
- −$315
- Tax from tax record
- −$34 /mo · $404/yr
- Insurance
- −$25
- HOA
- −$0
- Vacancy / Maint / Mgmt
- −$400
- Net cashflow
- $1,132
Break-even live
Sensitivity live
| Price | -10% $1,166 | -5% $1,149 | +0% $1,132 | +5% $1,115 | +10% $1,098 |
|---|---|---|---|---|---|
| Rent | -10% $982 | -5% $1,057 | +0% $1,132 | +5% $1,208 | +10% $1,283 |
| Rate | -1.0pp $1,163 | -0.5pp $1,148 | base $1,132 | +0.5pp $1,117 | +1.0pp $1,101 |
UW: 25.0% down · 7.5% · 30yr · 1.5% tax · 5.0% vac · 8.0% maint · 8.0% mgmt
Financing live
Cash to close
- Down payment
- $15,000
- Closing costs
- $1,800
- Reserves months
- —
- Total cash needed
- —
Loan-product check · same deal, 3 products live
Conventional
25% down · 7.5% · 30yr
- Down + closing
- —
- Monthly P&I
- —
- Monthly cashflow
- —
- DSCR
- —
- Eligible?
- —
Personal DTI + credit; lowest rate.
DSCR
20% down · 8.5% · 30yr
- Down + closing
- —
- Monthly P&I
- —
- Monthly cashflow
- —
- DSCR
- —
- Eligible?
- —
No personal income docs; deal must DSCR.
Hard money
10% down · 12.0% · 12mo
- Down + closing
- —
- Monthly P&I
- —
- Monthly cashflow
- —
- DSCR
- —
- Eligible?
- —
Short-term bridge; refi at stabilization.
Rent comps 14 comps
| Address | Beds | Baths | Sqft | Rent | $/sqft | DOM | Units | Dist |
|---|---|---|---|---|---|---|---|---|
| 1229 W Ten Mile Rd Cantonment, FL | 3.0 | 2.0 | 1528 | $2,000 | $1.31 | 24d | 1 | 0.38mi |
| 3310 Bliss Ln Cantonment, FL | 3.0 | 2.0 | 1491 | $2,100 | $1.41 | 15d | 1 | 0.41mi |
| 9980 Bowman Ave Unit N Pensacola, FL | 3.0 | 2.0 | 1150 | $1,595 | $1.39 | 22d | 1 | 0.57mi |
| 9980 Bowman Ave Unit L Pensacola, FL | 3.0 | 2.0 | 1150 | $1,595 | $1.39 | 15d | 1 | 0.57mi |
| 217 Cohasset Ct Pensacola, FL | 3.0 | 2.0 | 1391 | $1,875 | $1.35 | 15d | 1 | 0.87mi |
| 10493 River Birch Dr Pensacola, FL | 2.0 | 2.0 | 1053 | $1,525 | $1.45 | 24d | 1 | 0.89mi |
| 28 Easton St Cantonment, FL | 3.0 | 2.0 | 1695 | $1,850 | $1.09 | 15d | 1 | 1.10mi |
| 1431 W Nine Mile Rd Pensacola, FL | 1.0–3.0 | 1.0–2.0 | 1017 | $1,780 | $1.75 | 15d | 12 | 1.18mi |
| 1559 W Nine Mile Rd Pensacola, FL | 1.0–2.0 | 1.0–2.0 | 894 | $2,280 | $2.55 | 15d | 31 | 1.26mi |
| 1524 Farragut Way Pensacola, FL | 3.0 | 2.5 | 1537 | $1,750 | $1.14 | 15d | 1 | 1.30mi |
| 8980 Brigade Trl Pensacola, FL | 3.0 | 2.5 | 1537 | $1,725 | $1.12 | 24d | 1 | 1.34mi |
| 8980 Brigade Trl Pensacola, FL | 3.0 | 2.5 | 1537 | $1,725 | $1.12 | 22d | 1 | 1.34mi |
| 8932 Abbington Dr Pensacola, FL | 3.0 | 2.0 | 1576 | $2,015 | $1.28 | 24d | 1 | 1.43mi |
| 8932 Brigade Trl Pensacola, FL | 3.0 | 2.5 | 1530 | $1,825 | $1.19 | 24d | 1 | 1.43mi |
Listing history 17 events
-
2026-06-17status $60,000 Pending 21 DOM
-
2026-06-16days on market $60,000 Contingent 21 DOM
-
2026-06-15days on market $60,000 Contingent 20 DOM
-
2026-06-14statusdays on market $60,000 Contingent 18 DOM
-
2026-06-10days on market $60,000 Active 15 DOM
-
2026-06-09days on market $60,000 Active 14 DOM
-
2026-06-08days on market $60,000 Active 13 DOM
-
2026-06-07days on market $60,000 Active 12 DOM
-
2026-06-03days on market $60,000 Active 8 DOM
-
2026-06-02pricedays on market $60,000 Active 7 DOM
-
2026-06-01days on market $69,900 Active 6 DOM
-
2026-05-31days on market $69,900 Active 5 DOM
-
2026-05-31days on market $69,900 Active 4 DOM
-
2026-05-26$69,900 Active
-
2013-07-15soldstatus $39,000 183-char remark
Show marketing remark (183 chars)
BRICK HOME LOCATED CLOSE TO SHOPPING, NAS PENSACOLA, CORRY STATION,UWF AND I- 10.THIS PROPERTY HAS GOOD POTENTIAL FOR THE RIGHT BUYER. PURCHASE THIS PROPERTY FOR AS LITTLE AS 3% DOWN.
-
2013-02-26$49,900 183-char remark
Show marketing remark (183 chars)
BRICK HOME LOCATED CLOSE TO SHOPPING, NAS PENSACOLA, CORRY STATION,UWF AND I- 10.THIS PROPERTY HAS GOOD POTENTIAL FOR THE RIGHT BUYER. PURCHASE THIS PROPERTY FOR AS LITTLE AS 3% DOWN.
-
1976-01-01soldstatus $24,500
ⓘ Source: listings_history table (triggers on properties + properties_extension) + one-shot
backfill from property_details.listing_events for pre-trigger history.
Tax reassessment forecast FL · Resets to sale price
- Current annual tax
- $404 · $34/mo
- Projected year-2 tax
- $498 · $42/mo
- Expected delta
- +$94/yr (+$8/mo · 23.3%)
ⓘ Screening estimate from a state-policy table — verify with the county assessor before closing.
Climate risk First Street
- Flood 1/10 Low FEMA zone X (unshaded) · 0% chance over 30 yrs
- Wildfire 2/10 Low
- Heat 10/10 Extreme 7 d/yr ≥106°F today · 21 d/yr by 30 yrs out
- Wind 9/10 Extreme 99% chance of damaging wind over 30 yrs
- Air quality 1/10 Low 0 unhealthy d/yr today · 0 by 30 yrs out
Nearby sold comps map
Loading sold comps map…
Walkable amenities ~0.75 mi
Loading nearby amenities…
Taxation est. · year 1
- Rental income
- $22,872
- − Mortgage interest
- −$3,361
- − Property taxes
- −$404
- − Insurance
- −$300
- − Repairs & maintenance
- −$1,830
- − Management
- −$1,830
- − Depreciation
- −$1,745
- Taxable income
- $13,403
- Est. tax owed @ 24.0%
- −$3,217
- After-tax cash flow
- $10,373/yr
For passive investors: Depreciation is non-cash, so a rental often shows a tax loss while cash-flowing — sheltering income. Rental losses are passive: they offset passive income freely, and up to $25,000/yr can offset ordinary (W-2) income if you actively participate and your MAGI is under $100k (phasing out to $0 by $150k); unused losses carry forward. On sale, claimed depreciation is recaptured at up to 25%, and gains may owe capital-gains tax (a 1031 exchange can defer both). Figures are a year-1 estimate at your 24.0% rate — not tax advice; consult a CPA.
Schools (NCES district)
- District
- Escambia
- NCES district ID
- 1200510
- Math proficiency
- 40% ▼ -9.00%
- Reading proficiency
- 45% ▼ -4.00%
- Median HH income
- $44,649
- Composite
- 36.04/100
- National rank
- #4773
- State rank
- #56 of 73 in FL
Livability — Ensley
- Score
- 79/100
- State rank
- #133
- US rank
- #1996
Category grades
Schools grade is shown separately in the Schools card above.
Census & demographics
- Census place
- Ensley, FL
- County
- Escambia County · 301,722 people
- City population
- 15,879
- Metro
- Pensacola-Ferry Pass-Brent, FL
- Population (ZIP)
- 17,104
- Household income
- $58,992
- Rent vs Own
- Severe rent burden
- 540.0
Population outlook (Escambia County) Hauer SSP2
- Today (2025)
- 334,637 people
- By 2030
- 345,779 · +3.3%
- By 2040
- 364,828 · +9.0%
- By 2050
- 378,514 · +13.1%
- By 2075
- 403,220 · +20.5%
- By 2100
- 386,125 · +15.4%
Race, ethnicity, and origin ACS 2023
- Neighborhood character
- Diverse neighborhood (Simpson 0.65)
- Race & ethnicity
- White 51% Black 30% Two or more races 9% Hispanic / Latino 8% Asian 5%
- Hispanic origin (detail)
- Mexican 2%
- Common ancestry
- Serbian 3% Italian 2% Portuguese 1%
- Foreign-born
- 8% · Canada, Vietnam, Jamaica
- Languages at home
- 89% English-only · Spanish 6% Vietnamese 2% Tagalog/Filipino 1%
Political lean MEDSL · Escambia
- 2024 margin
- R (+19.5) · D 39.7% · R 59.2% · Other 1.1%
- 2008→2024 swing
- -0.2pp no change · 2008: -19.3pp · 2024: -19.5pp
- All cycles
- 2024: R+19.5 2020: R+15.1 2016: R+20.6 2012: R+20.6 2008: R+19.3
Not yet ingested
- Civics
- —
Market trends
- HPI YoY
- ▼ -60.23%
- Current HPI
- 255.7617
- Rent YoY
- ▲ 3.63%
- Metro
- Pensacola-Ferry Pass-Brent, FL
- State GDP YoY
- ▲ 3.28%
- F500 in state
- 36
Industry mix (Fortune 500 HQ in FL)
| Industry | F500 HQs | Revenue |
|---|---|---|
| Industrial Technology | 2 | $29B |
|
||
| Insurance | 2 | $17B |
|
||
| Retail | 1 | $60B |
|
||
| Technology Distribution | 1 | $58B |
|
||
| Homebuilding | 1 | $35B |
|
||
| Technology Manufacturing | 1 | $35B |
|
||
Price history
+185.3% since first listed4 events — show timeline
- 2026-05-26 Listed $69,900 PARMLS
- 2013-07-15 Sold (MLS) $39,000 PARMLS
- 2013-02-26 Listed $49,900 PARMLS
- 1976-01-01 Sold (Public Records) $24,500 Public Records
Property tax history
-2.9%/yrLatest (2025): $404 · -78.9% YoY. Source: county tax records.
Cash-flow waterfall
monthlySold comps — $/sqft
last 12 mo · ≤1 miLoading sold comps…