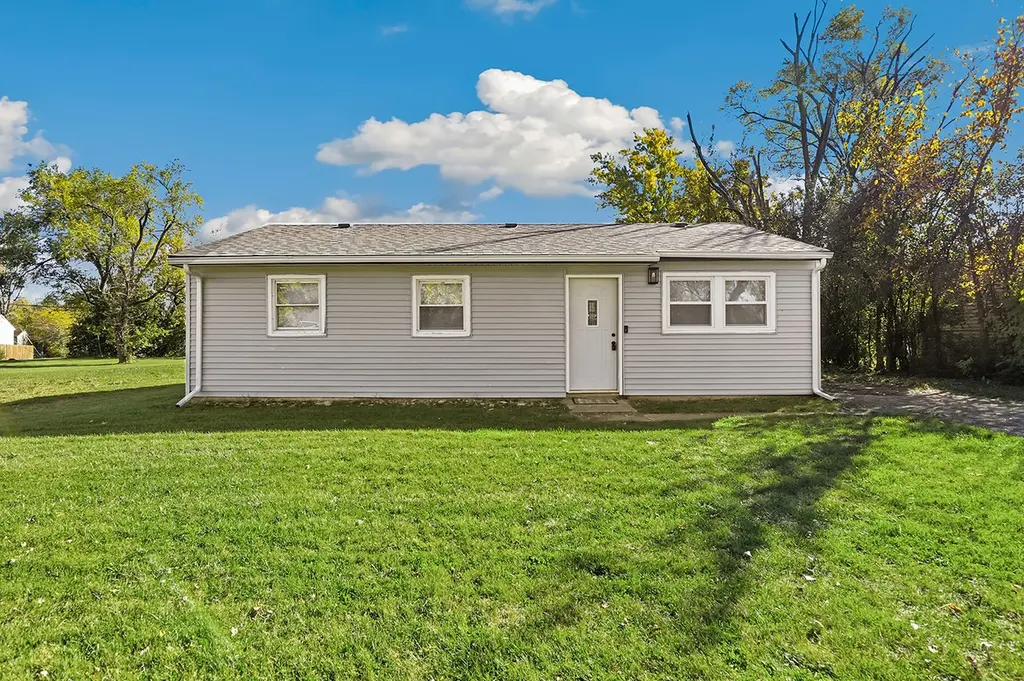
1941 Cambridge St · Chicago Heights, IL
Flood risk 1/10 · Minimal
- FEMA flood zone
- X (unshaded)
- Chance of flooding over 30 yrs
- 0.0%
- Est. flood insurance / yr
- $473 – $860
Fire risk 1/10 · Minimal
- Est. fire insurance / yr
- $804 – $1,492
Heat risk 3/10 · Minor
- Hot days now (above 101°F)
- 7 days/yr
- Hot days in 30 yrs
- 16 days/yr
Wind risk 2/10 · Minimal
- Chance of severe wind over 30 yrs
- —
Air-quality risk 2/10 · Minimal
- Unhealthy air days now
- 1 days/yr
- Unhealthy air days in 30 yrs
- 1 days/yr
Risk factors via First Street. Map © Google.
Why this score? — see what drove the C- grade
The composite is a weighted blend of 9 inputs, each scored 0–100. Each bar is that input's sub-score; the figure is the points it added to the 100-point composite (weight × sub-score).
- Cash flow +21.8/30.0
- 1% rule +7.1/10.0
- DSCR +7.0/10.0
- ARV discount +4.5/15.0
- Rent growth +4.1/5.0
- Livability +3.6/5.0
- Condition / age +2.5/5.0
- Schools +0.9/10.0
- Appreciation +0.0/10.0
$145,000
🖨 Deal sheet 📄 Offer letter ✓ Due diligence
Listing remarks
Just move in and start making memories! This fully-remodeled ranch home is ready for it's new owners! Enjoy the open concept and stair-free floor plan with luxury vinyl plank flooring, recessed lighting, and fresh paint throughout. The living room is the perfect place to gather and unwind with family and friends. Prepare meals in style in the chef's kitchen featuring new white cabinetry, quartz countertops, center island and stainless steel appliances. This home offers 3 spacious bedrooms, a spa-inspired bathroom, and a convenient utility room with washer/dryer hookup. Outside, relax in the large and private yard. 3 car parking in the driveway. Other great property improvements include a
Key facts
- Quartz countertops
- Open concept
- New white cabinetry
Tags
Property features AI
Finance
- Financial info: Special service area: No
- HOA & community: No master association fee required; Community features include curbs, sidewalks, street lights and paved streets
Exterior
- Parking: Parking details not provided
- Security: No specific security features listed
- Utilities: Public water; Public sewer; Electric service with circuit breakers
- Home design: Detached single-family home; One-story property; Fee simple ownership; Rehab completed in 2025; Interstate access nearby; Built before 1978
- Construction: Vinyl siding; Asphalt roof; Estimated age: 51–60 years
- Exterior features: Curbs, sidewalks, street lights, and paved streets
Interior
- Kitchen: Kitchen with island; Range; Dishwasher; Refrigerator; Kitchen/Dining combo
- Bedrooms: 3 bedrooms (all on the main level)
- Flooring: Vinyl flooring throughout main living areas and bedrooms
- Bathrooms: 1 full bathroom
- Heating & cooling: Natural gas and electric heating; Central air conditioning
- Interior features: Six total rooms; Some photos virtually staged
- Laundry & utility: In-unit laundry in a laundry closet
Neighborhood map
What this means for you Summary
Snapshot
- This is a 2-bed/1.0-bath single-family listed at $145k.
Deal economics
- At list price, monthly cash flow is $226 ($3k/yr) — positive.
- The deal already cash-flows at list — no discount required.
- Meets the 1% rule at list price ($2k rent vs $145k).
- Recommended offer: $136k (6.0% below list) — sets the bar for market timing.
- Cap rate 8.2% vs local median 6.4% in Chicago Heights — meaningfully above typical; check what's discounted (condition, days-on-market, listing class) to confirm the premium yield is real.
Location & tenants
- Location reads 71/100 on livability (#339 in IL) — a middle-class / working-renter tenant base. Strengths: commute A+, cost of living A+, housing A+; Watch: employment C-, schools F, crime F.
- Rich Twp Hsd 227 (suburban): math 5% / reading 12% proficiency, ranked #577 of 620 in IL (top 93%) — low school quality limits family demand, transient renter base, plan for 1-2y turnover.
- Market conditions: Rents rising fast (+6.5%/yr); 222 active listings in the ZIP; 12 comparable units currently listed for rent nearby; rentals leasing fast (median 8d on market — plan ~1-2 weeks tenant-placement turnaround); 6,272 units permitted in Cook County in 2024 (4,658 in 5+ unit buildings).
- This rent runs 34% of the median local income ($62k/yr) — at the standard rent-burdened threshold; future hikes will face affordability resistance.
Forward outlook
- Local home prices are declining (-3.0%/yr); year-one equity from $1k of loan paydown is wiped out by about $4k of value loss. Plan a longer hold.
- At projected returns (-3.0% appreciation + 6.5% rent growth), your $41k cash investment doubles in ~9 years — after that, you're playing with house money.
Negotiation context
- It's been on market 62 days — a 6% lower offer ($136k) is reasonable based on typical stale-listing flexibility.
- 5 sale attempts since 19y ago with the ask held roughly flat each time — persistent listings suggest the price (not the market) is what's stuck; bring a comps-based counter.
- Current owner paid $48k; list at $145k implies a 202% gain — meaningful room to come down on a strong offer.
Risks & watch-outs
- Watch-outs: property tax is 2.8% of price.
Questions for the listing agent
- It's been on market 62 days. Have you received any prior offers? Is the seller open to a 6% concession, seller financing, or rate buy-down credit?
- Built in 1970 — when were the roof, HVAC, electrical panel, plumbing, and water heater last replaced?
- Property tax is high relative to price — has the assessment been appealed recently, and will the sale trigger a re-assessment?
- Why hasn't it sold? Are there any deal-killer items the seller is aware of (foundation, flood, title, zoning, code violations)?
- Is there a deadline driving the sale (1031 exchange, divorce, estate, relocation)? That informs how much negotiation room exists.
- Schools are F-rated, which usually means shorter tenancies and higher turnover. Who's the typical renter profile here, and what's been the actual vacancy rate?
- Crime grade is F in this area — have there been break-ins, vandalism, or insurance claims at this property in the last 3 years? What carrier currently insures it and at what premium?
- What's the average days-on-market for RENTAL listings here right now (not sales)? A rising rental-DOM trend means longer vacancies and softer asking-rent achievability than the comps imply.
- What's the recent tenant-quality profile in this submarket — average credit score on applications, eviction rate, late-payment / NSF rate, and stable-employment percentage? A property-management company in the area should have these aggregated.
- How much new for-sale + rental construction is in the pipeline within 1–3 miles? Heavy new supply typically softens prices + rents 12–24 months out; constrained supply supports both.
Investment metrics
- 1% rule
- 1.21% ✓
- Cap rate
- 8.16%
- Cash-on-cash
- 6.67%
- DSCR
- 1.30
- GRM
- 6.9
CMA / ARV
- ARV (on-the-fly)
- $136,012
- Comps found
- 12
Show comp detail 12 sales within ~0.75 mi
| Address | Dist | Beds/Ba | Sqft | Sold | Price | $/sf | Match |
|---|---|---|---|---|---|---|---|
| 1941 Cambridge St | 0.00mi | 3/1.0 (+1) | 919 (0%) | 1mo | $145,000 | $158 | 94 |
| 1946 Dartmouth St | 0.11mi | 3/1.0 (+1) | 910 (-1%) | 2mo | $160,000 | $176 | 86 |
| 1947 Yale Ave | 0.07mi | 3/1.0 (+1) | 919 (0%) | 7mo | $164,000 | $178 | 86 |
| 270 Plymouth Dr | 0.17mi | 3/1.0 (+1) | 925 (+1%) | 6mo | $48,000 | $52 | 81 |
| 1897 Division St | 0.40mi | 3/1.0 (+1) | 914 (-0%) | 4mo | $115,000 | $126 | 72 |
| 324 Hickory St | 0.24mi | 2/1.0 | 1,000 (+9%) | 8mo | $145,000 | $145 | 67 |
| 563 Shelly Ln | 0.61mi | 2/1.5 | 842 (-8%) | 6mo | $55,000 | $65 | 51 |
| 293 W 15th St | 0.59mi | 2/1.5 | 832 (-10%) | 5mo | $133,900 | $161 | 50 |
| 1946 Wooster Ct | 0.62mi | 3/1.0 (+1) | 985 (+7%) | 5mo | $48,500 | $49 | 50 |
| 544 W 16th Pl | 0.58mi | 3/1.5 (+1) | 1,018 (+11%) | 7mo | $172,000 | $169 | 42 |
| 1661 Euclid Ave | 0.69mi | 3/1.0 (+1) | 988 (+8%) | 11mo | $72,000 | $73 | 41 |
| 580 W 16th St | 0.68mi | 3/1.0 (+1) | 1,050 (+14%) | 9mo | $155,000 | $148 | 32 |
Match score weights: distance 35% · size 25% · config 20% · recency 20%. Top-matched comps best support the ARV.
Projected returns pro-forma
-3.0% appreciation · 6.48% rent growth · sell at horizon
- IRR
- -1.6%
- Equity multiple
- 0.94×
- Total profit
- $-2,613
- Equity at exit
- $21,620
- IRR
- 11.9%
- Equity multiple
- 2.10×
- Total profit
- $44,861
- Equity at exit
- $12,537
Cash invested: $40,600 (down + closing). Projections, not guarantees.
Landlord ↔ Tenant lean methodology
- Overall (STATE)
- 43 Moderately Tenant-Leaning
- State Illinois
- 43 Moderately Tenant-Leaning · D+7
- County
- — inherits STATE
- City
- — inherits STATE
ZIP-level market 60411
- Home prices YoY
- -33.9%
- Rents YoY
- 6.5%
- Active inventory
- 222
- Price-to-rent
- 6.9×
Monthly cashflow live
- Estimated rent
- $1,760 high interval (Pro) →
- Mortgage (P&I)
- −$760
- Tax from tax record
- −$343 /mo · $4,121/yr
- Insurance
- −$60
- HOA
- −$0
- Vacancy / Maint / Mgmt
- −$370
- Net cashflow
- $226
Break-even live
UW: 25.0% down · 7.5% · 30yr · 1.5% tax · 5.0% vac · 8.0% maint · 8.0% mgmt
Financing live
Cash to close
- Down payment
- $36,250
- Closing costs
- $4,350
- Reserves months
- —
- Total cash needed
- —
Loan-product check · same deal, 3 products live
Conventional
25% down · 7.5% · 30yr
- Down + closing
- —
- Monthly P&I
- —
- Monthly cashflow
- —
- DSCR
- —
- Eligible?
- —
Personal DTI + credit; lowest rate.
DSCR
20% down · 8.5% · 30yr
- Down + closing
- —
- Monthly P&I
- —
- Monthly cashflow
- —
- DSCR
- —
- Eligible?
- —
No personal income docs; deal must DSCR.
Hard money
10% down · 12.0% · 12mo
- Down + closing
- —
- Monthly P&I
- —
- Monthly cashflow
- —
- DSCR
- —
- Eligible?
- —
Short-term bridge; refi at stabilization.
Rent comps 12 comps
| Address | Beds | Baths | Sqft | Rent | $/sqft | DOM | Units | Dist |
|---|---|---|---|---|---|---|---|---|
| 370 E 17th St Chicago Heights, IL | 3.0 | 1.0 | 1058 | $2,600 | $2.46 | 17d | 1 | 0.29mi |
| 417 W Hickory St Unit 2 Chicago Heights, IL | 3.0 | 1.0 | 900 | $1,800 | $2.00 | 21d | 1 | 0.32mi |
| 436 W Hickory St Unit Na Chicago Heights, IL | 3.0 | 1.0 | 1091 | $1,800 | $1.65 | 1d | 1 | 0.33mi |
| 444 Hickory St Unit 2A Chicago Heights, IL | 3.0 | 1.0 | 900 | $1,695 | $1.88 | 1d | 1 | 0.34mi |
| 63 Hickory St Unit 2 Chicago Heights, IL | 3.0 | 1.0 | 900 | $1,700 | $1.89 | 24d | 1 | 0.77mi |
| 631 Andover St Chicago Heights, IL | 3.0 | 1.0 | 900 | $1,450 | $1.61 | 4d | 1 | 0.79mi |
| 83 W 15th St #1 Chicago Heights, IL | 3.0 | 1.0 | 1050 | $1,500 | $1.43 | 3d | 1 | 0.87mi |
| 53 W 15th St Apt 2 Chicago Heights, IL | 1.0 | 1.0 | 700 | $900 | $1.29 | 24d | 1 | 0.93mi |
| 41 E Main St Unit 2 Chicago Heights, IL | 2.0 | 1.0 | 1000 | $1,550 | $1.55 | 7d | 1 | 1.00mi |
| 236 Chestnut Ave Unit S South Chicago Heights, IL | 3.0 | 1.0 | 1032 | $2,000 | $1.94 | 24d | 1 | 1.18mi |
| 3324 Western Ave Park Forest, IL | 1.0–3.0 | 1.0 | 1026 | $1,680 | $1.64 | 1d | 11 | 1.31mi |
| 3484 Western Ave Unit 3484-B Park Forest, IL | 1.0 | 1.0 | 600 | $1,300 | $2.17 | 1d | 1 | 1.49mi |
Listing history 17 events
-
2026-05-21status Pending
-
2026-04-17historical Contingent - Continue to Show
-
2026-03-20$145,000 Active
-
2026-03-20historical
-
2026-02-03Active
-
2026-02-03historical
-
2025-12-05historical
-
2025-12-04price
-
2025-12-04Active
-
2025-11-07Active
-
2007-07-03historical
-
2007-03-02
-
2005-05-26soldstatus $48,000
-
2001-01-18soldstatus $40,000
-
1989-02-01soldstatus $41,562
-
1982-02-10soldstatus $29,500
-
1981-03-18soldstatus $7,000
ⓘ Source: listings_history table (triggers on properties + properties_extension) + one-shot
backfill from property_details.listing_events for pre-trigger history.
Tax reassessment forecast IL · Partial reset (capped growth)
- Current annual tax
- $4,121 · $343/mo
- Projected year-2 tax
- $4,121 · $343/mo
- Expected delta
- $0/yr ($0/mo · 0.0%)
ⓘ Screening estimate from a state-policy table — verify with the county assessor before closing.
Climate risk First Street
- Flood 1/10 Low FEMA zone X (unshaded) · 0% chance over 30 yrs
- Wildfire 1/10 Low
- Heat 3/10 Moderate 7 d/yr ≥101°F today · 16 d/yr by 30 yrs out
- Wind 2/10 Low
- Air quality 2/10 Low 1 unhealthy d/yr today · 1 by 30 yrs out
Nearby sold comps map
Loading sold comps map…
Walkable amenities ~0.75 mi
Loading nearby amenities…
Taxation est. · year 1
- Rental income
- $21,114
- − Mortgage interest
- −$8,122
- − Property taxes
- −$4,121
- − Insurance
- −$725
- − Repairs & maintenance
- −$1,689
- − Management
- −$1,689
- − Depreciation
- −$4,218
- Taxable income
- $550
- Est. tax owed @ 24.0%
- −$132
- After-tax cash flow
- $2,578/yr
For passive investors: Depreciation is non-cash, so a rental often shows a tax loss while cash-flowing — sheltering income. Rental losses are passive: they offset passive income freely, and up to $25,000/yr can offset ordinary (W-2) income if you actively participate and your MAGI is under $100k (phasing out to $0 by $150k); unused losses carry forward. On sale, claimed depreciation is recaptured at up to 25%, and gains may owe capital-gains tax (a 1031 exchange can defer both). Figures are a year-1 estimate at your 24.0% rate — not tax advice; consult a CPA.
Schools (NCES district)
- District
- Rich Twp Hsd 227
- NCES district ID
- 1733420
- Math proficiency
- 5% ▼ -3.00%
- Reading proficiency
- 12% ▬ 0.00%
- Median HH income
- $56,056
- Composite
- 8.93/100
- National rank
- #9885
- State rank
- #577 of 620 in IL
Livability — Chicago Heights
- Score
- 71/100
- State rank
- #339
- US rank
- #6836
Category grades
Schools grade is shown separately in the Schools card above.
Census & demographics
- Census place
- Chicago Heights, IL
- County
- Cook County · 4,486,803 people
- City population
- 52,175
- Metro
- Chicago-Naperville-Elgin, IL-IN-WI
- Population (ZIP)
- 52,175
- Household income
- $62,073
- Rent vs Own
- Severe rent burden
- 1714.0
Population outlook (Cook County) Hauer SSP2
- Today (2025)
- 5,347,519 people
- By 2030
- 5,357,703 · +0.2%
- By 2040
- 5,324,924 · -0.4%
- By 2050
- 5,230,762 · -2.2%
- By 2075
- 4,785,735 · -10.5%
- By 2100
- 4,188,836 · -21.7%
Race, ethnicity, and origin ACS 2023
- Neighborhood character
- Diverse neighborhood (Simpson 0.66)
- Race & ethnicity
- Black 49% Hispanic / Latino 26% White 19% Two or more races 11%
- Hispanic origin (detail)
- Mexican 22% Puerto Rican 2%
- Common ancestry
- Romanian 4% Portuguese 1% Lithuanian 1%
- Foreign-born
- 12% · Canada
- Languages at home
- 76% English-only · Spanish 21% Russian/Polish/Slavic 1% Other Indo-European 1%
Political lean MEDSL · Cook
- 2024 margin
- Solid D (+42.0) · D 70.4% · R 28.4% · Other 1.2%
- 2008→2024 swing
- -11.4pp toward R · 2008: 53.4pp · 2024: 42.0pp
- All cycles
- 2024: D+42.0 2020: D+50.3 2016: D+53.0 2012: D+49.4 2008: D+53.4
Not yet ingested
- Civics
- —
Market trends
- HPI YoY
- ▼ -108.75%
- Current HPI
- 212.4058
- Rent YoY
- ▲ 6.48%
- Metro
- Chicago-Naperville-Elgin, IL-IN-WI
- State GDP YoY
- ▲ 1.59%
- F500 in state
- 60
Industry mix (Fortune 500 HQ in IL)
| Industry | F500 HQs | Revenue |
|---|---|---|
| Insurance | 4 | $201B |
|
||
| Consumer Goods | 4 | $87B |
|
||
| Industrial Machinery | 3 | $64B |
|
||
| Healthcare | 2 | $55B |
|
||
| Retail / Pharmacy | 1 | $148B |
|
||
| Agriculture / Food | 1 | $86B |
|
||
Price history
+1971.4% since first listed17 events — show timeline
- 2026-05-21 Pending — MRED as Distributed by MLS Grid
- 2026-04-17 Contingent — MRED as Distributed by MLS Grid
- 2026-03-20 Listing Removed — MRED as Distributed by MLS Grid
- 2026-03-20 Listed $145,000 MRED as Distributed by MLS Grid
- 2026-02-03 Listing Removed — MRED as Distributed by MLS Grid
- 2026-02-03 Listed — MRED as Distributed by MLS Grid
- 2025-12-05 Listing Removed — MRED as Distributed by MLS Grid
- 2025-12-04 Price Changed — MRED as Distributed by MLS Grid
- 2025-12-04 Listed — MRED as Distributed by MLS Grid
- 2025-11-07 Listed — MRED as Distributed by MLS Grid
- 2007-07-03 Listing Removed — MRED as Distributed by MLS Grid
- 2007-03-02 Listed — MRED as Distributed by MLS Grid
- 2005-05-26 Sold (Public Records) $48,000 Public Records
- 2001-01-18 Sold (Public Records) $40,000 Public Records
- 1989-02-01 Sold (Public Records) $41,562 Public Records
- 1982-02-10 Sold (Public Records) $29,500 Public Records
- 1981-03-18 Sold (Public Records) $7,000 Public Records
Property tax history
+3.2%/yrLatest (2023): $4,121 · +19.7% YoY. Source: county tax records.
Cash-flow waterfall
monthlySold comps — $/sqft
last 12 mo · ≤1 miLoading sold comps…