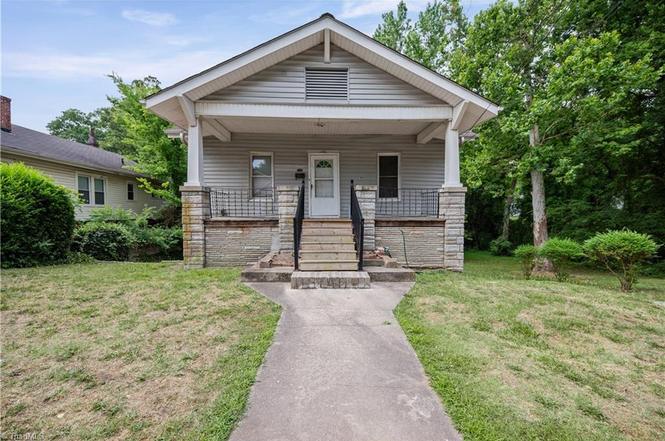
710 Douglas St · Greensboro, NC
Flood risk 6/10 · Moderate
- FEMA flood zone
- X (unshaded)
- Chance of flooding over 30 yrs
- 0.73%
- Est. flood insurance / yr
- $507 – $1,088
Fire risk 1/10 · Minimal
- Est. fire insurance / yr
- $906 – $1,684
Heat risk 5/10 · Moderate
- Hot days now (above 103°F)
- 7 days/yr
- Hot days in 30 yrs
- 16 days/yr
Wind risk 4/10 · Minor
- Chance of severe wind over 30 yrs
- 15.0%
Air-quality risk 2/10 · Minimal
- Unhealthy air days now
- 1 days/yr
- Unhealthy air days in 30 yrs
- 2 days/yr
Risk factors via First Street. Map © Google.
Why this score? — see what drove the B+ grade
The composite is a weighted blend of 9 inputs, each scored 0–100. Each bar is that input's sub-score; the figure is the points it added to the 100-point composite (weight × sub-score).
- Cash flow +30.0/30.0
- ARV discount +15.0/15.0
- 1% rule +10.0/10.0
- DSCR +10.0/10.0
- Livability +4.0/5.0
- Schools +3.6/10.0
- Rent growth +3.0/5.0
- Condition / age +2.5/5.0
- Appreciation +0.0/10.0
$109,900
🖨 Deal sheet (PDF) 📄 Offer letter ✓ Due diligence
Listing remarks
Opportunity awaits at 710 Douglas St. Whether you're an investor, renovator, or a buyer ready to put your personal touch on a home, this property offers plenty of potential to make it your own. This 4 bedroom 2 bath home includes adjacent parcel at 708 Douglas St offering additional land and future potential. Currently vacant and ready for it's next chapter along with replaced water heater (manufactures 2021), and HVAC(replaced appx 2017 for heat only). Conveniently located near downtown Greensboro, shopping, dining, parks, and major transportation routes. Bring your vision and discover the possibilities this property has to offer.
Key facts
- Hvac replacements
- Roof replacements
- Shopping
Tags
Property features AI
Finance
- HOA & community: No homeowners association
Exterior
- Parking: Driveway; Paved parking
- Utilities: Public sewer; Electric water heater; Natural gas heating
- Home design: Residential stick/site-built house; One story; Built in 1915; Living room fireplace
- Construction: Stone and vinyl siding exterior
- Exterior features: Public water source; Public maintained road; Storage structure on property; Lot approximately 0.33 acres; No pool
Interior
- Kitchen: Range; Gas cooktop; Range hood
- Bedrooms: Rooms located on main and lower levels (total rooms listed include living, dining, kitchen and others)
- Flooring: Carpet; Vinyl
- Bathrooms: 2 full bathrooms
- Heating & cooling: Forced air heating (natural gas); Window unit(s) for cooling
- Interior features: Freestanding tub; Pantry; Finished basement; Crawl space
- Laundry & utility: Washer hookup; Dryer connection; Electric water heater
Neighborhood map
What this means for you Summary
Snapshot
- This is a 4-bed/2.0-bath single-family listed at $110k.
Deal economics
- At list price, monthly cash flow is $676 ($8k/yr) — positive.
- The deal already cash-flows at list — no discount required.
- Meets the 1% rule at list price ($2k rent vs $110k).
- Cap rate 13.7% vs local median 3.8% in Greensboro — top-decile yield for the area; either an underpriced asset or a hidden risk that comps aren't pricing in. Stress-test before assuming the spread holds.
Location & tenants
- Location reads 81/100 on livability (#12 in NC, #1,335 nationally) — a professional / high-income tenant draw. Strengths: amenities A+, commute A+, cost of living A+; Watch: employment D, crime F.
- Guilford County Schools (urban): math 39% / reading 45% proficiency, ranked #99 of 178 in NC (top 56%) — families likely to look elsewhere, expect single-tenant / working-renter base with shorter leases.
- Market conditions: Rents rising (+2.2%/yr); 261 active listings in the ZIP; 9 comparable units currently listed for rent nearby; rentals at typical pace (median 20d on market — plan ~3-4 weeks tenant-placement turnaround); 3,843 units permitted in Guilford County in 2024 (2,397 in 5+ unit buildings).
- This rent runs 34% of the median local income ($60k/yr) — at the standard rent-burdened threshold; future hikes will face affordability resistance.
Forward outlook
- Local home prices are declining (-3.0%/yr); year-one equity from $760 of loan paydown is wiped out by about $3k of value loss. Plan a longer hold.
- Guilford County population projected at +26% by 2050 — long-run rental-demand tailwind backs the buy-and-hold thesis.
- At projected returns (-3.0% appreciation + 2.2% rent growth), your $31k cash investment doubles in ~5 years — after that, you're playing with house money.
Negotiation context
- Only 3 days on market — expect competitive offers; lowballing is unlikely to land.
Risks & watch-outs
- Watch-outs: built in 1915 — expect roof / HVAC / electrical / plumbing capex.
- Climate carrying-cost: major flood risk; extreme-heat days projected 7→16/yr by 2055 (HVAC capex compounding) — expect insurance premiums to compound above CPI over the hold.
Questions for the listing agent
- Built in 1915 — when were the roof, HVAC, electrical panel, plumbing, and water heater last replaced?
- Is there a deadline driving the sale (1031 exchange, divorce, estate, relocation)? That informs how much negotiation room exists.
- Crime grade is F in this area — have there been break-ins, vandalism, or insurance claims at this property in the last 3 years? What carrier currently insures it and at what premium?
- What's the average days-on-market for RENTAL listings here right now (not sales)? A rising rental-DOM trend means longer vacancies and softer asking-rent achievability than the comps imply.
- What's the recent tenant-quality profile in this submarket — average credit score on applications, eviction rate, late-payment / NSF rate, and stable-employment percentage? A property-management company in the area should have these aggregated.
- How much new for-sale + rental construction is in the pipeline within 1–3 miles? Heavy new supply typically softens prices + rents 12–24 months out; constrained supply supports both.
Investment metrics
- 1% rule
- 1.55% ✓
- Cap rate
- 13.68%
- Cash-on-cash
- 26.38%
- DSCR
- 2.17
- GRM
- 5.4
CMA / ARV
- ARV (on-the-fly)
- $202,488
- Comps found
- 12
Show comp detail 12 sales within ~0.75 mi
| Address | Dist | Beds/Ba | Sqft | Sold | Price | $/sf | Match |
|---|---|---|---|---|---|---|---|
| 600 Julian St | 0.16mi | 3/2.0 (-1) | 1,445 (-6%) | 3mo | $189,900 | $131 | 76 |
| 907 Caldwell St | 0.38mi | 3/2.5 (-1) | 1,534 (0%) | 10mo | $230,000 | $150 | 66 |
| 524 Julian St | 0.19mi | 3/1.0 (-1) | 1,453 (-5%) | 9mo | $153,262 | $105 | 66 |
| 517 Bragg St | 0.25mi | 4/1.5 | 1,645 (+7%) | 14mo | $120,000 | $73 | 62 |
| 602 Julian St | 0.16mi | 3/2.0 (-1) | 1,305 (-15%) | 2mo | $150,000 | $115 | 61 |
| 1115 Martin St | 0.26mi | 3/3.5 (-1) | 1,409 (-8%) | 7mo | $235,000 | $167 | 58 |
| 1015 E Washington St | 0.60mi | 3/2.0 (-1) | 1,547 (+1%) | 13mo | $250,000 | $162 | 55 |
| 818 Pearson St | 0.21mi | 3/1.0 (-1) | 1,686 (+10%) | 13mo | $175,000 | $104 | 54 |
| 706 Julian St | 0.16mi | 3/1.5 (-1) | 1,316 (-14%) | 11mo | $127,000 | $97 | 52 |
| 807 Logan St | 0.58mi | 3/1.5 (-1) | 1,426 (-7%) | 9mo | $188,000 | $132 | 47 |
| 921 Broad St | 0.45mi | 3/2.5 (-1) | 1,394 (-9%) | 15mo | $240,000 | $172 | 44 |
| 311 Murraylane Rd | 0.40mi | 4/2.5 | 1,760 (+15%) | 14mo | $279,900 | $159 | 43 |
Match score weights: distance 35% · size 25% · config 20% · recency 20%. Top-matched comps best support the ARV.
Projected returns pro-forma
-3.0% appreciation · 2.18% rent growth · sell at horizon
- IRR
- 19.3%
- Equity multiple
- 1.77×
- Total profit
- $23,847
- Equity at exit
- $16,386
- IRR
- 27.0%
- Equity multiple
- 3.29×
- Total profit
- $70,486
- Equity at exit
- $9,502
Cash invested: $30,772 (down + closing). Projections, not guarantees.
Landlord ↔ Tenant lean methodology
- Overall (STATE)
- 85 Strongly Landlord-Friendly
- State North Carolina
- 85 Strongly Landlord-Friendly · R+3
- County
- — inherits STATE
- City
- — inherits STATE
ZIP-level market 27406
- Rents YoY
- 2.2%
- Active inventory
- 261
- Price-to-rent
- 5.4×
Monthly cashflow live
- Estimated rent
- $1,707 high interval (Pro) →
- Mortgage (P&I)
- −$576
- Tax from tax record
- −$50 /mo · $599/yr
- Insurance
- −$46
- HOA
- −$0
- Vacancy / Maint / Mgmt
- −$358
- Net cashflow
- $676
Break-even live
Sensitivity live
| Price | -10% $739 | -5% $708 | +0% $676 | +5% $645 | +10% $614 |
|---|---|---|---|---|---|
| Rent | -10% $542 | -5% $609 | +0% $676 | +5% $744 | +10% $811 |
| Rate | -1.0pp $732 | -0.5pp $704 | base $676 | +0.5pp $648 | +1.0pp $619 |
UW: 25.0% down · 7.5% · 30yr · 1.5% tax · 5.0% vac · 8.0% maint · 8.0% mgmt
Financing live
Cash to close
- Down payment
- $27,475
- Closing costs
- $3,297
- Reserves months
- —
- Total cash needed
- —
Loan-product check · same deal, 3 products live
Conventional
25% down · 7.5% · 30yr
- Down + closing
- —
- Monthly P&I
- —
- Monthly cashflow
- —
- DSCR
- —
- Eligible?
- —
Personal DTI + credit; lowest rate.
DSCR
20% down · 8.5% · 30yr
- Down + closing
- —
- Monthly P&I
- —
- Monthly cashflow
- —
- DSCR
- —
- Eligible?
- —
No personal income docs; deal must DSCR.
Hard money
10% down · 12.0% · 12mo
- Down + closing
- —
- Monthly P&I
- —
- Monthly cashflow
- —
- DSCR
- —
- Eligible?
- —
Short-term bridge; refi at stabilization.
Rent comps 9 comps
| Address | Beds | Baths | Sqft | Rent | $/sqft | DOM | Units | Dist |
|---|---|---|---|---|---|---|---|---|
| 903 Martin St Unit B Greensboro, NC | 3.0 | 1.5 | 2008 | $1,295 | $0.64 | 24d | 1 | 0.06mi |
| 506 Martin St Greensboro, NC | 3.0 | 2.0 | 1296 | $1,500 | $1.16 | 24d | 1 | 0.42mi |
| 904 Stephens St Greensboro, NC | 3.0 | 1.0 | 1052 | $1,490 | $1.42 | 15d | 1 | 0.53mi |
| 1923 Belcrest Dr Greensboro, NC | 4.0 | 1.5 | 1205 | $1,895 | $1.57 | 20d | 1 | 0.94mi |
| 405 N Dudley St Greensboro, NC | 3.0 | 2.0 | 1264 | $2,200 | $1.74 | 15d | 1 | 0.97mi |
| 1500 Willow Rd Greensboro, NC | 3.0 | 1.0 | 1978 | $2,000 | $1.01 | 24d | 1 | 1.12mi |
| 201 Huffman St Greensboro, NC | 3.0 | 2.0 | 1350 | $1,000 | $0.74 | 15d | 1 | 1.28mi |
| 211 Erwin St Greensboro, NC | 3.0 | 1.5 | 1130 | $1,570 | $1.39 | 24d | 1 | 1.36mi |
| 1404 Ardmore Dr Greensboro, NC | 3.0 | 2.0 | 1094 | $1,625 | $1.49 | 15d | 1 | 1.45mi |
Listing history 4 events
-
2026-06-15remarks 639-char remark
-
2026-06-15statusdays on market $109,900 Pending 3 DOM
-
2026-06-14remarks 607-char remark
-
2026-06-14$109,900 Active 2 DOM
ⓘ Source: listings_history table (triggers on properties + properties_extension) + one-shot
backfill from property_details.listing_events for pre-trigger history.
Tax reassessment forecast NC · Resets to sale price
- Current annual tax
- $599 · $50/mo
- Projected year-2 tax
- $901 · $75/mo
- Expected delta
- +$303/yr (+$25/mo · 50.5%)
ⓘ Screening estimate from a state-policy table — verify with the county assessor before closing.
Climate risk First Street
- Flood 6/10 Major FEMA zone X (unshaded) · 73% chance over 30 yrs
- Wildfire 1/10 Low
- Heat 5/10 Major 7 d/yr ≥103°F today · 16 d/yr by 30 yrs out
- Wind 4/10 Moderate 15% chance of damaging wind over 30 yrs
- Air quality 2/10 Low 1 unhealthy d/yr today · 2 by 30 yrs out
Nearby sold comps map
Loading sold comps map…
Walkable amenities ~0.75 mi
Loading nearby amenities…
Taxation est. · year 1
- Rental income
- $20,482
- − Mortgage interest
- −$6,156
- − Property taxes
- −$599
- − Insurance
- −$550
- − Repairs & maintenance
- −$1,639
- − Management
- −$1,639
- − Depreciation
- −$3,197
- Taxable income
- $6,704
- Est. tax owed @ 24.0%
- −$1,609
- After-tax cash flow
- $6,508/yr
For passive investors: Depreciation is non-cash, so a rental often shows a tax loss while cash-flowing — sheltering income. Rental losses are passive: they offset passive income freely, and up to $25,000/yr can offset ordinary (W-2) income if you actively participate and your MAGI is under $100k (phasing out to $0 by $150k); unused losses carry forward. On sale, claimed depreciation is recaptured at up to 25%, and gains may owe capital-gains tax (a 1031 exchange can defer both). Figures are a year-1 estimate at your 24.0% rate — not tax advice; consult a CPA.
Schools (NCES district)
- District
- Guilford County Schools
- NCES district ID
- 3701920
- Math proficiency
- 39% ▲ 1.00%
- Reading proficiency
- 45% ▲ 1.00%
- Median HH income
- $46,315
- Composite
- 35.78/100
- National rank
- #4842
- State rank
- #99 of 178 in NC
Livability — Greensboro
- Score
- 81/100
- State rank
- #12
- US rank
- #1335
Category grades
Schools grade is shown separately in the Schools card above.
Census & demographics
- Census place
- Greensboro, NC
- County
- Guilford County · 487,190 people
- City population
- 329,421
- Metro
- Greensboro-High Point, NC
- Population (ZIP)
- 60,651
- Household income
- $59,563
- Rent vs Own
- Severe rent burden
- 2462.0
Population outlook (Guilford County) Hauer SSP2
- Today (2025)
- 584,596 people
- By 2030
- 616,851 · +5.5%
- By 2040
- 678,451 · +16.1%
- By 2050
- 734,788 · +25.7%
- By 2075
- 862,985 · +47.6%
- By 2100
- 948,704 · +62.3%
Race, ethnicity, and origin ACS 2023
- Neighborhood character
- Diverse neighborhood (Simpson 0.64)
- Race & ethnicity
- Black 52% White 26% Hispanic / Latino 13% Two or more races 10% Asian 2%
- Hispanic origin (detail)
- Mexican 7% Puerto Rican 2%
- Common ancestry
- Italian 1% Serbian 1% Lithuanian 1%
- Foreign-born
- 10% · Canada, Vietnam, United Kingdom
- Languages at home
- 83% English-only · Spanish 11% Vietnamese 1% Other Asian/Pacific 1%
Political lean MEDSL · Guilford
- 2024 margin
- Strong D (+21.8) · D 60.2% · R 38.4% · Other 1.4%
- 2008→2024 swing
- +3.5pp toward D · 2008: 18.4pp · 2024: 21.8pp
- All cycles
- 2024: D+21.8 2020: D+23.1 2016: D+20.0 2012: D+16.5 2008: D+18.4
Not yet ingested
- Civics
- —
Market trends
- HPI YoY
- ▼ -146.70%
- Current HPI
- 243.2612
- Rent YoY
- ▲ 2.18%
- Metro
- Greensboro-High Point, NC
- State GDP YoY
- ▲ 3.28%
- F500 in state
- 26
Industry mix (Fortune 500 HQ in NC)
| Industry | F500 HQs | Revenue |
|---|---|---|
| Financial Services | 2 | $213B |
|
||
| Retail | 2 | $95B |
|
||
| Industrial Conglomerate | 1 | $38B |
|
||
| Metals / Steel | 1 | $35B |
|
||
| Utilities | 1 | $30B |
|
||
| Industrial Machinery | 1 | $19B |
|
||
Price history
1 event — show timeline
- 2026-06-11 Listed $109,900 Triad MLS
Property tax history
-0.8%/yrLatest (2025): $599 · -1.0% YoY. Source: county tax records.
Cash-flow waterfall
monthlySold comps — $/sqft
last 12 mo · ≤1 miLoading sold comps…