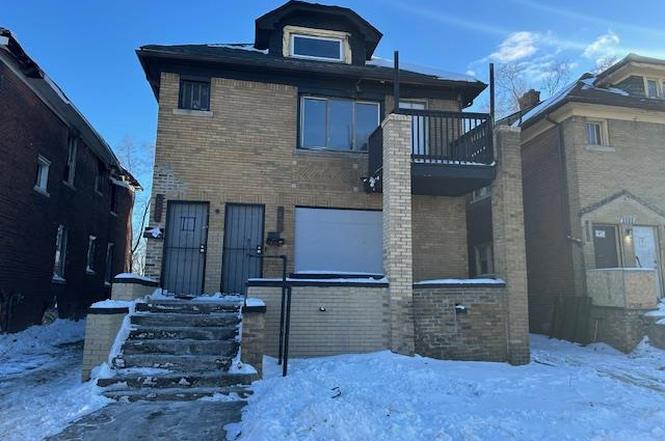
4249 Elmhurst St · Detroit, MI
Flood risk 5/10 · Moderate
- FEMA flood zone
- X (unshaded)
- Chance of flooding over 30 yrs
- 0.67%
- Est. flood insurance / yr
- $473 – $860
Fire risk 1/10 · Minimal
- Est. fire insurance / yr
- $784 – $1,456
Heat risk 3/10 · Minor
- Hot days now (above 97°F)
- 7 days/yr
- Hot days in 30 yrs
- 15 days/yr
Wind risk 2/10 · Minimal
- Chance of severe wind over 30 yrs
- —
Air-quality risk 4/10 · Minor
- Unhealthy air days now
- 4 days/yr
- Unhealthy air days in 30 yrs
- 6 days/yr
Risk factors via First Street. Map © Google.
Why this score? — see what drove the B+ grade
The composite is a weighted blend of 9 inputs, each scored 0–100. Each bar is that input's sub-score; the figure is the points it added to the 100-point composite (weight × sub-score).
- Cash flow +30.0/30.0
- 1% rule +10.0/10.0
- DSCR +10.0/10.0
- Appreciation +10.0/10.0
- ARV discount +7.5/15.0
- Livability +3.7/5.0
- Rent growth +2.5/5.0
- Condition / age +2.5/5.0
- Schools +1.3/10.0
$34,900
🖨 Deal sheet 📄 Offer letter ✓ Due diligence
Listing remarks MLS
Opportunity knocks at 4249 Elmhurst in Detroit! This bank-owned multi-family property is ready for a full transformation and offers tremendous upside for the savvy investor or experienced rehabber. Located in an established neighborhood with strong rental demand, this property is the perfect value-add project. With solid bones and generous layout, it presents the chance to renovate, reposition, and significantly increase cash flow potential. Whether you're looking to add to your rental portfolio, complete a fix-and-flip, or create long-term passive income, this is the kind of opportunity that doesn't last. Bring your vision, your contractor, and your creativity - the upside is there for those ready to unlock it.
Key facts
- Strong rental demand
- Solid bones
- Value-add project
Tags
Neighborhood map
What this means for you Summary
Snapshot
- This is a 3-bed/2.0-bath townhouse listed at $35k.
Deal economics
- At list price, monthly cash flow is $835 ($10k/yr) — positive.
- The deal already cash-flows at list — no discount required.
- Meets the 1% rule at list price ($1k rent vs $35k).
- Recommended offer: $33k (6.0% below list) — sets the bar for market timing.
- Cap rate 35.0% vs local median 10.2% in Detroit — top-decile yield for the area; either an underpriced asset or a hidden risk that comps aren't pricing in. Stress-test before assuming the spread holds.
Location & tenants
- Location reads 73/100 on livability (#218 in MI) — a middle-class / working-renter tenant base. Strengths: amenities A+, commute A+, cost of living A+; Watch: schools F, crime F, employment F.
- Detroit Public Schools Community District (urban): math 10% / reading 24% proficiency, ranked #499 of 540 in MI (top 92%) — low school quality limits family demand, transient renter base, plan for 1-2y turnover; 90% free/reduced lunch — lower-income household profile, screen leases tightly.
- Market conditions: 244 active listings in the ZIP; 24 comparable units currently listed for rent nearby; rentals at typical pace (median 17d on market — plan ~3-4 weeks tenant-placement turnaround); lower-income renter base — watch delinquency; 2,639 units permitted in Wayne County in 2024 (1,216 in 5+ unit buildings).
- At $1,452/mo this rent would consume 51% of the median local household income ($34k/yr) (locally 1418% of renters already pay >50% of income on rent) — very limited rent-growth headroom before tenants either downsize or default.
Forward outlook
- In year one you build about $4k of equity ($241 loan paydown + $3k appreciation (10.0% local appreciation)).
- Wayne County population projected at -17% by 2050 — secular population decline; favor cash flow + early exit over multi-decade hold.
- At projected returns (10.0% appreciation + 3.0% rent growth), your $10k cash investment doubles in ~1 year — after that, you're playing with house money.
- By year 8, paydown + projected appreciation supports a ~$32k cash-out refi (75% LTV) — recoverable capital for the next deal without selling this one.
Negotiation context
- It's been on market 67 days — a 6% lower offer ($33k) is reasonable based on typical stale-listing flexibility.
- 9 sale attempts since 3y ago; this cycle's ask has dropped $10k (22%) from the opening price — seller is motivated, your offer sets the floor, not the list.
Risks & watch-outs
- Watch-outs: property tax is 3.9% of price; built in 1925 — expect roof / HVAC / electrical / plumbing capex.
- Climate carrying-cost: moderate flood risk — expect insurance premiums to compound above CPI over the hold.
Questions for the listing agent
- It's been on market 67 days. Have you received any prior offers? Is the seller open to a 6% concession, seller financing, or rate buy-down credit?
- Built in 1925 — when were the roof, HVAC, electrical panel, plumbing, and water heater last replaced?
- Property tax is high relative to price — has the assessment been appealed recently, and will the sale trigger a re-assessment?
- Why hasn't it sold? Are there any deal-killer items the seller is aware of (foundation, flood, title, zoning, code violations)?
- Is there a deadline driving the sale (1031 exchange, divorce, estate, relocation)? That informs how much negotiation room exists.
- Schools are F-rated, which usually means shorter tenancies and higher turnover. Who's the typical renter profile here, and what's been the actual vacancy rate?
- Crime grade is F in this area — have there been break-ins, vandalism, or insurance claims at this property in the last 3 years? What carrier currently insures it and at what premium?
- What's the average days-on-market for RENTAL listings here right now (not sales)? A rising rental-DOM trend means longer vacancies and softer asking-rent achievability than the comps imply.
- What's the recent tenant-quality profile in this submarket — average credit score on applications, eviction rate, late-payment / NSF rate, and stable-employment percentage? A property-management company in the area should have these aggregated.
- How much new for-sale + rental construction is in the pipeline within 1–3 miles? Heavy new supply typically softens prices + rents 12–24 months out; constrained supply supports both.
Investment metrics
- 1% rule
- 4.16% ✓
- Cap rate
- 35.01%
- Cash-on-cash
- 102.56%
- DSCR
- 5.56
- GRM
- 2.0
CMA / ARV
No comps found within radius.
Projected returns pro-forma
10.0% appreciation · 3.0% rent growth · sell at horizon
- IRR
- —
- Equity multiple
- 8.40×
- Total profit
- $72,265
- Equity at exit
- $31,441
- IRR
- —
- Equity multiple
- 18.51×
- Total profit
- $171,109
- Equity at exit
- $67,803
Cash invested: $9,772 (down + closing). Projections, not guarantees.
Landlord ↔ Tenant lean methodology
- Overall (STATE)
- 62 Landlord-Friendly
- State Michigan
- 62 Landlord-Friendly · EVEN
- County
- — inherits STATE
- City
- — inherits STATE
ZIP-level market 48204
- Home prices YoY
- 18.5%
- Active inventory
- 244
- Price-to-rent
- 2.0×
Monthly cashflow live
- Estimated rent
- $1,452 high interval (Pro) →
- Mortgage (P&I)
- −$183
- Tax from tax record
- −$114 /mo · $1,372/yr
- Insurance
- −$15
- HOA
- −$0
- Vacancy / Maint / Mgmt
- −$305
- Net cashflow
- $835
Break-even live
UW: 25.0% down · 7.5% · 30yr · 1.5% tax · 5.0% vac · 8.0% maint · 8.0% mgmt
Financing live
Cash to close
- Down payment
- $8,725
- Closing costs
- $1,047
- Reserves months
- —
- Total cash needed
- —
Loan-product check · same deal, 3 products live
Conventional
25% down · 7.5% · 30yr
- Down + closing
- —
- Monthly P&I
- —
- Monthly cashflow
- —
- DSCR
- —
- Eligible?
- —
Personal DTI + credit; lowest rate.
DSCR
20% down · 8.5% · 30yr
- Down + closing
- —
- Monthly P&I
- —
- Monthly cashflow
- —
- DSCR
- —
- Eligible?
- —
No personal income docs; deal must DSCR.
Hard money
10% down · 12.0% · 12mo
- Down + closing
- —
- Monthly P&I
- —
- Monthly cashflow
- —
- DSCR
- —
- Eligible?
- —
Short-term bridge; refi at stabilization.
Rent comps 24 comps
| Address | Beds | Baths | Sqft | Rent | $/sqft | DOM | Units | Dist |
|---|---|---|---|---|---|---|---|---|
| 12546 Broadstreet Ave Detroit, MI | 3.0 | 1.5 | 1899 | $1,250 | $0.66 | 44d | 1 | 0.35mi |
| 3322 Webb St Detroit, MI | 3.0 | 1.0 | 1600 | $1,250 | $0.78 | 16d | 1 | 0.38mi |
| 3322 Webb St Unit 2 Detroit, MI | 3.0 | 1.0 | 1656 | $1,350 | $0.82 | 43d | 1 | 0.38mi |
| 3322 Webb St Unit 1 Detroit, MI | 3.0 | 1.0 | 1656 | $1,350 | $0.82 | 43d | 1 | 0.38mi |
| 4341 Glendale St Detroit, MI | 4.0 | 2.5 | 1832 | $1,680 | $0.92 | 5d | 1 | 0.46mi |
| 3241 Lawrence St Detroit, MI | 4.0 | 2.0 | 2636 | $1,800 | $0.68 | 16d | 1 | 0.51mi |
| 3031 Lawrence St Detroit, MI | 4.0 | 1.0 | 1700 | $1,600 | $0.94 | 16d | 1 | 0.57mi |
| 2986 Richton St Detroit, MI | 3.0 | 1.0 | 2600 | $1,200 | $0.46 | 16d | 1 | 0.58mi |
| 12123 Santa Rosa Dr Detroit, MI | 2.0 | 1.0 | 1680 | $1,000 | $0.60 | 24d | 1 | 0.60mi |
| 4046 Tyler St Detroit, MI | 2.0 | 1.0 | 2378 | $1,050 | $0.44 | 12d | 1 | 0.60mi |
| 3747 Tyler St Detroit, MI | 3.0 | 1.0 | 2600 | $1,700 | $0.65 | 24d | 1 | 0.62mi |
| 2925 Calvert St Detroit, MI | 3.0 | 1.0 | 1400 | $1,300 | $0.93 | 16d | 1 | 0.72mi |
| 2655 Collingwood St Detroit, MI | 4.0 | 1.5 | 1881 | $2,700 | $1.44 | 1d | 1 | 0.81mi |
| 3209 W Grand St Detroit, MI | 3.0 | 1.0 | 1550 | $1,103 | $0.71 | 43d | 1 | 0.92mi |
| 2474 Fullerton St Detroit, MI | 3.0 | 1.0 | 1400 | $1,300 | $0.93 | 15d | 1 | 0.99mi |
| 3786 Carter St Unit 2 Detroit, MI | 3.0 | 1.0 | 1400 | $1,100 | $0.79 | 24d | 1 | 1.10mi |
| 12303 Cloverlawn St Detroit, MI | 3.0 | 1.5 | 1454 | $1,400 | $0.96 | 43d | 1 | 1.12mi |
| 2045 Calvert St Detroit, MI | 2.0 | 2.0 | 1400 | $1,600 | $1.14 | 43d | 1 | 1.23mi |
| 8951 La Salle Blvd Unit NA Detroit, MI | 4.0 | 2.5 | 2440 | $2,500 | $1.02 | 10d | 1 | 1.33mi |
| 8951 La Salle Blvd Detroit, MI | 4.0 | 2.5 | 2440 | $2,500 | $1.02 | 1d | 1 | 1.33mi |
| 1929 Calvert Ave Unit 2 Detroit, MI | 3.0 | 1.0 | 1414 | $1,199 | $0.85 | 15d | 1 | 1.33mi |
| 2509 Gladstone St Unit 1 Detroit, MI | 3.0 | 2.0 | 3000 | $2,650 | $0.88 | 1d | 1 | 1.36mi |
| 2302 Hazelwood St Unit 1 Detroit, MI | 3.0 | 1.0 | 1550 | $1,273 | $0.82 | 24d | 1 | 1.40mi |
| 5315 Spokane St Detroit, MI | 3.0 | 1.0 | 2110 | $1,200 | $0.57 | 16d | 1 | 1.47mi |
Listing history 28 events
-
2026-04-20status Pending 723-char remark
Show marketing remark (723 chars)
Opportunity knocks at 4249 Elmhurst in Detroit! This bank-owned multi-family property is ready for a full transformation and offers tremendous upside for the savvy investor or experienced rehabber. Located in an established neighborhood with strong rental demand, this property is the perfect value-add project. With solid bones and generous layout, it presents the chance to renovate, reposition, and significantly increase cash flow potential. Whether you're looking to add to your rental portfolio, complete a fix-and-flip, or create long-term passive income, this is the kind of opportunity that doesn't last. Bring your vision, your contractor, and your creativity - the upside is there for those ready to unlock it.
-
2026-04-20status Pending
Show marketing remark (723 chars)
Opportunity knocks at 4249 Elmhurst in Detroit! This bank-owned multi-family property is ready for a full transformation and offers tremendous upside for the savvy investor or experienced rehabber. Located in an established neighborhood with strong rental demand, this property is the perfect value-add project. With solid bones and generous layout, it presents the chance to renovate, reposition, and significantly increase cash flow potential. Whether you're looking to add to your rental portfolio, complete a fix-and-flip, or create long-term passive income, this is the kind of opportunity that doesn't last. Bring your vision, your contractor, and your creativity - the upside is there for those ready to unlock it.
-
2026-03-18price $34,900 723-char remark
Show marketing remark (723 chars)
Opportunity knocks at 4249 Elmhurst in Detroit! This bank-owned multi-family property is ready for a full transformation and offers tremendous upside for the savvy investor or experienced rehabber. Located in an established neighborhood with strong rental demand, this property is the perfect value-add project. With solid bones and generous layout, it presents the chance to renovate, reposition, and significantly increase cash flow potential. Whether you're looking to add to your rental portfolio, complete a fix-and-flip, or create long-term passive income, this is the kind of opportunity that doesn't last. Bring your vision, your contractor, and your creativity - the upside is there for those ready to unlock it.
-
2026-03-17price $34,900
-
2026-02-12$44,900 Active 723-char remark
Show marketing remark (723 chars)
Opportunity knocks at 4249 Elmhurst in Detroit! This bank-owned multi-family property is ready for a full transformation and offers tremendous upside for the savvy investor or experienced rehabber. Located in an established neighborhood with strong rental demand, this property is the perfect value-add project. With solid bones and generous layout, it presents the chance to renovate, reposition, and significantly increase cash flow potential. Whether you're looking to add to your rental portfolio, complete a fix-and-flip, or create long-term passive income, this is the kind of opportunity that doesn't last. Bring your vision, your contractor, and your creativity - the upside is there for those ready to unlock it.
-
2026-02-12$44,900 Active
Show marketing remark (723 chars)
Opportunity knocks at 4249 Elmhurst in Detroit! This bank-owned multi-family property is ready for a full transformation and offers tremendous upside for the savvy investor or experienced rehabber. Located in an established neighborhood with strong rental demand, this property is the perfect value-add project. With solid bones and generous layout, it presents the chance to renovate, reposition, and significantly increase cash flow potential. Whether you're looking to add to your rental portfolio, complete a fix-and-flip, or create long-term passive income, this is the kind of opportunity that doesn't last. Bring your vision, your contractor, and your creativity - the upside is there for those ready to unlock it.
-
2025-08-16status Pending
-
2025-08-16status Pending
-
2025-08-16historical
-
2025-08-16historical
-
2025-08-01$49,000 Active
-
2025-08-01$49,000 Active
-
2024-12-17historical
-
2024-12-16historical
-
2024-08-30price $125,000
-
2024-08-29price $125,000
-
2024-08-29price $125,000
-
2024-08-15historical $800
-
2024-07-19$800
-
2024-06-07historical $800
-
2024-06-06price $800
-
2024-05-16$132,000 Active
-
2024-05-16$132,000 Active
-
2024-05-09$900
-
2024-01-20historical $900
-
2023-12-13price $900
-
2023-12-01$1,100
-
2023-10-19soldstatus $108,000
ⓘ Source: listings_history table (triggers on properties + properties_extension) + one-shot
backfill from property_details.listing_events for pre-trigger history.
Tax reassessment forecast MI · Partial reset (capped growth)
- Current annual tax
- $1,372 · $114/mo
- Projected year-2 tax
- $1,372 · $114/mo
- Expected delta
- $0/yr ($0/mo · 0.0%)
ⓘ Screening estimate from a state-policy table — verify with the county assessor before closing.
Climate risk First Street
- Flood 5/10 Major FEMA zone X (unshaded) · 67% chance over 30 yrs
- Wildfire 1/10 Low
- Heat 3/10 Moderate 7 d/yr ≥97°F today · 15 d/yr by 30 yrs out
- Wind 2/10 Low
- Air quality 4/10 Moderate 4 unhealthy d/yr today · 6 by 30 yrs out
Nearby sold comps map
Loading sold comps map…
Walkable amenities ~0.75 mi
Loading nearby amenities…
Taxation est. · year 1
- Rental income
- $17,424
- − Mortgage interest
- −$1,955
- − Property taxes
- −$1,372
- − Insurance
- −$174
- − Repairs & maintenance
- −$1,394
- − Management
- −$1,394
- − Depreciation
- −$1,015
- Taxable income
- $10,119
- Est. tax owed @ 24.0%
- −$2,429
- After-tax cash flow
- $7,593/yr
For passive investors: Depreciation is non-cash, so a rental often shows a tax loss while cash-flowing — sheltering income. Rental losses are passive: they offset passive income freely, and up to $25,000/yr can offset ordinary (W-2) income if you actively participate and your MAGI is under $100k (phasing out to $0 by $150k); unused losses carry forward. On sale, claimed depreciation is recaptured at up to 25%, and gains may owe capital-gains tax (a 1031 exchange can defer both). Figures are a year-1 estimate at your 24.0% rate — not tax advice; consult a CPA.
Schools (NCES district)
- District
- Detroit Public Schools Community District
- NCES district ID
- 2601103
- Math proficiency
- 10% ▼ -2.00%
- Reading proficiency
- 24% ▲ 6.00%
- Median HH income
- $25,815
- Composite
- 13.06/100
- National rank
- #9564
- State rank
- #499 of 540 in MI
Livability — Detroit
- Score
- 73/100
- State rank
- #218
- US rank
- #5427
Category grades
Schools grade is shown separately in the Schools card above.
Census & demographics
- Census place
- Detroit, MI
- County
- Wayne County · 1,562,939 people
- City population
- 572,865
- Metro
- Detroit-Warren-Dearborn, MI
- Population (ZIP)
- 20,696
- Household income
- $34,468
- Rent vs Own
- Severe rent burden
- 1418.0
Population outlook (Wayne County) Hauer SSP2
- Today (2025)
- 1,675,273 people
- By 2030
- 1,620,300 · -3.3%
- By 2040
- 1,502,341 · -10.3%
- By 2050
- 1,384,039 · -17.4%
- By 2075
- 1,124,592 · -32.9%
- By 2100
- 881,193 · -47.4%
Race, ethnicity, and origin ACS 2023
- Neighborhood character
- Predominantly Black (86%)
- Race & ethnicity
- Black 86% Two or more races 7% Hispanic / Latino 5% White 4% Native American 2%
- Hispanic origin (detail)
- Mexican 4%
- Common ancestry
- Hispanic 1% Romanian 1%
- Foreign-born
- 2% · Canada
- Languages at home
- 95% English-only · Spanish 4%
Political lean MEDSL · Wayne
- 2024 margin
- Strong D (+29.0) · D 62.7% · R 33.7% · Other 3.6%
- 2008→2024 swing
- -20.5pp toward R · 2008: 49.5pp · 2024: 29.0pp
- All cycles
- 2024: D+29.0 2020: D+38.1 2016: D+37.3 2012: D+46.9 2008: D+49.5
Not yet ingested
- Civics
- —
Market trends
- HPI YoY
- ▲ 36.51%
- Current HPI
- 234.0465
- Rent YoY
- —
- Metro
- Detroit-Warren-Dearborn, MI
- State GDP YoY
- ▲ 1.37%
- F500 in state
- 28
Industry mix (Fortune 500 HQ in MI)
| Industry | F500 HQs | Revenue |
|---|---|---|
| Automotive Parts | 3 | $48B |
|
||
| Automotive | 2 | $372B |
|
||
| Chemicals | 1 | $45B |
|
||
| Automotive Retail | 1 | $29B |
|
||
| Healthcare / Medical Devices | 1 | $23B |
|
||
| Automotive Technology | 1 | $20B |
|
||
Price history
-67.7% since first listed28 events — show timeline
- 2026-04-20 Pending — MiRealSource-MiMLS
- 2026-04-20 Pending — REALCOMP
- 2026-03-18 Price Changed $34,900 MiRealSource-MiMLS
- 2026-03-17 Price Changed $34,900 REALCOMP
- 2026-02-12 Listed $44,900 REALCOMP
- 2026-02-12 Listed $44,900 MiRealSource-MiMLS
- 2025-08-16 Pending — MiRealSource-MiMLS
- 2025-08-16 Pending — REALCOMP
- 2025-08-16 Listing Removed — REALCOMP
- 2025-08-16 Listing Removed — MiRealSource-MiMLS
- 2025-08-01 Listed $49,000 REALCOMP
- 2025-08-01 Listed $49,000 MiRealSource-MiMLS
- 2024-12-17 Listing Removed — MiRealSource-MiMLS
- 2024-12-16 Listing Removed — REALCOMP
- 2024-08-30 Price Changed $125,000 MiRealSource-MiMLS
- 2024-08-29 Price Changed $125,000 REALCOMP
- 2024-08-29 Price Changed $125,000 SW Michigan MLS
- 2024-08-15 Rental Removed $800 APPFOLIO
- 2024-07-19 Listed for Rent $800 APPFOLIO
- 2024-06-07 Rental Removed $800 APPFOLIO
- 2024-06-06 Price Changed $800 APPFOLIO
- 2024-05-16 Listed $132,000 MiRealSource-MiMLS
- 2024-05-16 Listed $132,000 REALCOMP
- 2024-05-09 Listed for Rent $900 APPFOLIO
- 2024-01-20 Rental Removed $900 APPFOLIO
- 2023-12-13 Price Changed $900 APPFOLIO
- 2023-12-01 Listed for Rent $1,100 APPFOLIO
- 2023-10-19 Sold (Public Records) $108,000 Public Records
Property tax history
+3.1%/yrLatest (2025): $1,372 · -34.0% YoY. Source: county tax records.
Cash-flow waterfall
monthlySold comps — $/sqft
last 12 mo · ≤1 miLoading sold comps…