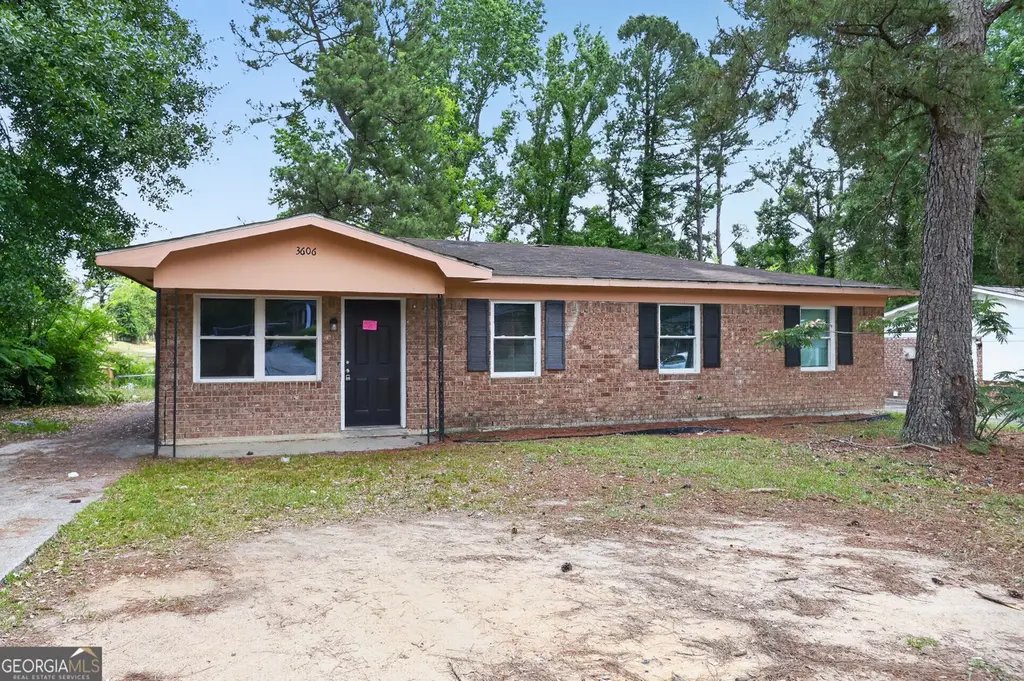
3606 Alene Cir · Augusta-Richmond County consolidated government (balance), GA
Flood risk 1/10 · Minimal
- FEMA flood zone
- X (unshaded)
- Chance of flooding over 30 yrs
- 0.0%
- Est. flood insurance / yr
- $507 – $1,088
Fire risk 4/10 · Minor
- Est. fire insurance / yr
- $963 – $1,789
Heat risk 7/10 · Major
- Hot days now (above 106°F)
- 7 days/yr
- Hot days in 30 yrs
- 17 days/yr
Wind risk 6/10 · Moderate
- Chance of severe wind over 30 yrs
- 66.0%
Air-quality risk 3/10 · Minor
- Unhealthy air days now
- 3 days/yr
- Unhealthy air days in 30 yrs
- 3 days/yr
Risk factors via First Street. Map © Google.
Why this score? — see what drove the B grade
The composite is a weighted blend of 9 inputs, each scored 0–100. Each bar is that input's sub-score; the figure is the points it added to the 100-point composite (weight × sub-score).
- Cash flow +30.0/30.0
- ARV discount +15.0/15.0
- 1% rule +10.0/10.0
- DSCR +10.0/10.0
- Livability +2.5/5.0
- Condition / age +2.5/5.0
- Rent growth +2.4/5.0
- Schools +1.3/10.0
- Appreciation +0.0/10.0
$104,900
🖨 Deal sheet 📄 Offer letter ✓ Due diligence
Listing remarks
Welcome to this beautifully updated brick ranch nestled in Augusta's established Meadowbrook neighborhood. This charming 4-bedroom, 1.5-bath home offers 1,260 square feet of comfortable living space on a spacious 0.26-acre lot, blending classic character with modern convenience. Inside, you'll find inviting living areas filled with natural light and a generously sized kitchen designed for both everyday living and entertaining. The functional layout provides flexibility for families, guests, or a home office setup. Step outside to enjoy the large yard with plenty of room for outdoor gatherings, gardening, or relaxing evenings at home. Conveniently located just minutes from Augusta Mall, loca
Key facts
- Updated brick ranch
- Large yard
- Spacious lot
Tags
Property features AI
Finance
- Other: Lot approximately 0.26 acres
- HOA & community: No homeowners association; No association fees
Exterior
- Parking: Open parking; Parking pad
- Utilities: Public water; Public sewer; Other utilities
- Home design: Single-family house; One story; Resale property
- Construction: Brick construction; Composition roof; Built in 1970; No basement
- Exterior features: Level lot
Interior
- Kitchen: Refrigerator
- Bedrooms: 4 bedrooms on the main level
- Flooring: Other flooring
- Bathrooms: 2 full bathrooms on the main level
- Heating & cooling: Central heating; Central air conditioning
- Interior features: Other interior features
- Laundry & utility: Other laundry features
Neighborhood map
What this means for you Summary
Snapshot
- This is a 4-bed/2.0-bath single-family listed at $105k.
Deal economics
- At list price, monthly cash flow is $517 ($6k/yr) — positive.
- The deal already cash-flows at list — no discount required.
- Meets the 1% rule at list price ($2k rent vs $105k).
- Recommended offer: $103k (1.5% below list) — sets the bar for market timing.
- Cap rate 12.2% vs local median 5.3% in Augusta-Richmond County consolidated government (balance) — top-decile yield for the area; either an underpriced asset or a hidden risk that comps aren't pricing in. Stress-test before assuming the spread holds.
Location & tenants
- Location reads: area grade B — affects rentability + tenant quality, not the cash-flow math above.
- Richmond County (urban): math 12% / reading 20% proficiency, ranked #154 of 174 in GA (top 88%) — low school quality limits family demand, transient renter base, plan for 1-2y turnover; 72% free/reduced lunch — lower-income household profile, screen leases tightly.
- Zoned schools: Meadowbrook Elementary School (math 12% / reading 12%, grade F, #1,041 of 1,228 statewide, top 87%, 497 students, 98% FRL); Glenn Hills Middle School (math 2% / reading 6%, grade F, #467 of 470 statewide, top 99%, 762 students, 98% FRL); Glenn Hills High School (math 2% / reading 2%, grade F, #421 of 424 statewide, top 100%, 883 students, 98% FRL) — zoned schools average 98% FRL vs 72% district-wide (26 pts higher); higher-poverty schools than district average — tighter screening recommended.
- Market conditions: Rents soft (-0.2%/yr); 364 active listings in the ZIP; 25 comparable units currently listed for rent nearby; rentals at typical pace (median 24d on market — plan ~3-4 weeks tenant-placement turnaround); 44% of comp listings sitting > 30 days — soft ceiling on asking rent; 561 units permitted in Richmond County in 2024 (0 in 5+ unit buildings).
- This rent runs 41% of the median local income ($46k/yr) — at the standard rent-burdened threshold; future hikes will face affordability resistance.
Forward outlook
- Local home prices are declining (-3.0%/yr); year-one equity from $725 of loan paydown is wiped out by about $3k of value loss. Plan a longer hold.
- Richmond County population projected to shrink 5% by 2050 — rents likely to lag national; underwrite the cash flow, not the appreciation.
- At projected returns (-3.0% appreciation + 0.0% rent growth), your $29k cash investment doubles in ~8 years — after that, you're playing with house money.
Negotiation context
- It's been on market 15 days — a 2% lower offer ($103k) is reasonable based on typical stale-listing flexibility.
Risks & watch-outs
- Climate carrying-cost: major wind risk, 66% chance of damaging wind over 30y; extreme-heat days projected 7→17/yr by 2055 (HVAC capex compounding) — expect insurance premiums to compound above CPI over the hold.
Questions for the listing agent
- Built in 1970 — when were the roof, HVAC, electrical panel, plumbing, and water heater last replaced?
- Is there a deadline driving the sale (1031 exchange, divorce, estate, relocation)? That informs how much negotiation room exists.
- What's the average days-on-market for RENTAL listings here right now (not sales)? A rising rental-DOM trend means longer vacancies and softer asking-rent achievability than the comps imply.
- What's the recent tenant-quality profile in this submarket — average credit score on applications, eviction rate, late-payment / NSF rate, and stable-employment percentage? A property-management company in the area should have these aggregated.
- How much new for-sale + rental construction is in the pipeline within 1–3 miles? Heavy new supply typically softens prices + rents 12–24 months out; constrained supply supports both.
Investment metrics
- 1% rule
- 1.51% ✓
- Cap rate
- 12.21%
- Cash-on-cash
- 21.12%
- DSCR
- 1.94
- GRM
- 5.5
CMA / ARV
- ARV (on-the-fly)
- $152,460
- Comps found
- 12
Show comp detail 12 sales within ~0.75 mi
| Address | Dist | Beds/Ba | Sqft | Sold | Price | $/sf | Match |
|---|---|---|---|---|---|---|---|
| 3625 Meadowgrove Dr | 0.04mi | 3/1.5 (-1) | 1,260 (0%) | 3mo | $68,000 | $54 | 89 |
| 3531 Spring Glen Ln | 0.21mi | 3/2.0 (-1) | 1,286 (+2%) | 2mo | $165,000 | $128 | 80 |
| 2942 Dahlia Dr | 0.16mi | 4/2.0 | 1,392 (+10%) | 6mo | $174,000 | $125 | 70 |
| 3042 Johnny Ct | 0.25mi | 3/1.5 (-1) | 1,344 (+7%) | 3mo | $165,000 | $123 | 68 |
| 2940 Dahlia Dr | 0.17mi | 3/2.0 (-1) | 1,431 (+14%) | 2mo | $170,000 | $119 | 63 |
| 3526 Spring Glen Ln | 0.23mi | 4/2.0 | 1,444 (+15%) | 3mo | $175,000 | $121 | 63 |
| 3425 Knollcrest Rd | 0.60mi | 3/2.0 (-1) | 1,232 (-2%) | 2mo | $173,000 | $140 | 61 |
| 2912 Butler Manor Dr | 0.63mi | 3/1.5 (-1) | 1,274 (+1%) | 5mo | $80,000 | $63 | 58 |
| 2816 Leawood Court Ct | 0.43mi | 3/2.0 (-1) | 1,377 (+9%) | 5mo | $195,000 | $142 | 55 |
| 3426 S Kensington Dr | 0.72mi | 3/1.5 (-1) | 1,326 (+5%) | 2mo | $89,000 | $67 | 49 |
| 3004 Green Forest Dr | 0.75mi | 3/1.5 (-1) | 1,112 (-12%) | 0mo | $112,000 | $101 | 38 |
| 2914 Butler Manor Dr | 0.65mi | 3/1.5 (-1) | 1,100 (-13%) | 6mo | $100,000 | $91 | 36 |
Match score weights: distance 35% · size 25% · config 20% · recency 20%. Top-matched comps best support the ARV.
Projected returns pro-forma
-3.0% appreciation · 0.0% rent growth · sell at horizon
- IRR
- 10.1%
- Equity multiple
- 1.38×
- Total profit
- $11,305
- Equity at exit
- $15,641
- IRR
- 16.6%
- Equity multiple
- 2.17×
- Total profit
- $34,385
- Equity at exit
- $9,070
Cash invested: $29,372 (down + closing). Projections, not guarantees.
Landlord ↔ Tenant lean methodology
- Overall (STATE)
- 90 Strongly Landlord-Friendly
- State Georgia
- 90 Strongly Landlord-Friendly · R+3
- County
- — inherits STATE
- City
- — inherits STATE
ZIP-level market 30906
- Home prices YoY
- -21.6%
- Rents YoY
- -0.2%
- Active inventory
- 364
- Price-to-rent
- 5.5×
Monthly cashflow live
- Estimated rent
- $1,588 high interval (Pro) →
- Mortgage (P&I)
- −$550
- Tax from tax record
- −$144 /mo · $1,725/yr
- Insurance
- −$44
- HOA
- −$0
- Vacancy / Maint / Mgmt
- −$333
- Net cashflow
- $517
Break-even live
UW: 25.0% down · 7.5% · 30yr · 1.5% tax · 5.0% vac · 8.0% maint · 8.0% mgmt
Financing live
Cash to close
- Down payment
- $26,225
- Closing costs
- $3,147
- Reserves months
- —
- Total cash needed
- —
Loan-product check · same deal, 3 products live
Conventional
25% down · 7.5% · 30yr
- Down + closing
- —
- Monthly P&I
- —
- Monthly cashflow
- —
- DSCR
- —
- Eligible?
- —
Personal DTI + credit; lowest rate.
DSCR
20% down · 8.5% · 30yr
- Down + closing
- —
- Monthly P&I
- —
- Monthly cashflow
- —
- DSCR
- —
- Eligible?
- —
No personal income docs; deal must DSCR.
Hard money
10% down · 12.0% · 12mo
- Down + closing
- —
- Monthly P&I
- —
- Monthly cashflow
- —
- DSCR
- —
- Eligible?
- —
Short-term bridge; refi at stabilization.
Rent comps 25 comps
| Address | Beds | Baths | Sqft | Rent | $/sqft | DOM | Units | Dist |
|---|---|---|---|---|---|---|---|---|
| 3001 Alene Ct Augusta, GA | 4.0 | 2.0 | 1288 | $1,631 | $1.27 | 23d | 1 | 0.05mi |
| 3613 Alene Cir Augusta, GA | 3.0 | 2.0 | 1260 | $1,325 | $1.05 | 14d | 1 | 0.08mi |
| 2914 Cumberland Dr Augusta, GA | 4.0 | 1.5 | 1650 | $1,400 | $0.85 | 21d | 1 | 0.41mi |
| 2813 Leawood Ct Hephzibah, GA | 3.0 | 2.0 | 1377 | $1,250 | $0.91 | 43d | 1 | 0.41mi |
| 2941 Rollingwood Dr Augusta, GA | 3.0 | 2.0 | 1297 | $1,750 | $1.35 | 23d | 1 | 0.42mi |
| 3200 Deans Bridge Rd Augusta, GA | 1.0–4.0 | 1.0–1.5 | 1075 | $1,125 | $1.05 | 23d | 6 | 0.53mi |
| 3412 Kensington Dr N Augusta, GA | 3.0 | 2.0 | 1225 | $1,350 | $1.10 | 23d | 1 | 0.75mi |
| 2631 Drayton Dr Augusta, GA | 3.0 | 2.0 | 1404 | $1,430 | $1.02 | 14d | 1 | 0.78mi |
| 2808 Nighthawk Dr Augusta, GA | 3.0 | 2.0 | 1314 | $1,450 | $1.10 | 43d | 1 | 0.78mi |
| 3519 Evangeline Dr Augusta, GA | 4.0 | 1.5 | 1800 | $1,595 | $0.89 | 43d | 1 | 0.82mi |
| 3504 Osage Ct Augusta, GA | 4.0 | 1.5 | 1425 | $1,556 | $1.09 | 14d | 1 | 0.89mi |
| 2609 Dublin Dr Augusta, GA | 3.0 | 2.0 | 1400 | $1,395 | $1.00 | 14d | 1 | 0.91mi |
| 2524 Drayton Dr Augusta, GA | 3.0 | 2.0 | 1404 | $1,700 | $1.21 | 43d | 1 | 0.98mi |
| 2727 Barclay St Hephzibah, GA | 4.0 | 2.0 | 1430 | $1,234 | $0.86 | 43d | 1 | 1.00mi |
| 2707 Gardenbrook Ct Augusta, GA | 3.0 | 2.0 | 1728 | $1,606 | $0.93 | 43d | 1 | 1.04mi |
| 2704 Cranbrook Dr Hephzibah, GA | 3.0 | 2.0 | 1377 | $1,650 | $1.20 | 43d | 1 | 1.09mi |
| 2834 Brentway Dr Hephzibah, GA | 3.0 | 2.0 | 1475 | $1,600 | $1.08 | 43d | 1 | 1.10mi |
| 3320 Hillis Rd Augusta, GA | 4.0 | 3.0 | 1788 | $1,850 | $1.03 | 14d | 1 | 1.13mi |
| 3524 Edgeworth Dr Hephzibah, GA | 3.0 | 2.0 | 1200 | $1,295 | $1.08 | 23d | 1 | 1.25mi |
| 2604 Edmonton Ct Hephzibah, GA | 3.0 | 2.0 | 1343 | $1,190 | $0.89 | 14d | 1 | 1.25mi |
| 3532 Edmonton St Hephzibah, GA | 3.0 | 2.0 | 1377 | $1,425 | $1.03 | 43d | 1 | 1.36mi |
| 3532 Edmonton St Hephzibah, GA | 3.0 | 2.0 | 1377 | $1,425 | $1.03 | 23d | 1 | 1.36mi |
| 3543 Windermere Dr Hephzibah, GA | 4.0 | 2.0 | 1394 | $1,550 | $1.11 | 43d | 1 | 1.38mi |
| 3543 Windermere Dr Hephzibah, GA | 4.0 | 2.0 | 1394 | $1,550 | $1.11 | 23d | 1 | 1.38mi |
| 3517 Byron Pl Augusta, GA | 3.0 | 2.0 | 1300 | $1,350 | $1.04 | 43d | 1 | 1.48mi |
Listing history 13 events
-
2026-06-14statusdays on market $104,900 Under Contract 15 DOM
-
2026-06-10statusdays on market $104,900 Active 14 DOM
-
2026-06-09days on market $104,900 New 13 DOM
-
2026-06-08days on market $104,900 New 12 DOM
-
2026-06-07days on market $104,900 New 11 DOM
-
2026-06-03days on market $104,900 New 7 DOM
-
2026-06-02days on market $104,900 New 6 DOM
-
2026-06-01days on market $104,900 New 5 DOM
-
2026-05-31days on market $104,900 New 4 DOM
-
2026-05-30days on market $104,900 New 3 DOM
-
2026-05-27$104,900 New
-
2017-08-18soldstatus $194,400
-
2002-10-01soldstatus $37,050
ⓘ Source: listings_history table (triggers on properties + properties_extension) + one-shot
backfill from property_details.listing_events for pre-trigger history.
Tax reassessment forecast GA · Resets to sale price
- Current annual tax
- $1,725 · $144/mo
- Projected year-2 tax
- $1,725 · $144/mo
- Expected delta
- $0/yr ($0/mo · -0.0%)
ⓘ Screening estimate from a state-policy table — verify with the county assessor before closing.
Climate risk First Street
- Flood 1/10 Low FEMA zone X (unshaded) · 0% chance over 30 yrs
- Wildfire 4/10 Moderate
- Heat 7/10 Severe 7 d/yr ≥106°F today · 17 d/yr by 30 yrs out
- Wind 6/10 Major 66% chance of damaging wind over 30 yrs
- Air quality 3/10 Moderate 3 unhealthy d/yr today · 3 by 30 yrs out
Nearby sold comps map
Loading sold comps map…
Walkable amenities ~0.75 mi
Loading nearby amenities…
Taxation est. · year 1
- Rental income
- $19,056
- − Mortgage interest
- −$5,876
- − Property taxes
- −$1,725
- − Insurance
- −$524
- − Repairs & maintenance
- −$1,525
- − Management
- −$1,525
- − Depreciation
- −$3,052
- Taxable income
- $4,830
- Est. tax owed @ 24.0%
- −$1,159
- After-tax cash flow
- $5,044/yr
For passive investors: Depreciation is non-cash, so a rental often shows a tax loss while cash-flowing — sheltering income. Rental losses are passive: they offset passive income freely, and up to $25,000/yr can offset ordinary (W-2) income if you actively participate and your MAGI is under $100k (phasing out to $0 by $150k); unused losses carry forward. On sale, claimed depreciation is recaptured at up to 25%, and gains may owe capital-gains tax (a 1031 exchange can defer both). Figures are a year-1 estimate at your 24.0% rate — not tax advice; consult a CPA.
Schools (NCES district)
- District
- Richmond County
- NCES district ID
- 1304380
- Math proficiency
- 12% ▼ -9.00%
- Reading proficiency
- 20% ▼ -6.00%
- Median HH income
- $38,069
- Composite
- 13.43/100
- National rank
- #9524
- State rank
- #154 of 174 in GA
Livability — Augusta-Richmond County consolidated government (balance)
No livability data for this city. (Only ~50 U.S. cities are tracked.)
Census & demographics
- Census place
- Augusta-Richmond County consolidated government (balance), GA
- County
- Richmond County · 190,917 people
- City population
- 154,035
- Metro
- Augusta-Richmond County, GA-SC
- Population (ZIP)
- 60,423
- Household income
- $45,999
- Rent vs Own
- Severe rent burden
- 3363.0
Population outlook (Richmond County) Hauer SSP2
- Today (2025)
- 200,753 people
- By 2030
- 200,232 · -0.3%
- By 2040
- 196,813 · -2.0%
- By 2050
- 190,347 · -5.2%
- By 2075
- 172,496 · -14.1%
- By 2100
- 146,284 · -27.1%
Race, ethnicity, and origin ACS 2023
- Neighborhood character
- Majority Black (64%)
- Race & ethnicity
- Black 64% White 27% Two or more races 5% Hispanic / Latino 5%
- Common ancestry
- Lithuanian 1%
- Foreign-born
- 2% · Canada
- Languages at home
- 95% English-only · Spanish 3% German/W. Germanic 1%
Political lean MEDSL · Richmond
- 2024 margin
- Solid D (+36.1) · D 67.8% · R 31.7%
- 2008→2024 swing
- +4.3pp toward D · 2008: 31.8pp · 2024: 36.1pp
- All cycles
- 2024: D+36.1 2020: D+37.2 2016: D+32.4 2012: D+33.8 2008: D+31.8
Not yet ingested
- Civics
- —
Market trends
- HPI YoY
- ▼ -58.99%
- Current HPI
- 213.5733
- Rent YoY
- ▼ -0.25%
- Metro
- Augusta-Richmond County, GA-SC
- State GDP YoY
- ▲ 2.66%
- F500 in state
- 28
Industry mix (Fortune 500 HQ in GA)
| Industry | F500 HQs | Revenue |
|---|---|---|
| Paper / Packaging | 2 | $29B |
|
||
| Retail | 1 | $160B |
|
||
| Transportation / Logistics | 1 | $91B |
|
||
| Airlines | 1 | $62B |
|
||
| Consumer Goods | 1 | $47B |
|
||
| Utilities | 1 | $25B |
|
||
Price history
+183.1% since first listed3 events — show timeline
- 2026-05-27 Listed $104,900 GAMLS
- 2017-08-18 Sold (Public Records) $194,400 Public Records
- 2002-10-01 Sold (Public Records) $37,050 Public Records
Property tax history
+4.4%/yrLatest (2025): $1,725 · +10.8% YoY. Source: county tax records.
Cash-flow waterfall
monthlySold comps — $/sqft
last 12 mo · ≤1 miLoading sold comps…