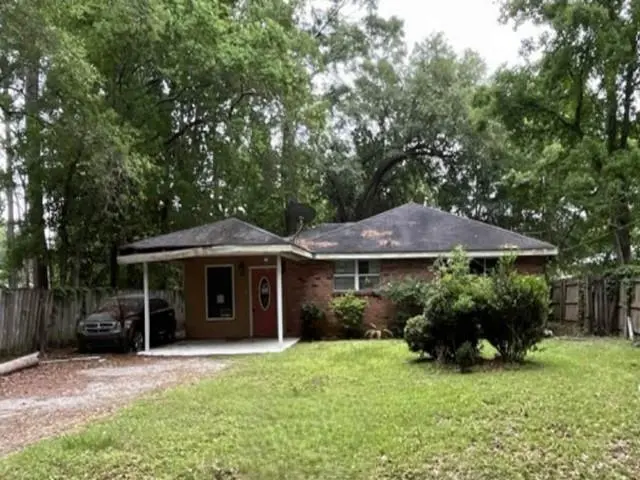
2550 Caroline St · Mandeville, LA
Flood risk No data
- FEMA flood zone
- —
- Chance of flooding over 30 yrs
- —
- Est. flood insurance / yr
- —
Fire risk No data
- Est. fire insurance / yr
- —
Heat risk No data
- Hot days now (above threshold)
- —
- Hot days in 30 yrs
- —
Wind risk No data
- Chance of severe wind over 30 yrs
- —
Air-quality risk No data
- Unhealthy air days now
- —
- Unhealthy air days in 30 yrs
- —
Risk factors via First Street. Map © Google.
Why this score? — see what drove the B grade
The composite is a weighted blend of 9 inputs, each scored 0–100. Each bar is that input's sub-score; the figure is the points it added to the 100-point composite (weight × sub-score).
- Cash flow +30.0/30.0
- 1% rule +10.0/10.0
- DSCR +10.0/10.0
- ARV discount +7.5/15.0
- Schools +4.3/10.0
- Livability +3.9/5.0
- Rent growth +2.8/5.0
- Condition / age +2.5/5.0
- Appreciation +0.0/10.0
$117,600
🖨 Deal sheet (PDF) 📄 Offer letter ✓ Due diligence
Listing remarks MLS
NO ACCESS OR VIEWINGS of this property. Please DO NOT DISTURB the occupant. Opportunity awaits in this three bedroom, two bath brick home. Take a drive by and see if it may be your next investment. "As is" cash only sale with no contingencies or inspections. Buyer will be responsible for obtaining possession of the property upon closing.
Key facts
- 8,725 sq ft lot
- Parking
- Built 1960
Property features AI
Finance
- Other: Human-modified listing information
- Financial info: Not specified
- HOA & community: Not specified
Exterior
- Parking: Carport with one parking space
- Security: Not specified
- Utilities: Public water; Public sewer
- Home design: Single-story; Entry level not specified; Facing direction not specified; Average condition
- Construction: Brick and frame construction; Shingle roof; Slab foundation; Built in an earlier year (year built not specified)
- Exterior features: City lot; Rectangular lot
Interior
- Kitchen: Not specified
- Bedrooms: Not specified
- Flooring: Not specified
- Bathrooms: 2 full bathrooms
- Heating & cooling: Central heating; Central air conditioning
- Interior features: Total of 5 rooms; Average condition
- Laundry & utility: Not specified
Neighborhood map
What this means for you Summary
Snapshot
- This is a 3-bed/2.0-bath single-family listed at $118k.
Deal economics
- At list price, monthly cash flow is $1k ($12k/yr) — positive.
- The deal already cash-flows at list — no discount required.
- Meets the 1% rule at list price ($2k rent vs $118k).
- Recommended offer: $114k (3.0% below list) — sets the bar for market timing.
- Cap rate 16.8% vs local median 3.4% in Mandeville — top-decile yield for the area; either an underpriced asset or a hidden risk that comps aren't pricing in. Stress-test before assuming the spread holds.
Location & tenants
- Location reads 77/100 on livability (#13 in LA, #3,224 nationally) — a middle-class / working-renter tenant base. Strengths: schools A+, employment A+, housing A+; Watch: amenities F, commute F.
- St. Tammany Parish (suburban): math 43% / reading 55% proficiency, ranked #11 of 98 in LA (top 11%) — families likely to look elsewhere, expect single-tenant / working-renter base with shorter leases.
- Market conditions: Rents rising (+1.1%/yr); 261 active listings in the ZIP; 29 comparable units currently listed for rent nearby; rentals at typical pace (median 25d on market — plan ~3-4 weeks tenant-placement turnaround); 45% of comp listings sitting > 30 days — soft ceiling on asking rent; solid renter incomes; 1,064 units permitted in St. Tammany Parish in 2024 (0 in 5+ unit buildings).
Forward outlook
- Local home prices are declining (-3.0%/yr); year-one equity from $813 of loan paydown is wiped out by about $4k of value loss. Plan a longer hold.
- St. Tammany County population projected at +27% by 2050 — long-run rental-demand tailwind backs the buy-and-hold thesis.
- At projected returns (-3.0% appreciation + 1.1% rent growth), your $33k cash investment doubles in ~4 years — after that, you're playing with house money.
Negotiation context
- It's been on market 32 days — a 3% lower offer ($114k) is reasonable based on typical stale-listing flexibility.
- 2 sale attempts with the ask held roughly flat each time — persistent listings suggest the price (not the market) is what's stuck; bring a comps-based counter.
Questions for the listing agent
- It's been on market 32 days. Have you received any prior offers? Is the seller open to a 3% concession, seller financing, or rate buy-down credit?
- Built in 1960 — when were the roof, HVAC, electrical panel, plumbing, and water heater last replaced?
- Is there a deadline driving the sale (1031 exchange, divorce, estate, relocation)? That informs how much negotiation room exists.
- Schools are A-rated — typically a magnet for longer-tenancy family renters. What's the average tenant stay here, and is there a school-zone premium baked into asking?
- What's the average days-on-market for RENTAL listings here right now (not sales)? A rising rental-DOM trend means longer vacancies and softer asking-rent achievability than the comps imply.
- What's the recent tenant-quality profile in this submarket — average credit score on applications, eviction rate, late-payment / NSF rate, and stable-employment percentage? A property-management company in the area should have these aggregated.
- How much new for-sale + rental construction is in the pipeline within 1–3 miles? Heavy new supply typically softens prices + rents 12–24 months out; constrained supply supports both.
Investment metrics
- 1% rule
- 1.87% ✓
- Cap rate
- 16.81%
- Cash-on-cash
- 37.56%
- DSCR
- 2.67
- GRM
- 4.5
CMA / ARV
- ARV (on-the-fly)
- $320,768
- Comps found
- 12
Show comp detail 12 sales within ~0.75 mi
| Address | Dist | Beds/Ba | Sqft | Sold | Price | $/sf | Match |
|---|---|---|---|---|---|---|---|
| 307 Goldenwood St | 0.26mi | 3/2.0 | 1,793 (+0%) | 2mo | $255,000 | $142 | 86 |
| 407 Goldenwood Dr | 0.30mi | 3/2.0 | 1,888 (+5%) | 3mo | $259,000 | $137 | 74 |
| 213 Elmwood St | 0.22mi | 3/2.0 | 1,583 (-12%) | 1mo | $290,000 | $183 | 70 |
| 2247 Orleans St | 0.36mi | 4/2.0 (+1) | 1,711 (-4%) | 3mo | $350,000 | $205 | 68 |
| 2244 America St | 0.33mi | 4/3.0 (+1) | 1,899 (+6%) | 1mo | $330,000 | $174 | 65 |
| 2152 Mcnamara St | 0.44mi | 4/2.0 (+1) | 1,902 (+6%) | 2mo | $435,000 | $229 | 63 |
| 1930 Dupard St | 0.71mi | 3/2.0 | 1,860 (+4%) | 4mo | $215,000 | $116 | 58 |
| 2433 Monroe St | 0.72mi | 3/2.0 | 1,647 (-8%) | 3mo | $295,000 | $179 | 50 |
| 3 Magnolia Ridge Ct | 0.61mi | 3/2.5 | 1,995 (+11%) | 3mo | $395,000 | $198 | 49 |
| 1929 Dupard St | 0.73mi | 3/2.0 | 2,014 (+12%) | 5mo | $260,000 | $129 | 41 |
| 727 Hutchinson St | 0.75mi | 3/2.0 | 1,535 (-14%) | 1mo | $225,000 | $147 | 40 |
| 714 Magnolia Ridge Dr W | 0.69mi | 4/2.0 (+1) | 2,018 (+13%) | 3mo | $398,000 | $197 | 39 |
Match score weights: distance 35% · size 25% · config 20% · recency 20%. Top-matched comps best support the ARV.
Projected returns pro-forma
-3.0% appreciation · 1.06% rent growth · sell at horizon
- IRR
- 31.4%
- Equity multiple
- 2.29×
- Total profit
- $42,335
- Equity at exit
- $17,535
- IRR
- 37.5%
- Equity multiple
- 4.18×
- Total profit
- $104,618
- Equity at exit
- $10,168
Cash invested: $32,928 (down + closing). Projections, not guarantees.
Landlord ↔ Tenant lean methodology
- Overall (STATE)
- 90 Strongly Landlord-Friendly
- State Louisiana
- 90 Strongly Landlord-Friendly · R+12
- County
- — inherits STATE
- City
- — inherits STATE
ZIP-level market 70448
- Rents YoY
- 1.1%
- Active inventory
- 261
- Price-to-rent
- 4.5×
Monthly cashflow live
- Estimated rent
- $2,202 high interval (Pro) →
- Mortgage (P&I)
- −$617
- Tax from tax record
- −$43 /mo · $520/yr
- Insurance
- −$49
- HOA
- −$0
- Vacancy / Maint / Mgmt
- −$462
- Net cashflow
- $1,031
Break-even live
Sensitivity live
| Price | -10% $1,097 | -5% $1,064 | +0% $1,031 | +5% $997 | +10% $964 |
|---|---|---|---|---|---|
| Rent | -10% $857 | -5% $944 | +0% $1,031 | +5% $1,118 | +10% $1,205 |
| Rate | -1.0pp $1,090 | -0.5pp $1,061 | base $1,031 | +0.5pp $1,000 | +1.0pp $969 |
UW: 25.0% down · 7.5% · 30yr · 1.5% tax · 5.0% vac · 8.0% maint · 8.0% mgmt
Financing live
Cash to close
- Down payment
- $29,400
- Closing costs
- $3,528
- Reserves months
- —
- Total cash needed
- —
Loan-product check · same deal, 3 products live
Conventional
25% down · 7.5% · 30yr
- Down + closing
- —
- Monthly P&I
- —
- Monthly cashflow
- —
- DSCR
- —
- Eligible?
- —
Personal DTI + credit; lowest rate.
DSCR
20% down · 8.5% · 30yr
- Down + closing
- —
- Monthly P&I
- —
- Monthly cashflow
- —
- DSCR
- —
- Eligible?
- —
No personal income docs; deal must DSCR.
Hard money
10% down · 12.0% · 12mo
- Down + closing
- —
- Monthly P&I
- —
- Monthly cashflow
- —
- DSCR
- —
- Eligible?
- —
Short-term bridge; refi at stabilization.
Rent comps 29 comps
| Address | Beds | Baths | Sqft | Rent | $/sqft | DOM | Units | Dist |
|---|---|---|---|---|---|---|---|---|
| 127 Oakwood Dr Mandeville, LA | 4.0 | 2.0 | 2000 | $2,000 | $1.00 | 45d | 1 | 0.24mi |
| 2304 McNamara St Mandeville, LA | 3.0 | 2.0 | 1404 | $1,900 | $1.35 | 18d | 1 | 0.29mi |
| 818 Carroll St Mandeville, LA | 2.0 | 2.5 | 1260 | $1,950 | $1.55 | 24d | 1 | 0.56mi |
| 125 Leah Dr Mandeville, LA | 4.0 | 3.0 | 2106 | $2,900 | $1.38 | 4d | 1 | 0.56mi |
| 2225 Labarre St Mandeville, LA | 4.0 | 2.5 | 2100 | $4,200 | $2.00 | 4d | 1 | 0.60mi |
| 810 Lafitte St Unit 105 Mandeville, LA | 2.0 | 2.5 | 1568 | $1,985 | $1.27 | 45d | 1 | 0.62mi |
| 810 Lafitte St Mandeville, LA | 2.0 | 2.5 | 1568 | $1,985 | $1.27 | 45d | 1 | 0.62mi |
| 575 Wilkinson St Mandeville, LA | 2.0 | 2.5 | 2156 | $3,200 | $1.48 | 45d | 1 | 0.64mi |
| 565 Ramon St Unit A Mandeville, LA | 4.0 | 2.0 | 1440 | $2,000 | $1.39 | 45d | 1 | 0.64mi |
| 565 Ramon St Unit A Mandeville, LA | 4.0 | 2.0 | 1440 | $2,000 | $1.39 | 13d | 1 | 0.64mi |
| 518 Ramon St Mandeville, LA | 3.0 | 2.5 | 1445 | $1,550 | $1.07 | 13d | 1 | 0.68mi |
| 611 Magnolia Ridge Dr E Mandeville, LA | 4.0 | 2.0 | 2120 | $2,850 | $1.34 | 45d | 1 | 0.75mi |
| 98 Trace Loop Unit 1 Mandeville, LA | 3.0 | 2.5 | 1400 | $1,500 | $1.07 | 18d | 1 | 0.84mi |
| 102 Trace Loop Unit 1 Mandeville, LA | 3.0 | 2.5 | 1400 | $1,500 | $1.07 | 45d | 1 | 0.84mi |
| 68 Trace Loop Mandeville, LA | 3.0 | 2.0 | 1747 | $2,000 | $1.14 | 24d | 1 | 0.84mi |
| 1555 Marigny Ave Mandeville, LA | 3.0 | 2.0 | 1375 | $2,000 | $1.45 | 45d | 1 | 0.86mi |
| 104 Trace Loop Mandeville, LA | 3.0 | 2.5 | 1400 | $1,500 | $1.07 | 45d | 1 | 0.86mi |
| 426 Lafitte St Mandeville, LA | 3.0 | 2.5 | 1660 | $2,700 | $1.63 | 4d | 1 | 0.93mi |
| 9 Trace Loop Mandeville, LA | 3.0 | 2.0 | 1660 | $2,300 | $1.39 | 24d | 1 | 0.93mi |
| 2130 Jefferson St Mandeville, LA | 2.0 | 1.0 | 1290 | $1,800 | $1.40 | 45d | 1 | 1.06mi |
| 539 Barbara Pl Mandeville, LA | 4.0 | 2.0 | 2200 | $2,800 | $1.27 | 45d | 1 | 1.06mi |
| 1605 Dupard St Mandeville, LA | 4.0 | 2.0 | 1495 | $2,200 | $1.47 | 13d | 1 | 1.09mi |
| 1349 Clausel St Mandeville, LA | 3.0 | 2.5 | 1300 | $1,995 | $1.53 | 4d | 1 | 1.10mi |
| 602 Foy St Mandeville, LA | 3.0 | 2.0 | 1360 | $2,500 | $1.84 | 4d | 1 | 1.14mi |
| 129 Mead Ct Mandeville, LA | 3.0 | 2.0 | 1580 | $1,850 | $1.17 | 4d | 1 | 1.19mi |
| 705 Tops L Dr Mandeville, LA | 2.0 | 2.5 | 1783 | $1,800 | $1.01 | 45d | 1 | 1.39mi |
| 409 Tops L Dr Mandeville, LA | 2.0 | 2.5 | 1783 | $1,800 | $1.01 | 18d | 1 | 1.40mi |
| 203 Tops L Dr #203 Mandeville, LA | 2.0 | 2.5 | 1750 | $1,650 | $0.94 | 45d | 1 | 1.41mi |
| 100 Saint Ann Dr Mandeville, LA | 1.0–3.0 | 1.0–2.5 | 1190 | $2,259 | $1.90 | 2d | 10 | 1.47mi |
Listing history 16 events
-
2026-06-21days on market $117,600 Active 32 DOM
-
2026-06-18days on market $117,600 Active 29 DOM
-
2026-06-17days on market $117,600 Active 28 DOM
-
2026-06-16days on market $117,600 Active 27 DOM
-
2026-06-15days on market $117,600 Active 26 DOM
-
2026-06-13days on market $117,600 Active 24 DOM
-
2026-06-10days on market $117,600 Active 21 DOM
-
2026-06-09days on market $117,600 Active 20 DOM
-
2026-06-08days on market $117,600 Active 19 DOM
-
2026-06-07days on market $117,600 Active 18 DOM
-
2026-06-03days on market $117,600 Active 14 DOM
-
2026-06-02days on market $117,600 Active 13 DOM
-
2026-06-01days on market $117,600 Active 12 DOM
-
2026-05-31days on market $117,600 Active 11 DOM
-
2026-05-20$117,600 Active
Show marketing remark (349 chars)
NO ACCESS OR VIEWINGS of this property. Please DO NOT DISTURB the occupant. Opportunity awaits in this three bedroom, two bath brick home. Take a drive by and see if it may be your next investment. "As is" cash only sale with no contingencies or inspections. Buyer will be responsible for obtaining possession of the property upon closing.
-
2026-05-20$117,600 Active 349-char remark
Show marketing remark (349 chars)
NO ACCESS OR VIEWINGS of this property. Please DO NOT DISTURB the occupant. Opportunity awaits in this three bedroom, two bath brick home. Take a drive by and see if it may be your next investment. "As is" cash only sale with no contingencies or inspections. Buyer will be responsible for obtaining possession of the property upon closing.
ⓘ Source: listings_history table (triggers on properties + properties_extension) + one-shot
backfill from property_details.listing_events for pre-trigger history.
Tax reassessment forecast LA · Resets to sale price
- Current annual tax
- $520 · $43/mo
- Projected year-2 tax
- $647 · $54/mo
- Expected delta
- +$126/yr (+$11/mo · 24.3%)
ⓘ Screening estimate from a state-policy table — verify with the county assessor before closing.
Nearby sold comps map
Loading sold comps map…
Walkable amenities ~0.75 mi
Loading nearby amenities…
Taxation est. · year 1
- Rental income
- $26,425
- − Mortgage interest
- −$6,587
- − Property taxes
- −$520
- − Insurance
- −$588
- − Repairs & maintenance
- −$2,114
- − Management
- −$2,114
- − Depreciation
- −$3,421
- Taxable income
- $11,080
- Est. tax owed @ 24.0%
- −$2,659
- After-tax cash flow
- $9,708/yr
For passive investors: Depreciation is non-cash, so a rental often shows a tax loss while cash-flowing — sheltering income. Rental losses are passive: they offset passive income freely, and up to $25,000/yr can offset ordinary (W-2) income if you actively participate and your MAGI is under $100k (phasing out to $0 by $150k); unused losses carry forward. On sale, claimed depreciation is recaptured at up to 25%, and gains may owe capital-gains tax (a 1031 exchange can defer both). Figures are a year-1 estimate at your 24.0% rate — not tax advice; consult a CPA.
Schools (NCES district)
- District
- St. Tammany Parish
- NCES district ID
- 2201650
- Math proficiency
- 43% ▼ -32.00%
- Reading proficiency
- 55% ▼ -26.00%
- Median HH income
- $61,752
- Composite
- 43.04/100
- National rank
- #3098
- State rank
- #11 of 98 in LA
Livability — Mandeville
- Score
- 77/100
- State rank
- #13
- US rank
- #3224
Category grades
Schools grade is shown separately in the Schools card above.
Census & demographics
- County
- Saint Tammany Parish · 228,296 people
- City population
- 50,537
- Metro
- New Orleans-Metairie, LA
- Population (ZIP)
- 26,338
- Household income
- $95,682
- Rent vs Own
- Severe rent burden
- 320.0
Population outlook (St. Tammany County) Hauer SSP2
- Today (2025)
- 286,725 people
- By 2030
- 304,175 · +6.1%
- By 2040
- 336,203 · +17.3%
- By 2050
- 364,590 · +27.2%
- By 2075
- 433,362 · +51.1%
- By 2100
- 470,333 · +64.0%
Race, ethnicity, and origin ACS 2023
- Neighborhood character
- Predominantly White (82%)
- Race & ethnicity
- White 82% Two or more races 10% Hispanic / Latino 9% Black 5% Asian 1%
- Hispanic origin (detail)
- Mexican 3%
- Common ancestry
- Lithuanian 16% Italian 2% Slovak 2%
- Foreign-born
- 5% · Canada, Vietnam, Jamaica
- Languages at home
- 92% English-only · Spanish 4% Russian/Polish/Slavic 1% German/W. Germanic 1%
Political lean MEDSL · St. Tammany
- 2024 margin
- Solid R (+43.8) · D 27.3% · R 71.1% · Other 1.6%
- 2008→2024 swing
- +9.6pp toward D · 2008: -53.4pp · 2024: -43.8pp
- All cycles
- 2024: R+43.8 2020: R+44.2 2016: R+50.8 2012: R+52.2 2008: R+53.4
Not yet ingested
- Civics
- —
Market trends
- HPI YoY
- ▼ -113.97%
- Current HPI
- 179.9084
- Rent YoY
- ▲ 1.06%
- Metro
- New Orleans-Metairie, LA
- State GDP YoY
- ▲ 3.29%
- F500 in state
- 10
Industry mix (Fortune 500 HQ in LA)
| Industry | F500 HQs | Revenue |
|---|---|---|
| Telecommunications | 2 | $23B |
|
||
| Utilities | 1 | $12B |
|
||
| Wholesale / Distribution | 1 | $5B |
|
||
| Advertising | 1 | $2B |
|
||
Price history
+0.0% since first listed2 events — show timeline
- 2026-05-20 Listed $117,600 AcadianaMLS
- 2026-05-20 Listed $117,600 GSREIN
Property tax history
-9.0%/yrLatest (2025): $520 · -3.6% YoY. Source: county tax records.
Cash-flow waterfall
monthlySold comps — $/sqft
last 12 mo · ≤1 miLoading sold comps…