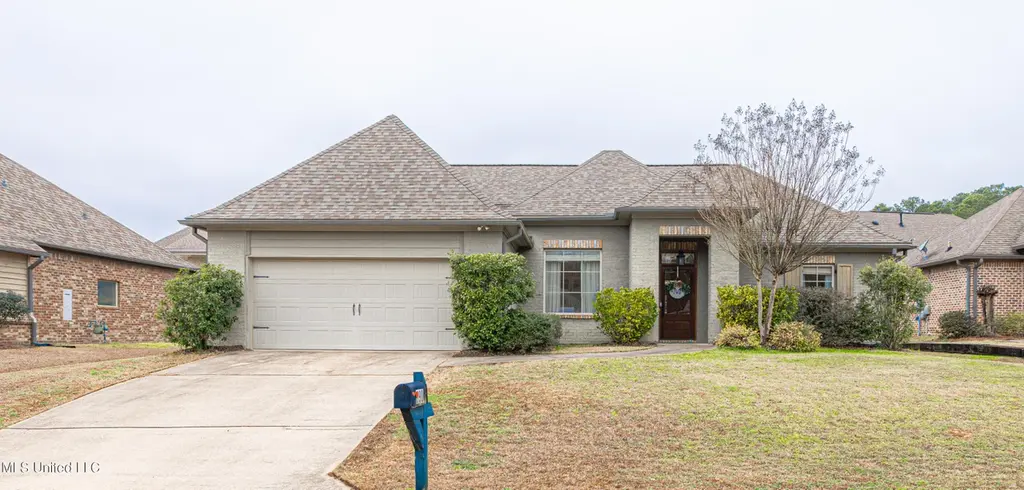
890 Willow Grande Cir · Flowood, MS
Flood risk 1/10 · Minimal
- FEMA flood zone
- X (unshaded)
- Chance of flooding over 30 yrs
- 0.0%
- Est. flood insurance / yr
- $507 – $1,088
Fire risk 4/10 · Minor
- Est. fire insurance / yr
- $1,241 – $2,305
Heat risk 7/10 · Major
- Hot days now (above 109°F)
- 7 days/yr
- Hot days in 30 yrs
- 20 days/yr
Wind risk 8/10 · Major
- Chance of severe wind over 30 yrs
- 80.0%
Air-quality risk 2/10 · Minimal
- Unhealthy air days now
- 1 days/yr
- Unhealthy air days in 30 yrs
- 1 days/yr
Risk factors via First Street. Map © Google.
Why this score? — see what drove the C- grade
The composite is a weighted blend of 9 inputs, each scored 0–100. Each bar is that input's sub-score; the figure is the points it added to the 100-point composite (weight × sub-score).
- Cash flow +17.7/30.0
- ARV discount +12.7/15.0
- DSCR +5.5/10.0
- Schools +4.6/10.0
- 1% rule +4.0/10.0
- Livability +3.9/5.0
- Rent growth +3.2/5.0
- Condition / age +2.5/5.0
- Appreciation +0.0/10.0
$269,000
🖨 Deal sheet 📄 Offer letter ✓ Due diligence
Listing remarks MLS
Welcome home to 890 Willow Grande Cir in Castlewoods of Brandon. Home has great curb appeal and is a 3/2 with 1489 sf. Granite countertops, updated appliances, granite on master bath countertops. Split plan. Covered back porch and fully fenced. Neighborhood has sidewalks and a playground and offers the opportunity to join Castlewoods Country Club with golf, tennis, and swimming.
Key facts
- Updated appliances
- Fully fenced
- Granite countertops
Tags
Neighborhood map
What this means for you Summary
Snapshot
- This is a 3-bed/2.0-bath single-family listed at $269k.
Deal economics
- At list price, monthly cash flow is $215 ($3k/yr) — positive.
- The deal already cash-flows at list — no discount required.
- To meet the 1% rule (rent ≥ 1% of price), the offer needs to be $241k (10.4% below list).
- Recommended offer: $241k (10.4% below list) — sets the bar for 1% rule.
- Cap rate 7.2% vs local median 4.3% in Flowood — top-decile yield for the area; either an underpriced asset or a hidden risk that comps aren't pricing in. Stress-test before assuming the spread holds.
Location & tenants
- Location reads 77/100 on livability (#10 in MS, #3,075 nationally) — a middle-class / working-renter tenant base. Strengths: crime A+, cost of living A+, housing A+; Watch: amenities F, commute F.
- Rankin County School District (rural): math 56% / reading 48% proficiency, ranked #6 of 130 in MS (top 5%) — acceptable for families but not a draw, mixed tenant base, ~2y average lease.
- Market conditions: Rents rising (+2.9%/yr); 433 active listings in the ZIP; 2 comparable units currently listed for rent nearby; solid renter incomes; 343 units permitted in Rankin County in 2024 (0 in 5+ unit buildings).
Forward outlook
- Local home prices are declining (-3.0%/yr); year-one equity from $2k of loan paydown is wiped out by about $8k of value loss. Plan a longer hold.
- Rankin County population projected at +17% by 2050 — long-run rental-demand tailwind backs the buy-and-hold thesis.
Negotiation context
- It's been on market 84 days — a 6% lower offer ($253k) is reasonable based on typical stale-listing flexibility.
- 3 sale attempts since 14y ago with the ask held roughly flat each time — persistent listings suggest the price (not the market) is what's stuck; bring a comps-based counter.
Risks & watch-outs
- Climate carrying-cost: severe wind risk, 80% chance of damaging wind over 30y; extreme-heat days projected 7→20/yr by 2055 (HVAC capex compounding) — expect insurance premiums to compound above CPI over the hold.
Questions for the listing agent
- It's been on market 84 days. Have you received any prior offers? Is the seller open to a 10% concession, seller financing, or rate buy-down credit?
- What does the HOA fee cover, when was the last increase, and are there any pending special assessments or reserve-fund shortfalls?
- Why hasn't it sold? Are there any deal-killer items the seller is aware of (foundation, flood, title, zoning, code violations)?
- Is there a deadline driving the sale (1031 exchange, divorce, estate, relocation)? That informs how much negotiation room exists.
- Schools are B-rated — typically a magnet for longer-tenancy family renters. What's the average tenant stay here, and is there a school-zone premium baked into asking?
- What's the average days-on-market for RENTAL listings here right now (not sales)? A rising rental-DOM trend means longer vacancies and softer asking-rent achievability than the comps imply.
- What's the recent tenant-quality profile in this submarket — average credit score on applications, eviction rate, late-payment / NSF rate, and stable-employment percentage? A property-management company in the area should have these aggregated.
- How much new for-sale + rental construction is in the pipeline within 1–3 miles? Heavy new supply typically softens prices + rents 12–24 months out; constrained supply supports both.
Investment metrics
- 1% rule
- 0.90% ✗
- Cap rate
- 7.25%
- Cash-on-cash
- 3.42%
- DSCR
- 1.15
- GRM
- 9.3
CMA / ARV
- ARV (median comp)
- $304,361
- List price
- $269,000
- Delta
- -11.62%
- Verdict
- UNDERPRICED
- Comps
- 20 within 1.0 mi
Show comp detail 12 sales within ~0.75 mi
| Address | Dist | Beds/Ba | Sqft | Sold | Price | $/sf | Match |
|---|---|---|---|---|---|---|---|
| 890 Willow Grande Cir | 0.00mi | 3/2.0 | 1,489 (+2%) | 0mo | $269,000 | $181 | 97 |
| 880 Willow Grande Cir | 0.06mi | 3/2.0 | 1,570 (+7%) | 2mo | $278,000 | $177 | 83 |
| 961 Willow Grande Cir | 0.09mi | 3/2.0 | 1,675 (+15%) | 5mo | $284,900 | $170 | 68 |
| 109 Willow Pl | 0.05mi | 3/2.0 | 1,648 (+13%) | 12mo | $285,000 | $173 | 67 |
| 529 Willow Valley Cir | 0.46mi | 3/2.0 | 1,547 (+6%) | 4mo | $273,900 | $177 | 66 |
| 971 Willow Grande Cir | 0.09mi | 3/2.0 | 1,665 (+14%) | 18mo | $298,000 | $179 | 58 |
| 862 Willow Grande Cir | 0.21mi | 3/2.0 | 1,632 (+12%) | 17mo | $239,900 | $147 | 57 |
| 905 Willow Grande Cir | 0.08mi | 3/2.0 | 1,680 (+15%) | 19mo | $293,900 | $175 | 55 |
| 502 Willow Court Dr | 0.54mi | 3/2.0 | 1,650 (+13%) | 2mo | $279,000 | $169 | 52 |
| 513 Willow Valley Cir | 0.52mi | 3/2.0 | 1,652 (+13%) | 10mo | $289,900 | $175 | 46 |
| 400 Castlewoods Blvd | 0.72mi | 3/2.0 | 1,648 (+13%) | 14mo | $272,000 | $165 | 34 |
| 604 Ridgeview Cir | 0.72mi | 3/2.0 | 1,608 (+10%) | 19mo | $285,000 | $177 | 34 |
Match score weights: distance 35% · size 25% · config 20% · recency 20%. Top-matched comps best support the ARV.
Projected returns pro-forma
-3.0% appreciation · 2.9% rent growth · sell at horizon
- IRR
- -11.1%
- Equity multiple
- 0.60×
- Total profit
- $-30,236
- Equity at exit
- $40,109
- IRR
- -2.0%
- Equity multiple
- 0.87×
- Total profit
- $-10,003
- Equity at exit
- $23,258
Cash invested: $75,320 (down + closing). Projections, not guarantees.
Landlord ↔ Tenant lean methodology
- Overall (STATE)
- 90 Strongly Landlord-Friendly
- State Mississippi
- 90 Strongly Landlord-Friendly · R+11
- County
- — inherits STATE
- City
- — inherits STATE
ZIP-level market 39047
- Home prices YoY
- -32.6%
- Rents YoY
- 2.9%
- Active inventory
- 433
- Price-to-rent
- 9.3×
Monthly cashflow live
- Estimated rent
- $2,409 medium interval (Pro) →
- Mortgage (P&I)
- −$1,411
- Tax from tax record
- −$137 /mo · $1,645/yr
- Insurance
- −$112
- HOA
- −$29
- Vacancy / Maint / Mgmt
- −$506
- Net cashflow
- $215
Break-even live
UW: 25.0% down · 7.5% · 30yr · 1.5% tax · 5.0% vac · 8.0% maint · 8.0% mgmt
Financing live
Cash to close
- Down payment
- $67,250
- Closing costs
- $8,070
- Reserves months
- —
- Total cash needed
- —
Loan-product check · same deal, 3 products live
Conventional
25% down · 7.5% · 30yr
- Down + closing
- —
- Monthly P&I
- —
- Monthly cashflow
- —
- DSCR
- —
- Eligible?
- —
Personal DTI + credit; lowest rate.
DSCR
20% down · 8.5% · 30yr
- Down + closing
- —
- Monthly P&I
- —
- Monthly cashflow
- —
- DSCR
- —
- Eligible?
- —
No personal income docs; deal must DSCR.
Hard money
10% down · 12.0% · 12mo
- Down + closing
- —
- Monthly P&I
- —
- Monthly cashflow
- —
- DSCR
- —
- Eligible?
- —
Short-term bridge; refi at stabilization.
Rent comps 2 comps
| Address | Beds | Baths | Sqft | Rent | $/sqft | DOM | Units | Dist |
|---|---|---|---|---|---|---|---|---|
| 917 Willow Grande Cir Brandon, MS | 4.0 | 2.0 | 1823 | $2,400 | $1.32 | 13d | 1 | 0.13mi |
| 1000 Vineyard Dr Brandon, MS | 1.0–3.0 | 1.0–2.0 | 1138 | $1,900 | $1.67 | 23d | 9 | 1.03mi |
HOA detail
- Monthly dues
- $29 · $348/yr
Listing history 6 events
-
2026-05-12status Pending 381-char remark
Show marketing remark (381 chars)
Welcome home to 890 Willow Grande Cir in Castlewoods of Brandon. Home has great curb appeal and is a 3/2 with 1489 sf. Granite countertops, updated appliances, granite on master bath countertops. Split plan. Covered back porch and fully fenced. Neighborhood has sidewalks and a playground and offers the opportunity to join Castlewoods Country Club with golf, tennis, and swimming.
-
2026-02-17$269,000 Active 381-char remark
Show marketing remark (381 chars)
Welcome home to 890 Willow Grande Cir in Castlewoods of Brandon. Home has great curb appeal and is a 3/2 with 1489 sf. Granite countertops, updated appliances, granite on master bath countertops. Split plan. Covered back porch and fully fenced. Neighborhood has sidewalks and a playground and offers the opportunity to join Castlewoods Country Club with golf, tennis, and swimming.
-
2019-10-10soldstatus 549-char remark
Show marketing remark (549 chars)
One owner home that has been well maintained. Step inside a spacious Open Familyroom leading to beautiful Kitchen and Dining area. Granite counters with tumblestone backsplash, beautiful cabinetry and stainless appliances adorn the kitchen. This SPLIT plan offers a Master suite w/trey ceilings & ceiling fan. Bath offers double vanities, jetted tub, separate shower and large walk-in closet. The backyard offers covered patio with beaded board ceiling and privacy wood fence. Come and view this lovely home, and you would want to call it HOME!!
-
2019-07-25$196,900 549-char remark
Show marketing remark (549 chars)
One owner home that has been well maintained. Step inside a spacious Open Familyroom leading to beautiful Kitchen and Dining area. Granite counters with tumblestone backsplash, beautiful cabinetry and stainless appliances adorn the kitchen. This SPLIT plan offers a Master suite w/trey ceilings & ceiling fan. Bath offers double vanities, jetted tub, separate shower and large walk-in closet. The backyard offers covered patio with beaded board ceiling and privacy wood fence. Come and view this lovely home, and you would want to call it HOME!!
-
2012-10-24soldstatus
-
2012-08-01$178,500
ⓘ Source: listings_history table (triggers on properties + properties_extension) + one-shot
backfill from property_details.listing_events for pre-trigger history.
Tax reassessment forecast MS · Resets to sale price
- Current annual tax
- $1,645 · $137/mo
- Projected year-2 tax
- $2,125 · $177/mo
- Expected delta
- +$480/yr (+$40/mo · 29.2%)
ⓘ Screening estimate from a state-policy table — verify with the county assessor before closing.
Climate risk First Street
- Flood 1/10 Low FEMA zone X (unshaded) · 0% chance over 30 yrs
- Wildfire 4/10 Moderate
- Heat 7/10 Severe 7 d/yr ≥109°F today · 20 d/yr by 30 yrs out
- Wind 8/10 Severe 80% chance of damaging wind over 30 yrs
- Air quality 2/10 Low 1 unhealthy d/yr today · 1 by 30 yrs out
Nearby sold comps map
Loading sold comps map…
Walkable amenities ~0.75 mi
Loading nearby amenities…
Taxation est. · year 1
- Rental income
- $28,912
- − Mortgage interest
- −$15,068
- − Property taxes
- −$1,645
- − Insurance
- −$1,345
- − Repairs & maintenance
- −$2,313
- − Management
- −$2,313
- − HOA
- −$348
- − Depreciation
- −$7,825
- Taxable loss
- −$1,946
- Est. tax savings @ 24.0%
- +$467
- After-tax cash flow
- $3,041/yr
For passive investors: Depreciation is non-cash, so a rental often shows a tax loss while cash-flowing — sheltering income. Rental losses are passive: they offset passive income freely, and up to $25,000/yr can offset ordinary (W-2) income if you actively participate and your MAGI is under $100k (phasing out to $0 by $150k); unused losses carry forward. On sale, claimed depreciation is recaptured at up to 25%, and gains may owe capital-gains tax (a 1031 exchange can defer both). Figures are a year-1 estimate at your 24.0% rate — not tax advice; consult a CPA.
Schools (NCES district)
- District
- Rankin County School District
- NCES district ID
- 2803830
- Math proficiency
- 56% ▼ -4.00%
- Reading proficiency
- 48% ▼ -6.00%
- Median HH income
- $61,867
- Composite
- 45.62/100
- National rank
- #2587
- State rank
- #6 of 130 in MS
Livability — Flowood
- Score
- 77/100
- State rank
- #10
- US rank
- #3075
Category grades
Schools grade is shown separately in the Schools card above.
Census & demographics
- County
- Rankin County · 123,614 people
- City population
- 9,222
- Metro
- Jackson, MS
- Population (ZIP)
- 40,808
- Household income
- $100,347
- Rent vs Own
- Severe rent burden
- 551.0
Population outlook (Rankin County) Hauer SSP2
- Today (2025)
- 164,317 people
- By 2030
- 171,013 · +4.1%
- By 2040
- 182,723 · +11.2%
- By 2050
- 192,376 · +17.1%
- By 2075
- 209,535 · +27.5%
- By 2100
- 209,534 · +27.5%
Race, ethnicity, and origin ACS 2023
- Neighborhood character
- Predominantly White (77%)
- Race & ethnicity
- White 77% Black 16% Two or more races 4% Hispanic / Latino 2% Asian 1%
- Common ancestry
- Italian 4% Slovak 3% Serbian 3%
- Foreign-born
- 3% · Canada
- Languages at home
- 95% English-only · Spanish 3% Other Indo-European 1% Other Asian/Pacific 1%
Political lean MEDSL · Rankin
- 2024 margin
- Solid R (+47.1) · D 25.9% · R 73.0% · Other 1.0%
- 2008→2024 swing
- +6.4pp toward D · 2008: -53.5pp · 2024: -47.1pp
- All cycles
- 2024: R+47.1 2020: R+45.4 2016: R+52.9 2012: R+51.9 2008: R+53.5
Not yet ingested
- Civics
- —
Market trends
- HPI YoY
- ▼ -79.01%
- Current HPI
- 162.9709
- Rent YoY
- ▲ 2.90%
- Metro
- Jackson, MS
- State GDP YoY
- —
- F500 in state
- 0
Price history
+50.7% since first listed6 events — show timeline
- 2026-05-12 Pending — MLSU
- 2026-02-17 Listed $269,000 MLSU
- 2019-10-10 Sold (MLS) — MLSU
- 2019-07-25 Listed $196,900 MLSU
- 2012-10-24 Sold (MLS) — MLSU
- 2012-08-01 Listed $178,500 MLSU
Property tax history
+3.5%/yrLatest (2025): $1,645 · +6.5% YoY. Source: county tax records.
Cash-flow waterfall
monthlySold comps — $/sqft
last 12 mo · ≤1 miLoading sold comps…