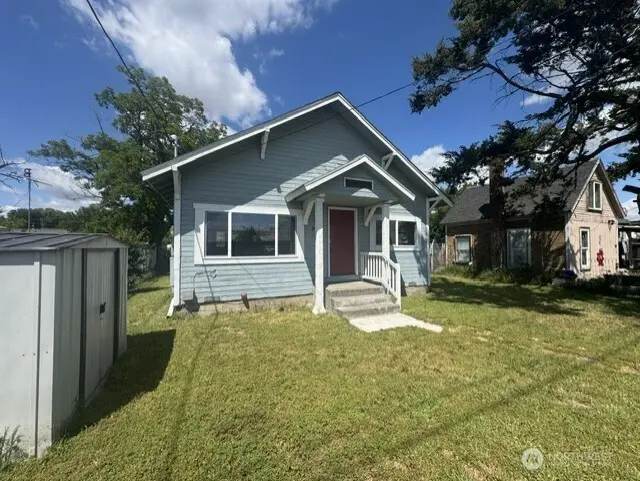
940 Edith Ave · Walla Walla, WA
Flood risk 1/10 · Minimal
- FEMA flood zone
- —
- Chance of flooding over 30 yrs
- 0.0%
- Est. flood insurance / yr
- —
Fire risk 1/10 · Minimal
- Est. fire insurance / yr
- $604 – $1,122
Heat risk 4/10 · Minor
- Hot days now (above 98°F)
- 7 days/yr
- Hot days in 30 yrs
- 15 days/yr
Wind risk 1/10 · Minimal
- Chance of severe wind over 30 yrs
- —
Air-quality risk 8/10 · Major
- Unhealthy air days now
- 11 days/yr
- Unhealthy air days in 30 yrs
- 14 days/yr
Risk factors via First Street. Map © Google.
Why this score? — see what drove the D grade
The composite is a weighted blend of 9 inputs, each scored 0–100. Each bar is that input's sub-score; the figure is the points it added to the 100-point composite (weight × sub-score).
- ARV discount +14.0/15.0
- Cash flow +10.2/30.0
- Schools +4.1/10.0
- Livability +4.0/5.0
- Rent growth +3.1/5.0
- DSCR +2.9/10.0
- Condition / age +2.5/5.0
- 1% rule +1.8/10.0
- Appreciation +0.0/10.0
$219,000
🖨 Deal sheet 📄 Offer letter ✓ Due diligence
Listing remarks
This charming 3-bedroom, 1-bath single-level home offers efficient living with a smart layout across 752 sq. ft. Ideal as a first home or investment property, it features new carpet, a newer roof, and true move-in-ready convenience. The fully fenced yard provides room to play, while alley access to the backyard adds flexibility for parking, storage, or future improvements. A great opportunity to own a well-kept home with strong long-term potential.
Key facts
- Alley access
- New carpet
- Newer roof
Tags
Property features AI
Finance
- Other: Lot features include alley access and paved frontage; Lot approximately 0.1205 acres; Living area approximately 752 square feet; Building name: Butlers; Senior exemption available
- Financial info: Accepts Cash, Conventional, FHA, USDA Loan, VA Loan
Exterior
- Parking: No parking
- Security: Fully fenced
- Utilities: Electric energy source; Public water (City of Walla Walla); Sewer connected (City of Walla Walla); Pacific Power
- Home design: Single-family house; One story; Built on lot; Faces level topography
- Construction: Built circa 1900 (effective year); Standard frame construction; Wood construction materials; Composition roof; Block foundation
- Exterior features: Fully fenced lot; Wood exterior
Interior
- Kitchen: Dishwasher
- Bedrooms: 3 bedrooms (all on the main level)
- Flooring: Vinyl; Carpet
- Bathrooms: 1 full bathroom (main level) with bathtub and shower
- Heating & cooling: Baseboard heating; No cooling
- Interior features: Ceiling fan(s); Water heater
- Laundry & utility: Water heater located in laundry area
Neighborhood map
What this means for you Summary
Snapshot
- This is a 2-bed/1.0-bath single-family listed at $219k.
Deal economics
- At list price, monthly cash flow is $-123 ($-1k/yr) — negative.
- To cash-flow at today's rent, offer at most $197k (9.9% below list).
- To meet the 1% rule (rent ≥ 1% of price), the offer needs to be $149k (32.2% below list).
- Recommended offer: $149k (32.2% below list) — sets the bar for 1% rule.
- Cap rate 5.6% vs local median 2.3% in Walla Walla — top-decile yield for the area; either an underpriced asset or a hidden risk that comps aren't pricing in. Stress-test before assuming the spread holds.
Location & tenants
- Location reads 79/100 on livability (#105 in WA, #2,015 nationally) — a middle-class / working-renter tenant base. Strengths: amenities A+, commute A+, housing A+.
- Walla Walla Public Schools (urban): math 41% / reading 50% proficiency, ranked #179 of 291 in WA (top 62%) — families likely to look elsewhere, expect single-tenant / working-renter base with shorter leases.
- Zoned schools: Walla Walla High School (1,631 students, 60% FRL).
- Market conditions: Rents rising (+2.4%/yr); 422 active listings in the ZIP; 11 comparable units currently listed for rent nearby; rentals lingering (median 44d on market — plan ~5-8 weeks vacancy on turnover, expect pricing pressure); 82% of comp listings sitting > 30 days — soft ceiling on asking rent; 206 units permitted in Walla Walla County in 2024 (50 in 5+ unit buildings).
Forward outlook
- Local home prices are declining (-3.0%/yr); year-one equity from $2k of loan paydown is wiped out by about $7k of value loss. Plan a longer hold.
- Walla Walla County population projected at +8% by 2050 — modest demand growth; plan on rents tracking national, not racing it.
Negotiation context
- It's been on market 25 days — a 2% lower offer ($216k) is reasonable based on typical stale-listing flexibility.
- Current owner paid $15k; list at $219k implies a 1360% gain — meaningful room to come down on a strong offer.
Risks & watch-outs
- Watch-outs: built in 1900 — expect roof / HVAC / electrical / plumbing capex.
Questions for the listing agent
- What do current leases actually rent for vs. the listed asking? Can we see a recent rent roll and the last 12 months of T-12 income?
- Built in 1900 — when were the roof, HVAC, electrical panel, plumbing, and water heater last replaced?
- Is there a deadline driving the sale (1031 exchange, divorce, estate, relocation)? That informs how much negotiation room exists.
- The area grade is low — what's the realistic commute time and amenity access for the typical tenant pool here? Any planned neighborhood developments (good or bad) we should know about?
- What's the average days-on-market for RENTAL listings here right now (not sales)? A rising rental-DOM trend means longer vacancies and softer asking-rent achievability than the comps imply.
- What's the recent tenant-quality profile in this submarket — average credit score on applications, eviction rate, late-payment / NSF rate, and stable-employment percentage? A property-management company in the area should have these aggregated.
- How much new for-sale + rental construction is in the pipeline within 1–3 miles? Heavy new supply typically softens prices + rents 12–24 months out; constrained supply supports both.
Investment metrics
- 1% rule
- 0.68% ✗
- Cap rate
- 5.62%
- Cash-on-cash
- -2.41%
- DSCR
- 0.89
- GRM
- 12.3
CMA / ARV
- ARV (on-the-fly)
- $255,744
- Comps found
- 5
Show comp detail 5 sales within ~0.75 mi
| Address | Dist | Beds/Ba | Sqft | Sold | Price | $/sf | Match |
|---|---|---|---|---|---|---|---|
| 1312 N 11th Ave | 0.09mi | 2/1.0 | 832 (-4%) | 23mo | $300,000 | $361 | 71 |
| 738 N 9th Ave | 0.41mi | 2/1.0 | 812 (-6%) | 4mo | $240,000 | $296 | 68 |
| 738 N 8th Ave | 0.44mi | 3/1.0 (+1) | 862 (-0%) | 11mo | $180,000 | $209 | 65 |
| 741 N 8th Ave | 0.42mi | 2/1.0 | 936 (+8%) | 11mo | $171,000 | $183 | 58 |
| 520 N 6th Ave | 0.63mi | 2/1.0 | 816 (-6%) | 22mo | $265,000 | $325 | 43 |
Match score weights: distance 35% · size 25% · config 20% · recency 20%. Top-matched comps best support the ARV.
Projected returns pro-forma
-3.0% appreciation · 2.4% rent growth · sell at horizon
- IRR
- -20.9%
- Equity multiple
- 0.28×
- Total profit
- $-44,318
- Equity at exit
- $32,654
- IRR
- -15.7%
- Equity multiple
- 0.14×
- Total profit
- $-52,736
- Equity at exit
- $18,935
Cash invested: $61,320 (down + closing). Projections, not guarantees.
Landlord ↔ Tenant lean methodology
- Overall (STATE)
- 28 Tenant-Leaning
- State Washington
- 28 Tenant-Leaning · D+8
- County
- — inherits STATE
- City
- — inherits STATE
ZIP-level market 99362
- Rents YoY
- 2.4%
- Active inventory
- 422
- Price-to-rent
- 12.3×
Monthly cashflow live
- Estimated rent
- $1,485 high interval (Pro) →
- Mortgage (P&I)
- −$1,148
- Tax from tax record
- −$57 /mo · $680/yr
- Insurance
- −$91
- HOA
- −$0
- Vacancy / Maint / Mgmt
- −$312
- Net cashflow
- $-123
Break-even live
UW: 25.0% down · 7.5% · 30yr · 1.5% tax · 5.0% vac · 8.0% maint · 8.0% mgmt
Financing live
Cash to close
- Down payment
- $54,750
- Closing costs
- $6,570
- Reserves months
- —
- Total cash needed
- —
Loan-product check · same deal, 3 products live
Conventional
25% down · 7.5% · 30yr
- Down + closing
- —
- Monthly P&I
- —
- Monthly cashflow
- —
- DSCR
- —
- Eligible?
- —
Personal DTI + credit; lowest rate.
DSCR
20% down · 8.5% · 30yr
- Down + closing
- —
- Monthly P&I
- —
- Monthly cashflow
- —
- DSCR
- —
- Eligible?
- —
No personal income docs; deal must DSCR.
Hard money
10% down · 12.0% · 12mo
- Down + closing
- —
- Monthly P&I
- —
- Monthly cashflow
- —
- DSCR
- —
- Eligible?
- —
Short-term bridge; refi at stabilization.
Rent comps 11 comps
| Address | Beds | Baths | Sqft | Rent | $/sqft | DOM | Units | Dist |
|---|---|---|---|---|---|---|---|---|
| 427 E Pine St Unit 427 Walla Walla, WA | 2.0 | 1.0 | 752 | $1,225 | $1.63 | 14d | 1 | 0.77mi |
| 524 E Pine St Unit A Walla Walla, WA | 2.0 | 1.0 | 864 | $1,495 | $1.73 | 21d | 1 | 0.82mi |
| 427 E Cherry St Walla Walla, WA | 2.0 | 1.0 | 1002 | $1,795 | $1.79 | 44d | 1 | 0.89mi |
| 105 N Spokane St Unit 201 Walla Walla, WA | 2.0 | 1.0 | 750 | $1,250 | $1.67 | 44d | 1 | 0.96mi |
| 327 E Rose St Walla Walla, WA | 1.0–2.0 | 1.0–2.0 | 863 | $2,421 | $2.80 | 44d | 8 | 1.00mi |
| 104 S Palouse St Walla Walla, WA | 1.0 | 1.0 | 800 | $1,100 | $1.38 | 44d | 1 | 1.23mi |
| 330 S 4th Ave Unit 1 Walla Walla, WA | 1.0 | 1.0 | 550 | $900 | $1.64 | 44d | 1 | 1.26mi |
| 332 S 3rd Ave Walla Walla, WA | 2.0 | 1.0 | 1084 | $1,630 | $1.50 | 44d | 1 | 1.28mi |
| 385 Catherine St Unit 387C Walla Walla, WA | 1.0 | 1.0 | 550 | $950 | $1.73 | 44d | 1 | 1.46mi |
| 115 Merriam St Walla Walla, WA | 1.0–2.0 | 1.0 | 800 | $1,650 | $2.06 | 44d | 9 | 1.48mi |
| 378 S Park St Walla Walla, WA | 2.0 | 1.5 | 800 | $1,200 | $1.50 | 44d | 1 | 1.50mi |
Listing history 16 events
-
2026-06-19days on market $219,000 Active 25 DOM
-
2026-06-18days on market $219,000 Active 24 DOM
-
2026-06-17days on market $219,000 Active 23 DOM
-
2026-06-16days on market $219,000 Active 22 DOM
-
2026-06-15days on market $219,000 Active 21 DOM
-
2026-06-14days on market $219,000 Active 19 DOM
-
2026-06-12days on market $219,000 Active 18 DOM
-
2026-06-09days on market $219,000 Active 15 DOM
-
2026-06-08days on market $219,000 Active 14 DOM
-
2026-06-07days on market $219,000 Active 13 DOM
-
2026-06-02days on market $219,000 Active 8 DOM
-
2026-06-01days on market $219,000 Active 7 DOM
-
2026-05-31days on market $219,000 Active 6 DOM
-
2026-05-30days on market $219,000 Active 5 DOM
-
2026-05-25$219,000 Active
-
1983-08-10soldstatus $15,000
ⓘ Source: listings_history table (triggers on properties + properties_extension) + one-shot
backfill from property_details.listing_events for pre-trigger history.
Tax reassessment forecast WA · Resets to sale price
- Current annual tax
- $680 · $57/mo
- Projected year-2 tax
- $2,146 · $179/mo
- Expected delta
- +$1,466/yr (+$122/mo · 215.6%)
ⓘ Screening estimate from a state-policy table — verify with the county assessor before closing.
Climate risk First Street
- Flood 1/10 Low 0% chance over 30 yrs
- Wildfire 1/10 Low
- Heat 4/10 Moderate 7 d/yr ≥98°F today · 15 d/yr by 30 yrs out
- Wind 1/10 Low
- Air quality 8/10 Severe 11 unhealthy d/yr today · 14 by 30 yrs out
Nearby sold comps map
Loading sold comps map…
Walkable amenities ~0.75 mi
Loading nearby amenities…
Taxation est. · year 1
- Rental income
- $17,825
- − Mortgage interest
- −$12,267
- − Property taxes
- −$680
- − Insurance
- −$1,095
- − Repairs & maintenance
- −$1,426
- − Management
- −$1,426
- − Depreciation
- −$6,371
- Taxable loss
- −$5,440
- Est. tax savings @ 24.0%
- +$1,306
- After-tax cash flow
- $-169/yr
For passive investors: Depreciation is non-cash, so a rental often shows a tax loss while cash-flowing — sheltering income. Rental losses are passive: they offset passive income freely, and up to $25,000/yr can offset ordinary (W-2) income if you actively participate and your MAGI is under $100k (phasing out to $0 by $150k); unused losses carry forward. On sale, claimed depreciation is recaptured at up to 25%, and gains may owe capital-gains tax (a 1031 exchange can defer both). Figures are a year-1 estimate at your 24.0% rate — not tax advice; consult a CPA.
Schools (NCES district)
- District
- Walla Walla Public Schools
- NCES district ID
- 5309450
- Math proficiency
- 41% ▲ 3.00%
- Reading proficiency
- 50% ▼ -1.00%
- Median HH income
- $46,207
- Composite
- 40.88/100
- National rank
- #7531
- State rank
- #179 of 291 in WA
Livability — Walla Walla
- Score
- 79/100
- State rank
- #105
- US rank
- #2015
Category grades
Schools grade is shown separately in the Schools card above.
Census & demographics
- Census place
- Walla Walla, WA
- County
- Walla Walla County · 52,990 people
- City population
- 42,853
- Metro
- Walla Walla, WA
- Population (ZIP)
- 42,853
- Household income
- $72,474
- Rent vs Own
- Severe rent burden
- 1238.0
Population outlook (Walla Walla County) Hauer SSP2
- Today (2025)
- 63,088 people
- By 2030
- 64,417 · +2.1%
- By 2040
- 66,563 · +5.5%
- By 2050
- 68,337 · +8.3%
- By 2075
- 73,235 · +16.1%
- By 2100
- 74,878 · +18.7%
Race, ethnicity, and origin ACS 2023
- Neighborhood character
- Predominantly White (69%)
- Race & ethnicity
- White 69% Hispanic / Latino 22% Two or more races 9% Black 2% Asian 2% Native American 2%
- Hispanic origin (detail)
- Mexican 17%
- Common ancestry
- Slovak 3% Portuguese 3% Lithuanian 3%
- Foreign-born
- 9% · Canada, China
- Languages at home
- 83% English-only · Spanish 15% Chinese 1%
Political lean MEDSL · Walla Walla
- 2024 margin
- Lean R (+8.1) · D 44.6% · R 52.7% · Other 2.7%
- 2008→2024 swing
- +8.5pp toward D · 2008: -16.6pp · 2024: -8.1pp
- All cycles
- 2024: R+8.1 2020: R+8.7 2016: R+16.4 2012: R+22.3 2008: R+16.6
Not yet ingested
- Civics
- —
Market trends
- HPI YoY
- ▼ -488.03%
- Current HPI
- 321.6891
- Rent YoY
- ▲ 2.40%
- Metro
- Walla Walla, WA
- State GDP YoY
- ▲ 4.65%
- F500 in state
- 22
Industry mix (Fortune 500 HQ in WA)
| Industry | F500 HQs | Revenue |
|---|---|---|
| Retail | 2 | $269B |
|
||
| Technology / Retail | 1 | $638B |
|
||
| Technology | 1 | $245B |
|
||
| Telecommunications | 1 | $38B |
|
||
| Food / Beverage | 1 | $36B |
|
||
| Automotive / Trucks | 1 | $34B |
|
||
Price history
+1360.0% since first listed2 events — show timeline
- 2026-05-25 Listed $219,000 NWMLS as Distributed by MLS Grid
- 1983-08-10 Sold (Public Records) $15,000 Public Records
Property tax history
+1.4%/yrLatest (2026): $680 · -1.3% YoY. Source: county tax records.
Cash-flow waterfall
monthlySold comps — $/sqft
last 12 mo · ≤1 miLoading sold comps…