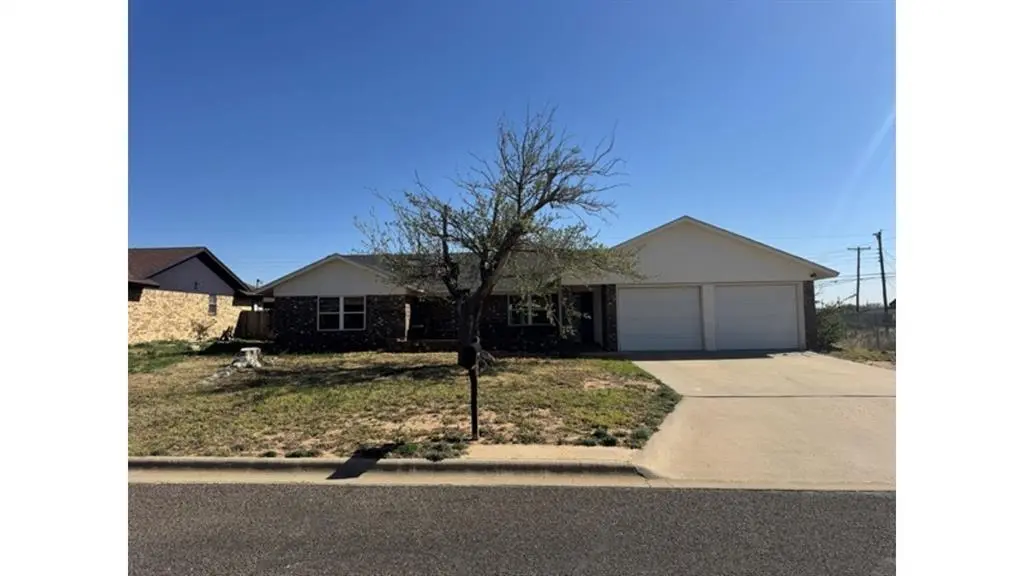
4004 Vicky St · Big Spring, TX
Flood risk 1/10 · Minimal
- FEMA flood zone
- X (unshaded)
- Chance of flooding over 30 yrs
- 0.0%
- Est. flood insurance / yr
- $507 – $1,088
Fire risk 10/10 · Severe
- Est. fire insurance / yr
- $1,222 – $2,270
Heat risk 6/10 · Moderate
- Hot days now (above 102°F)
- 6 days/yr
- Hot days in 30 yrs
- 19 days/yr
Wind risk 2/10 · Minimal
- Chance of severe wind over 30 yrs
- 4.0%
Air-quality risk 1/10 · Minimal
- Unhealthy air days now
- 0 days/yr
- Unhealthy air days in 30 yrs
- 0 days/yr
Risk factors via First Street. Map © Google.
Why this score? — see what drove the C grade
The composite is a weighted blend of 9 inputs, each scored 0–100. Each bar is that input's sub-score; the figure is the points it added to the 100-point composite (weight × sub-score).
- Cash flow +22.1/30.0
- ARV discount +9.5/15.0
- DSCR +7.1/10.0
- 1% rule +6.4/10.0
- Livability +3.1/5.0
- Rent growth +2.5/5.0
- Schools +2.5/10.0
- Condition / age +2.5/5.0
- Appreciation +0.0/10.0
$155,000
🖨 Deal sheet 📄 Offer letter ✓ Due diligence
Listing remarks
4-bedroom, 2-bathroom single-family residence built in 1975 with approximately 2,442 square feet of living space. The home features a functional layout with multiple living areas and an attached garage. Interior includes a kitchen connected to the main living and dining areas, along with four bedrooms and two full bathrooms. Large windows provide natural light throughout the home. Located in Big Spring within Howard County, the property provides convenient access to local schools, shopping, dining, and nearby roadways.
Key facts
- 8,799 sq ft lot
- 2 garage spots
- Built 1975
Property features AI
Finance
- Other: Listing terms and status: For Sale, Active; Possession at closing/funding
- Financial info: Accepts Cash, Conventional, FHA, USDA Loan, VA Loan; Treat as clear loan type; No second mortgage
- HOA & community: No association
Exterior
- Parking: Attached 2-car garage with double doors; 2 covered parking spaces; Garage faces front
- Utilities: City water; City sewer; Not in a municipal utility district
- Home design: Single-family residence; Residential property; One story; Property attached: Yes
- Construction: Built in 1975; Brick construction; Shingle roof; Slab foundation
- Exterior features: Lot less than 0.5 acre (about 0.202 acres); Subdivision: Colonial Hills Add; Directions: From Hwy 87, go left on Hearn St, right on Parkway Rd, right on Vicky St
Interior
- Kitchen: Dishwasher; Disposal
- Bedrooms: Primary bedroom on level 1; Total of 4 bedrooms
- Flooring: Ceramic tile flooring
- Bathrooms: 2 full bathrooms
- Heating & cooling: Central heating; Central air; Ceiling fan(s)
- Interior features: Decorative lighting; One living area; One dining area; 2 total rooms (as listed)
- Laundry & utility: Dryer
Neighborhood map
What this means for you Summary
Snapshot
- This is a 4-bed/2.0-bath single-family listed at $155k.
Deal economics
- At list price, monthly cash flow is $250 ($3k/yr) — positive.
- The deal already cash-flows at list — no discount required.
- Meets the 1% rule at list price ($2k rent vs $155k).
- Recommended offer: $153k (1.5% below list) — sets the bar for market timing.
Location & tenants
- Location reads 62/100 on livability (#948 in TX) — a middle-class / working-renter tenant base. Strengths: cost of living A+, housing A+, health & safety A+; Watch: employment C-, schools F, crime F.
- Big Spring ISD (town): math 29% / reading 30% proficiency, ranked #641 of 826 in TX (top 78%) — low school quality limits family demand, transient renter base, plan for 1-2y turnover; 63% free/reduced lunch — lower-income household profile, screen leases tightly.
- Market conditions: 266 active listings in the ZIP; 1 comparable units currently listed for rent nearby; 69 units permitted in Howard County in 2024 (5 in 5+ unit buildings).
- This rent runs 31% of the median local income ($69k/yr) — at the standard rent-burdened threshold; future hikes will face affordability resistance.
Forward outlook
- Local home prices are declining (-3.0%/yr); year-one equity from $1k of loan paydown is wiped out by about $5k of value loss. Plan a longer hold.
- Howard County population projected at +42% by 2050 — long-run rental-demand tailwind backs the buy-and-hold thesis.
Negotiation context
- It's been on market 30 days — a 2% lower offer ($153k) is reasonable based on typical stale-listing flexibility.
- 2 sale attempts with the ask held roughly flat each time — persistent listings suggest the price (not the market) is what's stuck; bring a comps-based counter.
Risks & watch-outs
- Climate carrying-cost: severe wildfire risk; extreme-heat days projected 6→19/yr by 2055 (HVAC capex compounding) — expect insurance premiums to compound above CPI over the hold.
Questions for the listing agent
- Built in 1975 — when were the roof, HVAC, electrical panel, plumbing, and water heater last replaced?
- Is there a deadline driving the sale (1031 exchange, divorce, estate, relocation)? That informs how much negotiation room exists.
- Schools are F-rated, which usually means shorter tenancies and higher turnover. Who's the typical renter profile here, and what's been the actual vacancy rate?
- Crime grade is F in this area — have there been break-ins, vandalism, or insurance claims at this property in the last 3 years? What carrier currently insures it and at what premium?
- What's the average days-on-market for RENTAL listings here right now (not sales)? A rising rental-DOM trend means longer vacancies and softer asking-rent achievability than the comps imply.
- What's the recent tenant-quality profile in this submarket — average credit score on applications, eviction rate, late-payment / NSF rate, and stable-employment percentage? A property-management company in the area should have these aggregated.
- How much new for-sale + rental construction is in the pipeline within 1–3 miles? Heavy new supply typically softens prices + rents 12–24 months out; constrained supply supports both.
Investment metrics
- 1% rule
- 1.14% ✓
- Cap rate
- 8.23%
- Cash-on-cash
- 6.92%
- DSCR
- 1.31
- GRM
- 7.3
CMA / ARV
- ARV (median comp)
- $162,152
- List price
- $155,000
- Delta
- 4.84%
- Verdict
- FAIR
- Comps
- 2 within 1.0 mi
Show comp detail 1 sale within ~0.75 mi
| Address | Dist | Beds/Ba | Sqft | Sold | Price | $/sf | Match |
|---|---|---|---|---|---|---|---|
| 4008 Vicky St | 0.03mi | 3/2.0 (-1) | 1,390 (-8%) | 5mo | $230,000 | $165 | 75 |
Match score weights: distance 35% · size 25% · config 20% · recency 20%. Top-matched comps best support the ARV.
Projected returns pro-forma
-3.0% appreciation · 3.0% rent growth · sell at horizon
- IRR
- -5.6%
- Equity multiple
- 0.79×
- Total profit
- $-9,100
- Equity at exit
- $23,111
- IRR
- 4.1%
- Equity multiple
- 1.30×
- Total profit
- $12,895
- Equity at exit
- $13,402
Cash invested: $43,400 (down + closing). Projections, not guarantees.
Landlord ↔ Tenant lean methodology
- Overall (STATE)
- 87 Strongly Landlord-Friendly
- State Texas
- 87 Strongly Landlord-Friendly · R+5
- County
- — inherits STATE
- City
- — inherits STATE
ZIP-level market 79720
- Active inventory
- 266
- Price-to-rent
- 7.3×
Monthly cashflow live
- Estimated rent
- $1,763 medium interval (Pro) →
- Mortgage (P&I)
- −$813
- Tax from tax record
- −$265 /mo · $3,183/yr
- Insurance
- −$65
- HOA
- −$0
- Vacancy / Maint / Mgmt
- −$370
- Net cashflow
- $250
Break-even live
UW: 25.0% down · 7.5% · 30yr · 1.5% tax · 5.0% vac · 8.0% maint · 8.0% mgmt
Financing live
Cash to close
- Down payment
- $38,750
- Closing costs
- $4,650
- Reserves months
- —
- Total cash needed
- —
Loan-product check · same deal, 3 products live
Conventional
25% down · 7.5% · 30yr
- Down + closing
- —
- Monthly P&I
- —
- Monthly cashflow
- —
- DSCR
- —
- Eligible?
- —
Personal DTI + credit; lowest rate.
DSCR
20% down · 8.5% · 30yr
- Down + closing
- —
- Monthly P&I
- —
- Monthly cashflow
- —
- DSCR
- —
- Eligible?
- —
No personal income docs; deal must DSCR.
Hard money
10% down · 12.0% · 12mo
- Down + closing
- —
- Monthly P&I
- —
- Monthly cashflow
- —
- DSCR
- —
- Eligible?
- —
Short-term bridge; refi at stabilization.
Rent comps 1 comps
| Address | Beds | Baths | Sqft | Rent | $/sqft | DOM | Units | Dist |
|---|---|---|---|---|---|---|---|---|
| 3304 West St Big Spring, TX | 3.0 | 1.0 | 1520 | $1,119 | $0.74 | 3d | 1 | 0.87mi |
Listing history 24 events
-
2026-06-19days on market $155,000 Active 30 DOM
-
2026-06-18days on market $155,000 Active 29 DOM
-
2026-06-17days on market $155,000 Active 28 DOM
-
2026-06-16days on market $155,000 Active 27 DOM
-
2026-06-15days on market $155,000 Active 26 DOM
-
2026-06-14days on market $155,000 Active 24 DOM
-
2026-06-12days on market $155,000 Active 23 DOM
-
2026-06-09days on market $155,000 Active 20 DOM
-
2026-06-08days on market $155,000 Active 19 DOM
-
2026-06-07days on market $155,000 Active 18 DOM
-
2026-06-05days on market $155,000 Active 15 DOM
-
2026-06-02days on market $155,000 Active 13 DOM
-
2026-06-01days on market $155,000 Active 12 DOM
-
2026-05-31days on market $155,000 Active 11 DOM
-
2026-05-30days on market $155,000 Active 10 DOM
-
2026-05-17historical
-
2026-05-11price $155,000
-
2026-04-24price $170,000
-
2026-04-15price $174,000
-
2026-04-09price $180,000
-
2026-03-31price $184,000
-
2026-03-26price $199,000
-
2026-03-17$220,000 Active
-
2006-01-31soldstatus
ⓘ Source: listings_history table (triggers on properties + properties_extension) + one-shot
backfill from property_details.listing_events for pre-trigger history.
Tax reassessment forecast TX · Resets to sale price
- Current annual tax
- $3,183 · $265/mo
- Projected year-2 tax
- $3,183 · $265/mo
- Expected delta
- $0/yr ($0/mo · 0.0%)
ⓘ Screening estimate from a state-policy table — verify with the county assessor before closing.
Climate risk First Street
- Flood 1/10 Low FEMA zone X (unshaded) · 0% chance over 30 yrs
- Wildfire 10/10 Extreme
- Heat 6/10 Major 6 d/yr ≥102°F today · 19 d/yr by 30 yrs out
- Wind 2/10 Low 4% chance of damaging wind over 30 yrs
- Air quality 1/10 Low 0 unhealthy d/yr today · 0 by 30 yrs out
Nearby sold comps map
Loading sold comps map…
Walkable amenities ~0.75 mi
Loading nearby amenities…
Taxation est. · year 1
- Rental income
- $21,160
- − Mortgage interest
- −$8,682
- − Property taxes
- −$3,183
- − Insurance
- −$775
- − Repairs & maintenance
- −$1,693
- − Management
- −$1,693
- − Depreciation
- −$4,509
- Taxable income
- $625
- Est. tax owed @ 24.0%
- −$150
- After-tax cash flow
- $2,854/yr
For passive investors: Depreciation is non-cash, so a rental often shows a tax loss while cash-flowing — sheltering income. Rental losses are passive: they offset passive income freely, and up to $25,000/yr can offset ordinary (W-2) income if you actively participate and your MAGI is under $100k (phasing out to $0 by $150k); unused losses carry forward. On sale, claimed depreciation is recaptured at up to 25%, and gains may owe capital-gains tax (a 1031 exchange can defer both). Figures are a year-1 estimate at your 24.0% rate — not tax advice; consult a CPA.
Schools (NCES district)
- District
- Big Spring ISD
- NCES district ID
- 4810200
- Math proficiency
- 29% ▼ -1.00%
- Reading proficiency
- 30% ▲ 4.00%
- Median HH income
- $42,916
- Composite
- 25.11/100
- National rank
- #7529
- State rank
- #641 of 826 in TX
Livability — Big Spring
- Score
- 62/100
- State rank
- #948
- US rank
- #16886
Category grades
Schools grade is shown separately in the Schools card above.
Census & demographics
- Census place
- Big Spring, TX
- County
- Howard County · 29,936 people
- City population
- 29,936
- Metro
- Big Spring, TX
- Population (ZIP)
- 29,936
- Household income
- $68,785
- Rent vs Own
- Severe rent burden
- 638.0
Population outlook (Howard County) Hauer SSP2
- Today (2025)
- 43,396 people
- By 2030
- 46,792 · +7.8%
- By 2040
- 54,096 · +24.7%
- By 2050
- 61,707 · +42.2%
- By 2075
- 79,809 · +83.9%
- By 2100
- 87,385 · +101.4%
Race, ethnicity, and origin ACS 2023
- Neighborhood character
- Diverse neighborhood (Simpson 0.59)
- Race & ethnicity
- Hispanic / Latino 45% White 45% Two or more races 17% Black 5% Asian 1%
- Hispanic origin (detail)
- Mexican 37%
- Common ancestry
- Slovak 1% Italian 1% Lithuanian 1%
- Foreign-born
- 10% · Canada
- Languages at home
- 71% English-only · Spanish 28%
Political lean MEDSL · Howard
- 2024 margin
- Solid R (+62.8) · D 18.2% · R 81.1%
- 2008→2024 swing
- -16.6pp toward R · 2008: -46.3pp · 2024: -62.8pp
- All cycles
- 2024: R+62.8 2020: R+58.4 2016: R+56.0 2012: R+58.2 2008: R+46.3
Not yet ingested
- Civics
- —
Market trends
- HPI YoY
- ▼ -207.13%
- Current HPI
- 140.8159
- Rent YoY
- —
- Metro
- Big Spring, TX
- State GDP YoY
- ▲ 3.95%
- F500 in state
- 110
Industry mix (Fortune 500 HQ in TX)
| Industry | F500 HQs | Revenue |
|---|---|---|
| Energy | 16 | $1,198B |
|
||
| Technology | 5 | $198B |
|
||
| Engineering / Construction | 4 | $72B |
|
||
| Energy Services | 3 | $60B |
|
||
| Utilities | 3 | $41B |
|
||
| Healthcare | 2 | $330B |
|
||
Price history
-29.5% since first listed10 events — show timeline
- 2026-05-20 Listed $155,000 NTREIS
- 2026-05-17 Listing Removed — NTREIS
- 2026-05-11 Price Changed $155,000 NTREIS
- 2026-04-24 Price Changed $170,000 NTREIS
- 2026-04-15 Price Changed $174,000 NTREIS
- 2026-04-09 Price Changed $180,000 NTREIS
- 2026-03-31 Price Changed $184,000 NTREIS
- 2026-03-26 Price Changed $199,000 NTREIS
- 2026-03-17 Listed $220,000 NTREIS
- 2006-01-31 Sold (Public Records) — Public Records
Property tax history
+0.0%/yrLatest (2025): $3,183 · +8.1% YoY. Source: county tax records.
Cash-flow waterfall
monthlySold comps — $/sqft
last 12 mo · ≤1 miLoading sold comps…