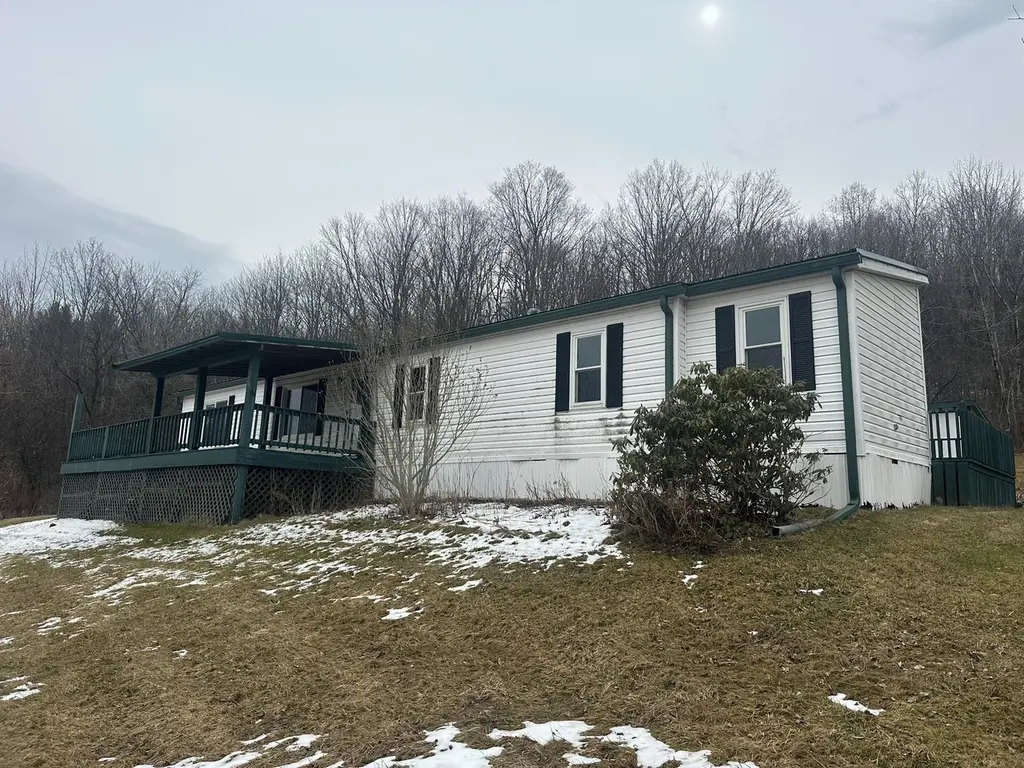
33 Barnes Rd · Windsor, NY
Flood risk 1/10 · Minimal
- FEMA flood zone
- X
- Chance of flooding over 30 yrs
- 0.0%
- Est. flood insurance / yr
- $507 – $1,088
Fire risk 1/10 · Minimal
- Est. fire insurance / yr
- $691 – $1,283
Heat risk 2/10 · Minimal
- Hot days now (above 91°F)
- 7 days/yr
- Hot days in 30 yrs
- 16 days/yr
Wind risk 2/10 · Minimal
- Chance of severe wind over 30 yrs
- 1.0%
Air-quality risk 2/10 · Minimal
- Unhealthy air days now
- 0 days/yr
- Unhealthy air days in 30 yrs
- 1 days/yr
Risk factors via First Street. Map © Google.
Why this score? — see what drove the B grade
The composite is a weighted blend of 9 inputs, each scored 0–100. Each bar is that input's sub-score; the figure is the points it added to the 100-point composite (weight × sub-score).
- Cash flow +30.0/30.0
- 1% rule +10.0/10.0
- DSCR +10.0/10.0
- ARV discount +7.5/15.0
- Schools +5.2/10.0
- Livability +3.4/5.0
- Rent growth +2.5/5.0
- Condition / age +2.5/5.0
- Appreciation +1.2/10.0
$71,000
🖨 Deal sheet (PDF) 📄 Offer letter ✓ Due diligence
Listing remarks MLS
Set against a backdrop of beautiful, peaceful views, this double-wide offers a unique opportunity for the right buyer to create something truly special. The home itself is in need of repair, but the location and scenery provide the perfect canvas for renovation or redevelopment. Imagine transforming this property into a place where the views become the highlight of everyday living. With vision and effort, this could be something truly rewarding.
Key facts
- 1.88 acre lot
- Built 1988
- Listed 90 days
Neighborhood map
What this means for you Summary
Snapshot
- This is a 3-bed/2.0-bath single-family listed at $71k.
Deal economics
- At list price, monthly cash flow is $422 ($5k/yr) — positive.
- The deal already cash-flows at list — no discount required.
- Meets the 1% rule at list price ($1k rent vs $71k).
- Recommended offer: $65k (9.0% below list) — sets the bar for market timing.
Location & tenants
- Location reads 68/100 on livability (#513 in NY) — a middle-class / working-renter tenant base. Strengths: cost of living A+, housing A+, crime A; Watch: amenities F, commute F, health & safety D-.
- Windsor Central School District (rural): math 58% / reading 63% proficiency, ranked #236 of 590 in NY (top 40%) — acceptable for families but not a draw, mixed tenant base, ~2y average lease.
- Market conditions: 42 active listings in the ZIP; 340 units permitted in Broome County in 2024 (269 in 5+ unit buildings).
Forward outlook
- Local home prices are declining (-3.0%/yr); year-one equity from $491 of loan paydown is wiped out by about $2k of value loss. Plan a longer hold.
- Broome County population projected at -13% by 2050 — secular population decline; favor cash flow + early exit over multi-decade hold.
- At projected returns (-3.0% appreciation + 3.0% rent growth), your $20k cash investment doubles in ~5 years — after that, you're playing with house money.
Negotiation context
- It's been on market 91 days — a 9% lower offer ($65k) is reasonable based on typical stale-listing flexibility.
Risks & watch-outs
- Watch-outs: property tax is 2.7% of price.
Questions for the listing agent
- It's been on market 91 days. Have you received any prior offers? Is the seller open to a 9% concession, seller financing, or rate buy-down credit?
- Property tax is high relative to price — has the assessment been appealed recently, and will the sale trigger a re-assessment?
- Why hasn't it sold? Are there any deal-killer items the seller is aware of (foundation, flood, title, zoning, code violations)?
- Is there a deadline driving the sale (1031 exchange, divorce, estate, relocation)? That informs how much negotiation room exists.
- Schools are B-rated — typically a magnet for longer-tenancy family renters. What's the average tenant stay here, and is there a school-zone premium baked into asking?
- What's the average days-on-market for RENTAL listings here right now (not sales)? A rising rental-DOM trend means longer vacancies and softer asking-rent achievability than the comps imply.
- What's the recent tenant-quality profile in this submarket — average credit score on applications, eviction rate, late-payment / NSF rate, and stable-employment percentage? A property-management company in the area should have these aggregated.
- How much new for-sale + rental construction is in the pipeline within 1–3 miles? Heavy new supply typically softens prices + rents 12–24 months out; constrained supply supports both.
Investment metrics
- 1% rule
- 1.75% ✓
- Cap rate
- 13.43%
- Cash-on-cash
- 25.50%
- DSCR
- 2.13
- GRM
- 4.8
CMA / ARV
- ARV (on-the-fly)
- $257,280
- Comps found
- 1
Show comp detail 1 sale within ~0.75 mi
| Address | Dist | Beds/Ba | Sqft | Sold | Price | $/sf | Match |
|---|---|---|---|---|---|---|---|
| 515 Hoadley Hill Rd | 0.25mi | 3/2.0 | 1,528 (-5%) | 9mo | $245,000 | $160 | 73 |
Match score weights: distance 35% · size 25% · config 20% · recency 20%. Top-matched comps best support the ARV.
Projected returns pro-forma
-3.0% appreciation · 3.0% rent growth · sell at horizon
- IRR
- 19.1%
- Equity multiple
- 1.78×
- Total profit
- $15,462
- Equity at exit
- $10,586
- IRR
- 27.5%
- Equity multiple
- 3.43×
- Total profit
- $48,362
- Equity at exit
- $6,139
Cash invested: $19,880 (down + closing). Projections, not guarantees.
Landlord ↔ Tenant lean methodology
- Overall (STATE)
- 15 Strongly Tenant-Friendly
- State New York
- 15 Strongly Tenant-Friendly · D+10
- County
- — inherits STATE
- City
- — inherits STATE
ZIP-level market 13865
- Home prices YoY
- -2.5%
- Active inventory
- 42
- Price-to-rent
- 4.8×
Monthly cashflow live
- Estimated rent
- $1,245 medium interval (Pro) →
- Mortgage (P&I)
- −$372
- Tax from tax record
- −$159 /mo · $1,912/yr
- Insurance
- −$30
- HOA
- −$0
- Vacancy / Maint / Mgmt
- −$261
- Net cashflow
- $422
Break-even live
Sensitivity live
| Price | -10% $463 | -5% $443 | +0% $422 | +5% $402 | +10% $382 |
|---|---|---|---|---|---|
| Rent | -10% $324 | -5% $373 | +0% $422 | +5% $472 | +10% $521 |
| Rate | -1.0pp $458 | -0.5pp $440 | base $422 | +0.5pp $404 | +1.0pp $385 |
UW: 25.0% down · 7.5% · 30yr · 1.5% tax · 5.0% vac · 8.0% maint · 8.0% mgmt
Financing live
Cash to close
- Down payment
- $17,750
- Closing costs
- $2,130
- Reserves months
- —
- Total cash needed
- —
Loan-product check · same deal, 3 products live
Conventional
25% down · 7.5% · 30yr
- Down + closing
- —
- Monthly P&I
- —
- Monthly cashflow
- —
- DSCR
- —
- Eligible?
- —
Personal DTI + credit; lowest rate.
DSCR
20% down · 8.5% · 30yr
- Down + closing
- —
- Monthly P&I
- —
- Monthly cashflow
- —
- DSCR
- —
- Eligible?
- —
No personal income docs; deal must DSCR.
Hard money
10% down · 12.0% · 12mo
- Down + closing
- —
- Monthly P&I
- —
- Monthly cashflow
- —
- DSCR
- —
- Eligible?
- —
Short-term bridge; refi at stabilization.
Listing history 21 events
-
2026-06-19days on market $71,000 Active 91 DOM
-
2026-06-18days on market $71,000 Active 90 DOM
-
2026-06-17days on market $71,000 Active 89 DOM
-
2026-06-16days on market $71,000 Active 88 DOM
-
2026-06-15price $71,000 Active 87 DOM
-
2026-06-15days on market $81,000 Active 87 DOM
-
2026-06-14days on market $81,000 Active 85 DOM
-
2026-06-13days on market $81,000 Active 84 DOM
-
2026-06-10days on market $81,000 Active 82 DOM
-
2026-06-09days on market $81,000 Active 81 DOM
-
2026-06-08days on market $81,000 Active 80 DOM
-
2026-06-07days on market $81,000 Active 79 DOM
-
2026-06-03days on market $81,000 Active 75 DOM
-
2026-06-02days on market $81,000 Active 74 DOM
-
2026-06-01days on market $81,000 Active 73 DOM
-
2026-05-31days on market $81,000 Active 72 DOM
-
2026-05-30days on market $81,000 Active 71 DOM
-
2026-04-22price $81,000 449-char remark
Show marketing remark (449 chars)
Set against a backdrop of beautiful, peaceful views, this double-wide offers a unique opportunity for the right buyer to create something truly special. The home itself is in need of repair, but the location and scenery provide the perfect canvas for renovation or redevelopment. Imagine transforming this property into a place where the views become the highlight of everyday living. With vision and effort, this could be something truly rewarding.
-
2026-03-20$86,000 Active 449-char remark
Show marketing remark (449 chars)
Set against a backdrop of beautiful, peaceful views, this double-wide offers a unique opportunity for the right buyer to create something truly special. The home itself is in need of repair, but the location and scenery provide the perfect canvas for renovation or redevelopment. Imagine transforming this property into a place where the views become the highlight of everyday living. With vision and effort, this could be something truly rewarding.
-
2007-10-12soldstatus $95,000
-
2000-06-29soldstatus $55,500
ⓘ Source: listings_history table (triggers on properties + properties_extension) + one-shot
backfill from property_details.listing_events for pre-trigger history.
Tax reassessment forecast NY · Partial reset (capped growth)
- Current annual tax
- $1,912 · $159/mo
- Projected year-2 tax
- $1,912 · $159/mo
- Expected delta
- $0/yr ($0/mo · 0.0%)
ⓘ Screening estimate from a state-policy table — verify with the county assessor before closing.
Climate risk First Street
- Flood 1/10 Low FEMA zone X · 0% chance over 30 yrs
- Wildfire 1/10 Low
- Heat 2/10 Low 7 d/yr ≥91°F today · 16 d/yr by 30 yrs out
- Wind 2/10 Low 100% chance of damaging wind over 30 yrs
- Air quality 2/10 Low 0 unhealthy d/yr today · 1 by 30 yrs out
Nearby sold comps map
Loading sold comps map…
Walkable amenities ~0.75 mi
Loading nearby amenities…
Taxation est. · year 1
- Rental income
- $14,942
- − Mortgage interest
- −$3,977
- − Property taxes
- −$1,912
- − Insurance
- −$355
- − Repairs & maintenance
- −$1,195
- − Management
- −$1,195
- − Depreciation
- −$2,065
- Taxable income
- $4,242
- Est. tax owed @ 24.0%
- −$1,018
- After-tax cash flow
- $4,051/yr
For passive investors: Depreciation is non-cash, so a rental often shows a tax loss while cash-flowing — sheltering income. Rental losses are passive: they offset passive income freely, and up to $25,000/yr can offset ordinary (W-2) income if you actively participate and your MAGI is under $100k (phasing out to $0 by $150k); unused losses carry forward. On sale, claimed depreciation is recaptured at up to 25%, and gains may owe capital-gains tax (a 1031 exchange can defer both). Figures are a year-1 estimate at your 24.0% rate — not tax advice; consult a CPA.
Schools (NCES district)
- District
- Windsor Central School District
- NCES district ID
- 3602730
- Math proficiency
- 58% ▼ -8.00%
- Reading proficiency
- 63% ▲ 4.00%
- Median HH income
- $51,341
- Composite
- 51.6/100
- National rank
- #1707
- State rank
- #236 of 590 in NY
Livability — Windsor
- Score
- 68/100
- State rank
- #513
- US rank
- #9132
Category grades
Schools grade is shown separately in the Schools card above.
Census & demographics
- Population (ZIP)
- 5,823
Population outlook (Broome County) Hauer SSP2
- Today (2025)
- 187,989 people
- By 2030
- 183,066 · -2.6%
- By 2040
- 172,228 · -8.4%
- By 2050
- 163,161 · -13.2%
- By 2075
- 153,641 · -18.3%
- By 2100
- 140,851 · -25.1%
Race, ethnicity, and origin ACS 2023
- Neighborhood character
- Predominantly White (94%)
- Race & ethnicity
- White 94% Two or more races 4% Hispanic / Latino 1%
- Common ancestry
- Romanian 8% Iranian 6% Slovak 2%
- Foreign-born
- 1%
Political lean MEDSL · Broome
- 2024 margin
- Toss-up / Even · D 50.2% · R 49.8%
- 2008→2024 swing
- -7.6pp toward R · 2008: 8.0pp · 2024: 0.4pp
- All cycles
- 2024: D+0.4 2020: D+3.5 2016: R+3.7 2012: D+4.6 2008: D+8.0
Not yet ingested
- Civics
- —
Market trends
- HPI YoY
- ▼ -7.69%
- Current HPI
- 305.4236
- Rent YoY
- —
- Metro
- —
- State GDP YoY
- ▲ 2.60%
- F500 in state
- 92
Industry mix (Fortune 500 HQ in NY)
| Industry | F500 HQs | Revenue |
|---|---|---|
| Financial Services | 10 | $950B |
|
||
| Consumer Goods | 9 | $162B |
|
||
| Insurance | 4 | $225B |
|
||
| Telecommunications | 2 | $144B |
|
||
| Pharmaceuticals | 2 | $112B |
|
||
| Media / Entertainment | 2 | $69B |
|
||
Price history
+45.9% since first listed4 events — show timeline
- 2026-04-22 Price Changed $81,000 GBAOR
- 2026-03-20 Listed $86,000 GBAOR
- 2007-10-12 Sold (Public Records) $95,000 Public Records
- 2000-06-29 Sold (Public Records) $55,500 Public Records
Property tax history
+2.4%/yrLatest (2025): $1,912 · -18.0% YoY. Source: county tax records.
Cash-flow waterfall
monthlySold comps — $/sqft
last 12 mo · ≤1 miLoading sold comps…