 9-Plex
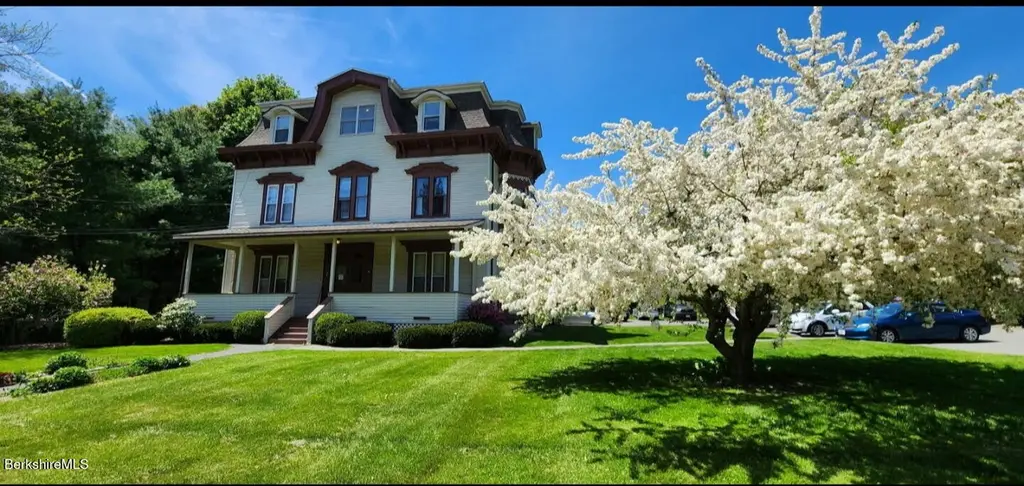
465 Chapel St · Lee, MA
Flood risk 6/10 · Moderate
- FEMA flood zone
- X
- Chance of flooding over 30 yrs
- 0.7%
- Est. flood insurance / yr
- $507 – $1,088
Fire risk 3/10 · Minor
- Est. fire insurance / yr
- $915 – $1,699
Heat risk 3/10 · Minor
- Hot days now (above 91°F)
- 7 days/yr
- Hot days in 30 yrs
- 17 days/yr
Wind risk 4/10 · Minor
- Chance of severe wind over 30 yrs
- 12.0%
Air-quality risk 2/10 · Minimal
- Unhealthy air days now
- 1 days/yr
- Unhealthy air days in 30 yrs
- 1 days/yr
Risk factors via First Street. Map © Google.
Why this score? — see what drove the B- grade
The composite is a weighted blend of 9 inputs, each scored 0–100. Each bar is that input's sub-score; the figure is the points it added to the 100-point composite (weight × sub-score).
- Cash flow +26.6/30.0
- DSCR +9.1/10.0
- ARV discount +7.5/15.0
- 1% rule +6.4/10.0
- Appreciation +5.1/10.0
- Livability +3.7/5.0
- Schools +3.4/10.0
- Rent growth +2.5/5.0
- Condition / age +2.5/5.0
$995,000
🖨 Deal sheet 📄 Offer letter ✓ Due diligence
Multi-family units
County records classify this as Multi-Family (5+ Unit). Listing-text estimate: 9 units. confirmed
5+ unit building — per-unit beds/baths from public records are typically unavailable; the breakdown below (if shown) is an estimate from the listing text.
Listing remarks MLS
Beautiful 9 unit Victorian on 2.5 acres, a mix of studios and 1 bedroom apartments with open kitchens. Fully occupied with coin operated laundry, plenty of off street parking. Newer Natural Gas furnace and hot water tank, new roof, new paved parking lot, mostly new kitchens and baths. Rental income over $85,000/year.
Key facts
- Diverse tenant base
- Income producing
- Fully occupied
Tags
Property features AI
Finance
- Financial info: Annual property tax information available
Exterior
- Utilities: Public sewer
- Home design: Multi-unit building (building area about 5,690 sq ft)
- Construction: Asphalt roof
- Exterior features: Private trash service; On-site outbuilding
Interior
- Bedrooms: Some units include 2-bedroom layouts
- Flooring: Wood; Linoleum
- Bathrooms: Multiple bathrooms: total of 9 full bathrooms in the building
- Heating & cooling: Natural gas heating
- Interior features: Wood and linoleum flooring; Has heating (natural gas)
- Laundry & utility: Coin-operated laundry
Neighborhood map
What this means for you Summary
Snapshot
- This is a 8×1bd/1ba + 1×2bd/1ba units multifamily listed at $995k.
Deal economics
- At list price, monthly cash flow is $3k ($32k/yr) — positive. Per door: $295/mo.
- The deal already cash-flows at list — no discount required.
- Meets the 1% rule at list price ($11k rent vs $995k).
- Recommended offer: $980k (1.5% below list) — sets the bar for market timing.
Location & tenants
- Location reads 74/100 on livability (#88 in MA, #4,582 nationally) — a middle-class / working-renter tenant base. Strengths: housing A+, health & safety A+, crime B+; Watch: cost of living C-, amenities F.
- Lee (town): math 31% / reading 47% proficiency, ranked #211 of 302 in MA (top 70%) — families likely to look elsewhere, expect single-tenant / working-renter base with shorter leases.
- Zoned schools: Lee Elementary (math 27% / reading 42%, grade F, #577 of 938 statewide, top 65%, 341 students, 0% FRL); Lee Middle/High School (math 37% / reading 57%, grade D-, #194 of 343 statewide, top 57%, 325 students, 0% FRL) — zoned schools average 0% FRL vs 28% district-wide (28 pts lower); this property's tenant base skews higher-income than the district average.
- Market conditions: 39 active listings in the ZIP; 130 units permitted in Berkshire County in 2024 (10 in 5+ unit buildings).
Forward outlook
- In year one you build about $8k of equity ($7k loan paydown + $1k appreciation (0.1% local appreciation)).
- Berkshire County population projected at -24% by 2050 — secular population decline; favor cash flow + early exit over multi-decade hold.
- At projected returns (0.1% appreciation + 3.0% rent growth), your $279k cash investment doubles in ~6 years — after that, you're playing with house money.
- By year 6, paydown + projected appreciation supports a ~$57k cash-out refi (75% LTV) — recoverable capital for the next deal without selling this one.
Negotiation context
- It's been on market 30 days — a 2% lower offer ($980k) is reasonable based on typical stale-listing flexibility.
- 6 sale attempts since 25y ago with the ask held roughly flat each time — persistent listings suggest the price (not the market) is what's stuck; bring a comps-based counter.
- Current owner paid $575k; list at $995k implies a 73% gain — meaningful room to come down on a strong offer.
Risks & watch-outs
- Watch-outs: built in 1880 — expect roof / HVAC / electrical / plumbing capex.
- Climate carrying-cost: major flood risk — expect insurance premiums to compound above CPI over the hold.
Questions for the listing agent
- Can we see the unit-by-unit rent roll, current vacancy, and any below-market leases? What's the average tenancy length?
- What capital expenditures (roof, boiler, parking lot, exteriors) have been made in the last 5 years, and what's planned in the next 2?
- Built in 1880 — when were the roof, HVAC, electrical panel, plumbing, and water heater last replaced?
- Is there a deadline driving the sale (1031 exchange, divorce, estate, relocation)? That informs how much negotiation room exists.
- What's the average days-on-market for RENTAL listings here right now (not sales)? A rising rental-DOM trend means longer vacancies and softer asking-rent achievability than the comps imply.
- What's the recent tenant-quality profile in this submarket — average credit score on applications, eviction rate, late-payment / NSF rate, and stable-employment percentage? A property-management company in the area should have these aggregated.
- How much new apartment / multifamily construction is in the pipeline within 1–3 miles? Heavy new supply (>2% of stock underway) typically softens rents 12–24 months out; light construction supports rent growth.
Investment metrics
- 1% rule
- 1.14% ✓
- Cap rate
- 9.49%
- Cash-on-cash
- 11.43%
- DSCR
- 1.51
- GRM
- 7.3
CMA / ARV
No comps found within radius.
Projected returns pro-forma
0.15% appreciation · 3.0% rent growth · sell at horizon
- IRR
- 10.9%
- Equity multiple
- 1.53×
- Total profit
- $146,539
- Equity at exit
- $296,202
- IRR
- 15.6%
- Equity multiple
- 2.73×
- Total profit
- $482,761
- Equity at exit
- $361,915
Cash invested: $278,600 (down + closing). Projections, not guarantees.
Landlord ↔ Tenant lean methodology
- Overall (STATE)
- 20 Strongly Tenant-Friendly
- State Massachusetts
- 20 Strongly Tenant-Friendly · D+15
- County
- — inherits STATE
- City
- — inherits STATE
ZIP-level market 01238
- Home prices YoY
- 0.1%
- Active inventory
- 39
- Price-to-rent
- 66.4×
Monthly cashflow live
- Estimated rent
- $11,329 medium interval (Pro) →
- Mortgage (P&I)
- −$5,218
- Tax from tax record
- −$664 /mo · $7,971/yr
- Insurance
- −$415
- HOA
- −$0
- Vacancy / Maint / Mgmt
- −$2,379
- Net cashflow
- $2,653
Break-even live
9-unit breakdown (identical units grouped — click to expand)
| Units | Beds | Baths | Est. rent |
|---|---|---|---|
| 8× units | 1 | 1 | $9,984 |
| #1 | 1 | 1 | $1,248 |
| #2 | 1 | 1 | $1,248 |
| #3 | 1 | 1 | $1,248 |
| #4 | 1 | 1 | $1,248 |
| #5 | 1 | 1 | $1,248 |
| #6 | 1 | 1 | $1,248 |
| #7 | 1 | 1 | $1,248 |
| #8 | 1 | 1 | $1,248 |
| 1× unit | 2 | 1 | $1,342 |
| Total (9 units) | $11,329 | ||
UW: 25.0% down · 7.5% · 30yr · 1.5% tax · 5.0% vac · 8.0% maint · 8.0% mgmt
Financing live
Cash to close
- Down payment
- $248,750
- Closing costs
- $29,850
- Reserves months
- —
- Total cash needed
- —
Loan-product check · same deal, 3 products live
Conventional
25% down · 7.5% · 30yr
- Down + closing
- —
- Monthly P&I
- —
- Monthly cashflow
- —
- DSCR
- —
- Eligible?
- —
Personal DTI + credit; lowest rate.
DSCR
20% down · 8.5% · 30yr
- Down + closing
- —
- Monthly P&I
- —
- Monthly cashflow
- —
- DSCR
- —
- Eligible?
- —
No personal income docs; deal must DSCR.
Hard money
10% down · 12.0% · 12mo
- Down + closing
- —
- Monthly P&I
- —
- Monthly cashflow
- —
- DSCR
- —
- Eligible?
- —
Short-term bridge; refi at stabilization.
Listing history 28 events
-
2026-06-18days on market $995,000 Active 30 DOM
-
2026-06-17days on market $995,000 Active 29 DOM
-
2026-06-16days on market $995,000 Active 28 DOM
-
2026-06-15days on market $995,000 Active 27 DOM
-
2026-06-13days on market $995,000 Active 25 DOM
-
2026-06-12days on market $995,000 Active 24 DOM
-
2026-06-09days on market $995,000 Active 21 DOM
-
2026-06-08days on market $995,000 Active 20 DOM
-
2026-06-07days on market $995,000 Active 19 DOM
-
2026-06-07days on market $995,000 Active 18 DOM
-
2026-06-04days on market $995,000 Active 15 DOM
-
2026-06-02days on market $995,000 Active 14 DOM
-
2026-06-01days on market $995,000 Active 13 DOM
-
2026-05-31days on market $995,000 Active 12 DOM
-
2026-05-31days on market $995,000 Active 11 DOM
-
2026-05-09$995,000 Active
-
2025-09-01historical
-
2025-02-28$1,125,000 Active
-
2014-07-31soldstatus $575,000 318-char remark
Show marketing remark (318 chars)
Beautiful 9 unit Victorian on 2.5 acres, a mix of studios and 1 bedroom apartments with open kitchens. Fully occupied with coin operated laundry, plenty of off street parking. Newer Natural Gas furnace and hot water tank, new roof, new paved parking lot, mostly new kitchens and baths. Rental income over $85,000/year.
-
2014-04-15$635,000 318-char remark
Show marketing remark (318 chars)
Beautiful 9 unit Victorian on 2.5 acres, a mix of studios and 1 bedroom apartments with open kitchens. Fully occupied with coin operated laundry, plenty of off street parking. Newer Natural Gas furnace and hot water tank, new roof, new paved parking lot, mostly new kitchens and baths. Rental income over $85,000/year.
-
2014-04-03historical
-
2013-04-03$650,000
-
2003-05-23soldstatus $447,000
-
2003-05-23soldstatus $447,000
-
2002-05-13$499,000
-
2002-03-02historical
-
2001-03-02$530,000
-
1989-05-16soldstatus $166,500
ⓘ Source: listings_history table (triggers on properties + properties_extension) + one-shot
backfill from property_details.listing_events for pre-trigger history.
Tax reassessment forecast MA · Partial reset (capped growth)
- Current annual tax
- $7,971 · $664/mo
- Projected year-2 tax
- $10,105 · $842/mo
- Expected delta
- +$2,134/yr (+$178/mo · 26.8%)
ⓘ Screening estimate from a state-policy table — verify with the county assessor before closing.
Climate risk First Street
- Flood 6/10 Major FEMA zone X · 70% chance over 30 yrs
- Wildfire 3/10 Moderate
- Heat 3/10 Moderate 7 d/yr ≥91°F today · 17 d/yr by 30 yrs out
- Wind 4/10 Moderate 12% chance of damaging wind over 30 yrs
- Air quality 2/10 Low 1 unhealthy d/yr today · 1 by 30 yrs out
Nearby sold comps map
Loading sold comps map…
Walkable amenities ~0.75 mi
Loading nearby amenities…
Taxation est. · year 1
- Rental income
- $135,948
- − Mortgage interest
- −$55,735
- − Property taxes
- −$7,971
- − Insurance
- −$4,975
- − Repairs & maintenance
- −$10,876
- − Management
- −$10,876
- − Depreciation
- −$28,945
- Taxable income
- $16,569
- Est. tax owed @ 24.0%
- −$3,977
- After-tax cash flow
- $27,862/yr
For passive investors: Depreciation is non-cash, so a rental often shows a tax loss while cash-flowing — sheltering income. Rental losses are passive: they offset passive income freely, and up to $25,000/yr can offset ordinary (W-2) income if you actively participate and your MAGI is under $100k (phasing out to $0 by $150k); unused losses carry forward. On sale, claimed depreciation is recaptured at up to 25%, and gains may owe capital-gains tax (a 1031 exchange can defer both). Figures are a year-1 estimate at your 24.0% rate — not tax advice; consult a CPA.
Schools (NCES district)
- District
- Lee
- NCES district ID
- 2506690
- Math proficiency
- 31% ▼ -16.00%
- Reading proficiency
- 47% ▼ -5.00%
- Median HH income
- $58,112
- Composite
- 34.38/100
- National rank
- #5212
- State rank
- #211 of 302 in MA
Livability — Lee
- Score
- 74/100
- State rank
- #88
- US rank
- #4582
Category grades
Schools grade is shown separately in the Schools card above.
Census & demographics
- Population (ZIP)
- 5,893
Population outlook (Berkshire County) Hauer SSP2
- Today (2025)
- 119,723 people
- By 2030
- 114,608 · -4.3%
- By 2040
- 102,806 · -14.1%
- By 2050
- 91,305 · -23.7%
- By 2075
- 71,517 · -40.3%
- By 2100
- 57,988 · -51.6%
Race, ethnicity, and origin ACS 2023
- Neighborhood character
- Predominantly White (91%)
- Race & ethnicity
- White 91% Two or more races 4% Hispanic / Latino 3% Asian 2%
- Common ancestry
- Lithuanian 16% Romanian 6% Slovak 4%
- Foreign-born
- 7% · Canada
- Languages at home
- 94% English-only · Other Asian/Pacific 2% Spanish 2% Other Indo-European 2%
Political lean MEDSL · Berkshire
- 2024 margin
- Solid D (+39.9) · D 68.9% · R 29.0% · Other 2.1%
- 2008→2024 swing
- -12.5pp toward R · 2008: 52.4pp · 2024: 39.9pp
- All cycles
- 2024: D+39.9 2020: D+47.1 2016: D+41.5 2012: D+53.7 2008: D+52.4
Not yet ingested
- Civics
- —
Market trends
- HPI YoY
- ▲ 0.15%
- Current HPI
- 294.592
- Rent YoY
- —
- Metro
- —
- State GDP YoY
- ▲ 2.28%
- F500 in state
- 38
Industry mix (Fortune 500 HQ in MA)
| Industry | F500 HQs | Revenue |
|---|---|---|
| Technology | 3 | $17B |
|
||
| Insurance | 2 | $84B |
|
||
| Retail | 2 | $76B |
|
||
| Life Sciences | 1 | $43B |
|
||
| Energy Technology | 1 | $31B |
|
||
| Aerospace / Defense | 1 | $18B |
|
||
Price history
+497.6% since first listed13 events — show timeline
- 2026-05-09 Listed $995,000 BCMLS
- 2025-09-01 Listing Removed — BCMLS
- 2025-02-28 Listed $1,125,000 BCMLS
- 2014-07-31 Sold (MLS) $575,000 BCMLS
- 2014-04-15 Listed $635,000 BCMLS
- 2014-04-03 Listing Removed — BCMLS
- 2013-04-03 Listed $650,000 BCMLS
- 2003-05-23 Sold (Public Records) $447,000 Public Records
- 2003-05-23 Sold (MLS) $447,000 BCMLS
- 2002-05-13 Listed $499,000 BCMLS
- 2002-03-02 Listing Removed — BCMLS
- 2001-03-02 Listed $530,000 BCMLS
- 1989-05-16 Sold (Public Records) $166,500 Public Records
Property tax history
+1.3%/yrLatest (2023): $7,971 · -4.1% YoY. Source: county tax records.
Cash-flow waterfall
monthlySold comps — $/sqft
last 12 mo · ≤1 miLoading sold comps…