159A N Magnolia St · Gramercy, LA
Flood risk 1/10 · Minimal
- FEMA flood zone
- X (shaded)
- Chance of flooding over 30 yrs
- 0.0%
- Est. flood insurance / yr
- $507 – $1,088
Fire risk 1/10 · Minimal
- Est. fire insurance / yr
- $1,269 – $2,357
Heat risk 9/10 · Severe
- Hot days now (above 108°F)
- 7 days/yr
- Hot days in 30 yrs
- 22 days/yr
Wind risk 9/10 · Severe
- Chance of severe wind over 30 yrs
- 99.0%
Air-quality risk 2/10 · Minimal
- Unhealthy air days now
- 1 days/yr
- Unhealthy air days in 30 yrs
- 1 days/yr
Risk factors via First Street. Map © Google.
Why this score? — see what drove the C+ grade
The composite is a weighted blend of 9 inputs, each scored 0–100. Each bar is that input's sub-score; the figure is the points it added to the 100-point composite (weight × sub-score).
- Cash flow +23.6/30.0
- ARV discount +15.0/15.0
- DSCR +7.6/10.0
- 1% rule +6.1/10.0
- Livability +3.7/5.0
- Schools +3.1/10.0
- Condition / age +2.8/5.0
- Rent growth +2.5/5.0
- Appreciation +0.0/10.0
$103,000
🖨 Deal sheet (PDF) 📄 Offer letter ✓ Due diligence
Listing remarks MLS
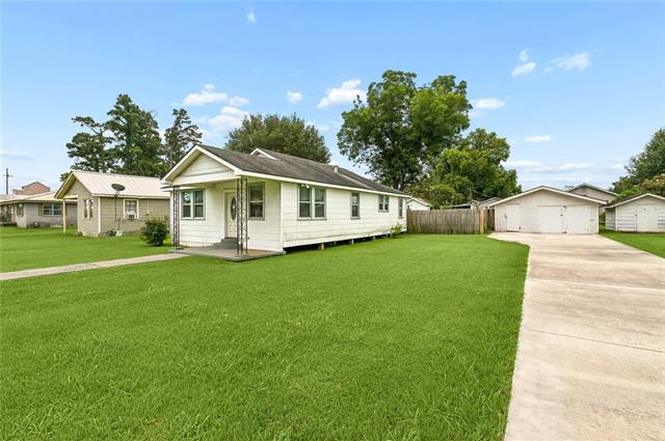
Bank-owned opportunity in Gramercy! This charming cottage-style home sits on a spacious lot and features a functional layout with generous living areas, plenty of natural light, wood-style flooring throughout much of the home, a long driveway, detached garage/storage space, and additional backyard shed. Property offers solid potential and room for updates, making it a great option for an owner-occupant or investor. No utilities will be provided by the seller/bank. Seller/bank will not pay for buyer's title policy. Conveniently located close to local amenities, schools, and River Road access.
Key facts
- Natural light
- Spacious lot
- Cottage-style home
Tags
Property features AI
Exterior
- Parking: Detached garage with two parking spaces
- Utilities: Public water; Public sewer
- Home design: Single-story home
- Construction: Shingle roof; Raised foundation
- Exterior features: City lot; Rectangular lot; Lot dimensions approximately 82 x 111
Interior
- Bathrooms: One full bathroom
- Heating & cooling: Central heating; Central air conditioning
- Interior features: Six total rooms; Average condition
Neighborhood map
What this means for you Summary
Snapshot
- This is a 3-bed/1.0-bath single-family listed at $103k. Condition is rated average.
Deal economics
- At list price, monthly cash flow is $193 ($2k/yr) — positive.
- The deal already cash-flows at list — no discount required.
- Meets the 1% rule at list price ($1k rent vs $103k).
Location & tenants
- Location reads 73/100 on livability (#32 in LA) — a middle-class / working-renter tenant base. Strengths: cost of living A+, housing A+, crime B+; Watch: amenities F, commute F.
- St. James Parish (town): math 31% / reading 41% proficiency, ranked #30 of 98 in LA (top 31%) — families likely to look elsewhere, expect single-tenant / working-renter base with shorter leases; 67% free/reduced lunch — lower-income household profile, screen leases tightly.
- Zoned schools: Gramercy Elementary School (math 31% / reading 37%, grade F, #95 of 218 statewide, top 45%, 410 students, 52% FRL); Lutcher High School (math 35% / reading 48%, grade F, #71 of 265 statewide, top 27%, 1,043 students, 44% FRL) — zoned schools average 48% FRL vs 67% district-wide (18 pts lower); this property's tenant base skews higher-income than the district average.
- Market conditions: 20 active listings in the ZIP; 64 units permitted in St. James Parish in 2024 (0 in 5+ unit buildings).
Forward outlook
- Local home prices are declining (-3.0%/yr); year-one equity from $712 of loan paydown is wiped out by about $3k of value loss. Plan a longer hold.
- St. James County population projected at -20% by 2050 — secular population decline; favor cash flow + early exit over multi-decade hold.
Negotiation context
- Only 3 days on market — expect competitive offers; lowballing is unlikely to land.
- 2 sale attempts with the ask held roughly flat each time — persistent listings suggest the price (not the market) is what's stuck; bring a comps-based counter.
Risks & watch-outs
- Watch-outs: built in 1950 — expect roof / HVAC / electrical / plumbing capex.
- Climate carrying-cost: severe wind risk, 99% chance of damaging wind over 30y; extreme-heat days projected 7→22/yr by 2055 (HVAC capex compounding) — expect insurance premiums to compound above CPI over the hold.
Questions for the listing agent
- Built in 1950 — when were the roof, HVAC, electrical panel, plumbing, and water heater last replaced?
- Is there a deadline driving the sale (1031 exchange, divorce, estate, relocation)? That informs how much negotiation room exists.
- Schools are B-rated — typically a magnet for longer-tenancy family renters. What's the average tenant stay here, and is there a school-zone premium baked into asking?
- What's the average days-on-market for RENTAL listings here right now (not sales)? A rising rental-DOM trend means longer vacancies and softer asking-rent achievability than the comps imply.
- What's the recent tenant-quality profile in this submarket — average credit score on applications, eviction rate, late-payment / NSF rate, and stable-employment percentage? A property-management company in the area should have these aggregated.
- How much new for-sale + rental construction is in the pipeline within 1–3 miles? Heavy new supply typically softens prices + rents 12–24 months out; constrained supply supports both.
Investment metrics
- 1% rule
- 1.11% ✓
- Cap rate
- 8.55%
- Cash-on-cash
- 8.05%
- DSCR
- 1.36
- GRM
- 7.5
CMA / ARV
- ARV (on-the-fly)
- $192,000
- Comps found
- 12
Show comp detail 12 sales within ~0.75 mi
| Address | Dist | Beds/Ba | Sqft | Sold | Price | $/sf | Match |
|---|---|---|---|---|---|---|---|
| 105 W Second St | 0.06mi | 3/2.0 | 1,256 (+5%) | 8mo | $225,000 | $179 | 79 |
| 108 W Second St | 0.08mi | 3/2.0 | 1,229 (+2%) | 23mo | $222,000 | $181 | 69 |
| 1875 Hymel St | 0.44mi | 3/1.0 | 1,161 (-3%) | 10mo | $186,000 | $160 | 66 |
| 177 N Airline Ave | 0.07mi | 2/2.0 (-1) | 1,354 (+13%) | 3mo | $215,000 | $159 | 64 |
| 310 N Millet Ave | 0.32mi | 3/1.5 | 1,225 (+2%) | 19mo | $197,000 | $161 | 64 |
| 1377 2nd St | 0.39mi | 3/1.0 | 1,125 (-6%) | 10mo | $190,000 | $169 | 63 |
| 320 N Airline Ave | 0.26mi | 2/1.0 (-1) | 1,165 (-3%) | 18mo | $83,000 | $71 | 63 |
| 222 S Fir St | 0.33mi | 3/2.0 | 1,338 (+12%) | 1mo | $85,000 | $64 | 61 |
| 1319 3rd St | 0.34mi | 3/2.0 | 1,241 (+3%) | 18mo | $135,000 | $109 | 59 |
| 119 Colonial Ave | 0.27mi | 3/1.0 | 1,311 (+9%) | 22mo | $55,000 | $42 | 54 |
| 1869 Hymel St | 0.44mi | 3/2.0 | 1,284 (+7%) | 14mo | $189,900 | $148 | 52 |
| 649 N Montz Ave | 0.74mi | 3/2.0 | 1,245 (+4%) | 4mo | $240,000 | $193 | 52 |
Match score weights: distance 35% · size 25% · config 20% · recency 20%. Top-matched comps best support the ARV.
Projected returns pro-forma
-3.0% appreciation · 3.0% rent growth · sell at horizon
- IRR
- -4.0%
- Equity multiple
- 0.85×
- Total profit
- $-4,357
- Equity at exit
- $15,358
- IRR
- 5.7%
- Equity multiple
- 1.42×
- Total profit
- $12,135
- Equity at exit
- $8,906
Cash invested: $28,840 (down + closing). Projections, not guarantees.
Landlord ↔ Tenant lean methodology
- Overall (STATE)
- 90 Strongly Landlord-Friendly
- State Louisiana
- 90 Strongly Landlord-Friendly · R+12
- County
- — inherits STATE
- City
- — inherits STATE
ZIP-level market 70052
- Home prices YoY
- -26.3%
- Active inventory
- 20
- Price-to-rent
- 7.5×
Monthly cashflow live
- Estimated rent
- $1,146 medium interval (Pro) →
- Mortgage (P&I)
- −$540
- Tax est. 1.5%
- −$129 /mo · $1,545/yr
- Insurance
- −$43
- HOA
- −$0
- Vacancy / Maint / Mgmt
- −$241
- Net cashflow
- $193
Break-even live
Sensitivity live
| Price | -10% $265 | -5% $229 | +0% $193 | +5% $158 | +10% $122 |
|---|---|---|---|---|---|
| Rent | -10% $103 | -5% $148 | +0% $193 | +5% $239 | +10% $284 |
| Rate | -1.0pp $245 | -0.5pp $220 | base $193 | +0.5pp $167 | +1.0pp $140 |
UW: 25.0% down · 7.5% · 30yr · 1.5% tax · 5.0% vac · 8.0% maint · 8.0% mgmt
Financing live
Cash to close
- Down payment
- $25,750
- Closing costs
- $3,090
- Reserves months
- —
- Total cash needed
- —
Loan-product check · same deal, 3 products live
Conventional
25% down · 7.5% · 30yr
- Down + closing
- —
- Monthly P&I
- —
- Monthly cashflow
- —
- DSCR
- —
- Eligible?
- —
Personal DTI + credit; lowest rate.
DSCR
20% down · 8.5% · 30yr
- Down + closing
- —
- Monthly P&I
- —
- Monthly cashflow
- —
- DSCR
- —
- Eligible?
- —
No personal income docs; deal must DSCR.
Hard money
10% down · 12.0% · 12mo
- Down + closing
- —
- Monthly P&I
- —
- Monthly cashflow
- —
- DSCR
- —
- Eligible?
- —
Short-term bridge; refi at stabilization.
Listing history 3 events
-
2026-06-21days on market $103,000 Active 3 DOM
-
2026-06-19remarks 598-char remark
-
2026-06-19$103,000 Active 1 DOM
ⓘ Source: listings_history table (triggers on properties + properties_extension) + one-shot
backfill from property_details.listing_events for pre-trigger history.
Climate risk First Street
- Flood 1/10 Low FEMA zone X (shaded) · 0% chance over 30 yrs
- Wildfire 1/10 Low
- Heat 9/10 Extreme 7 d/yr ≥108°F today · 22 d/yr by 30 yrs out
- Wind 9/10 Extreme 99% chance of damaging wind over 30 yrs
- Air quality 2/10 Low 1 unhealthy d/yr today · 1 by 30 yrs out
Nearby sold comps map
Loading sold comps map…
Walkable amenities ~0.75 mi
Loading nearby amenities…
Taxation est. · year 1
- Rental income
- $13,750
- − Mortgage interest
- −$5,770
- − Property taxes
- −$1,545
- − Insurance
- −$515
- − Repairs & maintenance
- −$1,100
- − Management
- −$1,100
- − Depreciation
- −$2,996
- Taxable income
- $724
- Est. tax owed @ 24.0%
- −$174
- After-tax cash flow
- $2,147/yr
For passive investors: Depreciation is non-cash, so a rental often shows a tax loss while cash-flowing — sheltering income. Rental losses are passive: they offset passive income freely, and up to $25,000/yr can offset ordinary (W-2) income if you actively participate and your MAGI is under $100k (phasing out to $0 by $150k); unused losses carry forward. On sale, claimed depreciation is recaptured at up to 25%, and gains may owe capital-gains tax (a 1031 exchange can defer both). Figures are a year-1 estimate at your 24.0% rate — not tax advice; consult a CPA.
Condition & rehab AI · 13 photos
This charming cottage-style home in Gramercy requires moderate renovations to update its kitchen and bathrooms, paint the interior, and replace the exterior siding and backyard shed. These updates will significantly enhance its resale value.
Repairs flagged
- Moderate Kitchen cabinets — Dated appearance and need for updating
- Moderate Bathroom fixtures — Dated appearance and need for updating
- Moderate Exterior siding — Weathered appearance and need for repainting or replacement
- Major Backyard shed — Structurally compromised and in poor condition
Value-add opportunities
- Resale Updating kitchen cabinets and fixtures — Modernizing the kitchen will attract more buyers
- Resale Updating bathroom fixtures and adding storage — Modernizing the bathroom will attract more buyers
- Resale Repainting interior walls and ceilings — Fresh paint will make the home more appealing to buyers
- Resale Reconditioning or replacing exterior siding — Fresh siding will improve curb appeal and home value
- Resale Reconditioning or replacing backyard shed — A functional and attractive shed will add to the home's appeal
Renovation cost estimate screening
| Repair item | Severity | Est. cost |
|---|---|---|
| Kitchen cabinets · Dated appearance and need for updating | Moderate | $3,000–15,000 |
| Bathroom fixtures · Dated appearance and need for updating | Moderate | $3,000–15,000 |
| Exterior siding · Weathered appearance and need for repainting or replacement | Moderate | $3,000–15,000 |
| Backyard shed · Structurally compromised and in poor condition | Major | $15,000–50,000 |
| Total estimated repair cost · 4 items | $24,000–95,000 |
Value-add ROI direction
- Resale Updating kitchen cabinets and fixtures — Modernizing the kitchen will attract more buyers ↑
- Resale Updating bathroom fixtures and adding storage — Modernizing the bathroom will attract more buyers ↑
- Resale Repainting interior walls and ceilings — Fresh paint will make the home more appealing to buyers ↑
- Resale Reconditioning or replacing exterior siding — Fresh siding will improve curb appeal and home value ↑
- Resale Reconditioning or replacing backyard shed — A functional and attractive shed will add to the home's appeal ↑
ⓘ Cost ranges are severity-bucket heuristics (US national rule-of-thumb). Get contractor quotes + a written scope before underwriting a rehab budget.
Schools (NCES district)
- District
- St. James Parish
- NCES district ID
- 2201500
- Math proficiency
- 31% ▼ -44.00%
- Reading proficiency
- 41% ▼ -38.00%
- Median HH income
- $51,020
- Composite
- 31.24/100
- National rank
- #6031
- State rank
- #30 of 98 in LA
Livability — Gramercy
- Score
- 73/100
- State rank
- #32
- US rank
- #5303
Category grades
Schools grade is shown separately in the Schools card above.
Census & demographics
- Census place
- Gramercy, LA
- City population
- 2,931
- Population (ZIP)
- 2,931
Population outlook (St. James County) Hauer SSP2
- Today (2025)
- 20,741 people
- By 2030
- 20,140 · -2.9%
- By 2040
- 18,560 · -10.5%
- By 2050
- 16,673 · -19.6%
- By 2075
- 12,535 · -39.6%
- By 2100
- 8,610 · -58.5%
Race, ethnicity, and origin ACS 2023
- Neighborhood character
- Predominantly Black (68%)
- Race & ethnicity
- Black 68% White 31%
- Common ancestry
- Lithuanian 11%
- Foreign-born
- 0%
- Languages at home
- 99% English-only · French/Haitian/Cajun 1%
Political lean MEDSL · St. James
- 2024 margin
- Toss-up / Even · D 49.1% · R 50.1%
- 2008→2024 swing
- -13.4pp toward R · 2008: 12.4pp · 2024: -0.9pp
- All cycles
- 2024: R+0.9 2020: D+4.4 2016: D+8.0 2012: D+14.9 2008: D+12.4
Not yet ingested
- Civics
- —
Market trends
- HPI YoY
- ▼ -48.00%
- Current HPI
- 134.6668
- Rent YoY
- —
- Metro
- —
- State GDP YoY
- ▲ 3.29%
- F500 in state
- 10
Industry mix (Fortune 500 HQ in LA)
| Industry | F500 HQs | Revenue |
|---|---|---|
| Telecommunications | 2 | $23B |
|
||
| Utilities | 1 | $12B |
|
||
| Wholesale / Distribution | 1 | $5B |
|
||
| Advertising | 1 | $2B |
|
||
Price history
+0.0% since first listed2 events — show timeline
- 2026-06-18 Listed $103,000 AcadianaMLS
- 2026-06-18 Listed $103,000 GSREIN
Cash-flow waterfall
monthlySold comps — $/sqft
last 12 mo · ≤1 miLoading sold comps…