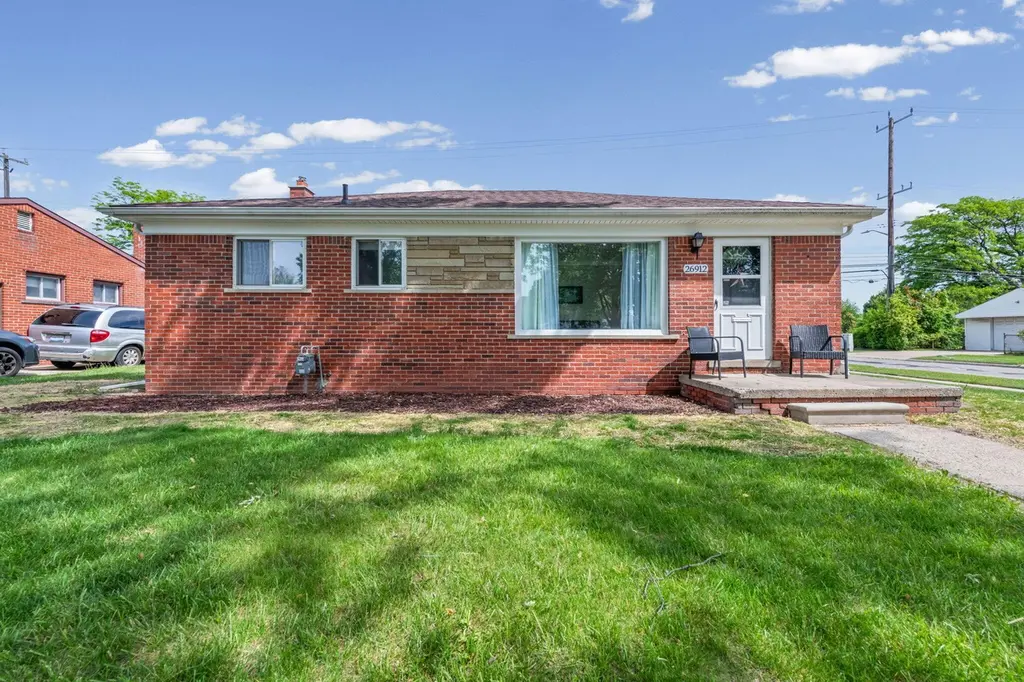
26912 W Davison · Livonia, MI
Flood risk 1/10 · Minimal
- FEMA flood zone
- X (shaded)
- Chance of flooding over 30 yrs
- 0.0%
- Est. flood insurance / yr
- $473 – $860
Fire risk 1/10 · Minimal
- Est. fire insurance / yr
- $784 – $1,456
Heat risk 3/10 · Minor
- Hot days now (above 98°F)
- 6 days/yr
- Hot days in 30 yrs
- 13 days/yr
Wind risk 2/10 · Minimal
- Chance of severe wind over 30 yrs
- —
Air-quality risk 3/10 · Minor
- Unhealthy air days now
- 2 days/yr
- Unhealthy air days in 30 yrs
- 3 days/yr
Risk factors via First Street. Map © Google.
Why this score? — see what drove the F grade
The composite is a weighted blend of 9 inputs, each scored 0–100. Each bar is that input's sub-score; the figure is the points it added to the 100-point composite (weight × sub-score).
- Cash flow +14.6/30.0
- DSCR +4.4/10.0
- Livability +3.9/5.0
- Rent growth +3.3/5.0
- 1% rule +2.9/10.0
- Condition / age +2.5/5.0
- Schools +1.8/10.0
- ARV discount +0.0/15.0
- Appreciation +0.0/10.0
$225,000
🖨 Deal sheet (PDF) 📄 Offer letter ✓ Due diligence
Listing remarks MLS
Welcome home to! This charming fully brick ranch features 3 bedrooms and 1.5 baths. Inside, you'll find a beautifully updated kitchen featuring Merillat cabinets, marble countertops, and stainless steel appliances. There is a full basement with the washer and dryer included, as well as a spacious 2-car garage. Thoughtfully designed to honor the character and period of the home, this move-in ready gem showcases fresh paint throughout and newly refinished hardwood floors. Additional updates include a newer furnace and hot water tank. The backyard is a quaint spot for your morning coffee or hosting loved ones. Clean, adorable, and full of charm -- stop by today for a showing! BTVAI. Seller is a licensed Real Estate Salesperson in the State of Michigan.
Key facts
- Merillat cabinets
- Marble countertops
- Full basement
Tags
Property features AI
Exterior
- Parking: Detached 2-car garage
- Utilities: Public water; Natural gas water heater
- Home design: Ranch-style single family residence; Built in 1955
- Construction: Brick construction; Asphalt roof
- Exterior features: Corner lot with sidewalk; Public water
Interior
- Kitchen: Kitchen (14 x 10)
- Bedrooms: Primary bedroom (13 x 13); Bedroom 2 (13 x 9); Bedroom 3 (12 x 9)
- Bathrooms: 1 full bathroom; 1 half bathroom
- Heating & cooling: Forced air heating; Has cooling
- Interior features: Total of 6 rooms; Full basement
- Laundry & utility: Natural gas water heater
Neighborhood map
What this means for you Summary
Snapshot
- This is a 3-bed/1.0-bath single-family listed at $225k.
Deal economics
- At list price, monthly cash flow is $53 ($632/yr) — positive.
- The deal already cash-flows at list — no discount required.
- To meet the 1% rule (rent ≥ 1% of price), the offer needs to be $177k (21.4% below list).
- Recommended offer: $177k (21.4% below list) — sets the bar for 1% rule.
- Cap rate 6.6% vs local median 4.9% in Livonia — top-decile yield for the area; either an underpriced asset or a hidden risk that comps aren't pricing in. Stress-test before assuming the spread holds.
Location & tenants
- Location reads 77/100 on livability (#116 in MI, #2,784 nationally) — a middle-class / working-renter tenant base. Strengths: employment A+, cost of living A+, housing A+; Watch: amenities D, health & safety D, commute F.
- South Redford School District (suburban): math 11% / reading 29% proficiency, ranked #455 of 540 in MI (top 84%) — low school quality limits family demand, transient renter base, plan for 1-2y turnover.
- Market conditions: Rents rising (+3.2%/yr); 188 active listings in the ZIP; 6 comparable units currently listed for rent nearby; rentals at typical pace (median 17d on market — plan ~3-4 weeks tenant-placement turnaround); 2,639 units permitted in Wayne County in 2024 (1,216 in 5+ unit buildings).
Forward outlook
- Local home prices are declining (-3.0%/yr); year-one equity from $2k of loan paydown is wiped out by about $7k of value loss. Plan a longer hold.
- Wayne County population projected at -17% by 2050 — secular population decline; favor cash flow + early exit over multi-decade hold.
Negotiation context
- Only 8 days on market — expect competitive offers; lowballing is unlikely to land.
- 3 sale attempts with the ask held roughly flat each time — persistent listings suggest the price (not the market) is what's stuck; bring a comps-based counter.
- Current owner paid $65k; list at $225k implies a 246% gain — meaningful room to come down on a strong offer.
Risks & watch-outs
- Watch-outs: built in 1955 — expect roof / HVAC / electrical / plumbing capex.
Questions for the listing agent
- Built in 1955 — when were the roof, HVAC, electrical panel, plumbing, and water heater last replaced?
- Is there a deadline driving the sale (1031 exchange, divorce, estate, relocation)? That informs how much negotiation room exists.
- Schools are B-rated — typically a magnet for longer-tenancy family renters. What's the average tenant stay here, and is there a school-zone premium baked into asking?
- The area grade is low — what's the realistic commute time and amenity access for the typical tenant pool here? Any planned neighborhood developments (good or bad) we should know about?
- What's the average days-on-market for RENTAL listings here right now (not sales)? A rising rental-DOM trend means longer vacancies and softer asking-rent achievability than the comps imply.
- What's the recent tenant-quality profile in this submarket — average credit score on applications, eviction rate, late-payment / NSF rate, and stable-employment percentage? A property-management company in the area should have these aggregated.
- How much new for-sale + rental construction is in the pipeline within 1–3 miles? Heavy new supply typically softens prices + rents 12–24 months out; constrained supply supports both.
Investment metrics
- 1% rule
- 0.79% ✗
- Cap rate
- 6.57%
- Cash-on-cash
- 1.00%
- DSCR
- 1.04
- GRM
- 10.6
CMA / ARV
- ARV (on-the-fly)
- $189,588
- Comps found
- 12
Show comp detail 12 sales within ~0.75 mi
| Address | Dist | Beds/Ba | Sqft | Sold | Price | $/sf | Match |
|---|---|---|---|---|---|---|---|
| 12770 Leverne | 0.38mi | 3/1.5 | 1,026 (-1%) | 0mo | $205,000 | $200 | 78 |
| 13965 Minock Dr | 0.27mi | 3/1.5 | 1,042 (+1%) | 8mo | $172,000 | $165 | 78 |
| 14041 Minock Dr | 0.31mi | 3/1.5 | 1,042 (+1%) | 6mo | $167,000 | $160 | 78 |
| 13221 Columbia St | 0.06mi | 3/1.5 | 1,102 (+6%) | 8mo | $202,000 | $183 | 78 |
| 14126 Rockland | 0.42mi | 3/1.5 | 1,042 (+1%) | 2mo | $205,000 | $197 | 76 |
| 12890 Hemingway | 0.27mi | 3/1.5 | 1,094 (+6%) | 1mo | $135,000 | $123 | 75 |
| 13210 Tecumseh Ave | 0.15mi | 3/2.0 | 1,096 (+6%) | 11mo | $180,000 | $164 | 70 |
| 12135 Leverne | 0.69mi | 2/1.5 (-1) | 1,050 (+1%) | 6mo | $167,000 | $159 | 54 |
| 26056 Lyndon | 0.62mi | 2/1.5 (-1) | 1,068 (+3%) | 6mo | $205,000 | $192 | 54 |
| 13556 Centralia | 0.63mi | 3/2.0 | 1,008 (-3%) | 12mo | $215,000 | $213 | 52 |
| 14284 Arcola St | 0.49mi | 3/1.5 | 1,157 (+12%) | 5mo | $260,000 | $225 | 51 |
| 14154 San Jose | 0.32mi | 3/1.5 | 1,190 (+15%) | 14mo | $180,000 | $151 | 46 |
Match score weights: distance 35% · size 25% · config 20% · recency 20%. Top-matched comps best support the ARV.
Projected returns pro-forma
-3.0% appreciation · 3.25% rent growth · sell at horizon
- IRR
- -14.5%
- Equity multiple
- 0.48×
- Total profit
- $-32,761
- Equity at exit
- $33,548
- IRR
- -5.5%
- Equity multiple
- 0.64×
- Total profit
- $-22,786
- Equity at exit
- $19,454
Cash invested: $63,000 (down + closing). Projections, not guarantees.
Landlord ↔ Tenant lean methodology
- Overall (STATE)
- 62 Landlord-Friendly
- State Michigan
- 62 Landlord-Friendly · EVEN
- County
- — inherits STATE
- City
- — inherits STATE
ZIP-level market 48239
- Rents YoY
- 3.2%
- Active inventory
- 188
- Price-to-rent
- 10.6×
Monthly cashflow live
- Estimated rent
- $1,768 high interval (Pro) →
- Mortgage (P&I)
- −$1,180
- Tax from tax record
- −$70 /mo · $844/yr
- Insurance
- −$94
- HOA
- −$0
- Vacancy / Maint / Mgmt
- −$371
- Net cashflow
- $53
Break-even live
Sensitivity live
| Price | -10% $180 | -5% $116 | +0% $53 | +5% $-11 | +10% $-75 |
|---|---|---|---|---|---|
| Rent | -10% $-87 | -5% $-17 | +0% $53 | +5% $123 | +10% $192 |
| Rate | -1.0pp $166 | -0.5pp $110 | base $53 | +0.5pp $-6 | +1.0pp $-65 |
UW: 25.0% down · 7.5% · 30yr · 1.5% tax · 5.0% vac · 8.0% maint · 8.0% mgmt
Financing live
Cash to close
- Down payment
- $56,250
- Closing costs
- $6,750
- Reserves months
- —
- Total cash needed
- —
Loan-product check · same deal, 3 products live
Conventional
25% down · 7.5% · 30yr
- Down + closing
- —
- Monthly P&I
- —
- Monthly cashflow
- —
- DSCR
- —
- Eligible?
- —
Personal DTI + credit; lowest rate.
DSCR
20% down · 8.5% · 30yr
- Down + closing
- —
- Monthly P&I
- —
- Monthly cashflow
- —
- DSCR
- —
- Eligible?
- —
No personal income docs; deal must DSCR.
Hard money
10% down · 12.0% · 12mo
- Down + closing
- —
- Monthly P&I
- —
- Monthly cashflow
- —
- DSCR
- —
- Eligible?
- —
Short-term bridge; refi at stabilization.
Rent comps 6 comps
| Address | Beds | Baths | Sqft | Rent | $/sqft | DOM | Units | Dist |
|---|---|---|---|---|---|---|---|---|
| 13231 Hemingway Redford, MI | 3.0 | 1.5 | 1074 | $1,700 | $1.58 | 17d | 1 | 0.19mi |
| 12097 Cavell St Livonia, MI | 3.0 | 1.0 | 985 | $1,200 | $1.22 | 2d | 1 | 0.83mi |
| 12107 Centralia Redford, MI | 3.0 | 1.0 | 912 | $1,800 | $1.97 | 44d | 1 | 0.90mi |
| 11726 Deering St Livonia, MI | 4.0 | 1.5 | 1248 | $2,125 | $1.70 | 0d | 1 | 1.00mi |
| 14256 Salem Redford, MI | 3.0 | 1.5 | 1168 | $1,675 | $1.43 | 17d | 1 | 1.33mi |
| 15195 Aubrey Redford, MI | 3.0 | 1.0 | 769 | $1,395 | $1.81 | 17d | 1 | 1.37mi |
Listing history 10 events
-
2026-06-07statusdays on market $225,000 Pending 8 DOM
-
2026-06-04days on market $225,000 Active 7 DOM
-
2026-06-03days on market $225,000 Active 6 DOM
-
2026-06-02days on market $225,000 Active 5 DOM
-
2026-06-01days on market $225,000 Active 4 DOM
-
2026-05-31days on market $225,000 Active 3 DOM
-
2026-05-28$225,000 Active
Show marketing remark (759 chars)
Welcome home to! This charming fully brick ranch features 3 bedrooms and 1.5 baths. Inside, you'll find a beautifully updated kitchen featuring Merillat cabinets, marble countertops, and stainless steel appliances. There is a full basement with the washer and dryer included, as well as a spacious 2-car garage. Thoughtfully designed to honor the character and period of the home, this move-in ready gem showcases fresh paint throughout and newly refinished hardwood floors. Additional updates include a newer furnace and hot water tank. The backyard is a quaint spot for your morning coffee or hosting loved ones. Clean, adorable, and full of charm -- stop by today for a showing! BTVAI. Seller is a licensed Real Estate Salesperson in the State of Michigan.
-
2026-05-28$225,000 Active 759-char remark
Show marketing remark (759 chars)
Welcome home to! This charming fully brick ranch features 3 bedrooms and 1.5 baths. Inside, you'll find a beautifully updated kitchen featuring Merillat cabinets, marble countertops, and stainless steel appliances. There is a full basement with the washer and dryer included, as well as a spacious 2-car garage. Thoughtfully designed to honor the character and period of the home, this move-in ready gem showcases fresh paint throughout and newly refinished hardwood floors. Additional updates include a newer furnace and hot water tank. The backyard is a quaint spot for your morning coffee or hosting loved ones. Clean, adorable, and full of charm -- stop by today for a showing! BTVAI. Seller is a licensed Real Estate Salesperson in the State of Michigan.
-
1991-06-28soldstatus $65,000
ⓘ Source: listings_history table (triggers on properties + properties_extension) + one-shot
backfill from property_details.listing_events for pre-trigger history.
Tax reassessment forecast MI · Partial reset (capped growth)
- Current annual tax
- $844 · $70/mo
- Projected year-2 tax
- $2,154 · $180/mo
- Expected delta
- +$1,311/yr (+$109/mo · 155.3%)
ⓘ Screening estimate from a state-policy table — verify with the county assessor before closing.
Climate risk First Street
- Flood 1/10 Low FEMA zone X (shaded) · 0% chance over 30 yrs
- Wildfire 1/10 Low
- Heat 3/10 Moderate 6 d/yr ≥98°F today · 13 d/yr by 30 yrs out
- Wind 2/10 Low
- Air quality 3/10 Moderate 2 unhealthy d/yr today · 3 by 30 yrs out
Nearby sold comps map
Loading sold comps map…
Walkable amenities ~0.75 mi
Loading nearby amenities…
Taxation est. · year 1
- Rental income
- $21,216
- − Mortgage interest
- −$12,603
- − Property taxes
- −$844
- − Insurance
- −$1,125
- − Repairs & maintenance
- −$1,697
- − Management
- −$1,697
- − Depreciation
- −$6,545
- Taxable loss
- −$3,297
- Est. tax savings @ 24.0%
- +$791
- After-tax cash flow
- $1,424/yr
For passive investors: Depreciation is non-cash, so a rental often shows a tax loss while cash-flowing — sheltering income. Rental losses are passive: they offset passive income freely, and up to $25,000/yr can offset ordinary (W-2) income if you actively participate and your MAGI is under $100k (phasing out to $0 by $150k); unused losses carry forward. On sale, claimed depreciation is recaptured at up to 25%, and gains may owe capital-gains tax (a 1031 exchange can defer both). Figures are a year-1 estimate at your 24.0% rate — not tax advice; consult a CPA.
Schools (NCES district)
- District
- South Redford School District
- NCES district ID
- 2632280
- Math proficiency
- 11% ▼ -9.00%
- Reading proficiency
- 29% ▼ -7.00%
- Median HH income
- $52,775
- Composite
- 18.1/100
- National rank
- #8972
- State rank
- #455 of 540 in MI
Livability — Livonia
- Score
- 77/100
- State rank
- #116
- US rank
- #2784
Category grades
Schools grade is shown separately in the Schools card above.
Census & demographics
- County
- Wayne County · 1,562,939 people
- City population
- 572,865
- Metro
- Detroit-Warren-Dearborn, MI
- Population (ZIP)
- 36,976
- Household income
- $71,151
- Rent vs Own
- Severe rent burden
- 1052.0
Population outlook (Wayne County) Hauer SSP2
- Today (2025)
- 1,675,273 people
- By 2030
- 1,620,300 · -3.3%
- By 2040
- 1,502,341 · -10.3%
- By 2050
- 1,384,039 · -17.4%
- By 2075
- 1,124,592 · -32.9%
- By 2100
- 881,193 · -47.4%
Race, ethnicity, and origin ACS 2023
- Neighborhood character
- Majority Black (58%)
- Race & ethnicity
- Black 58% White 34% Hispanic / Latino 4% Two or more races 4%
- Common ancestry
- Romanian 7% Slovak 2% Lithuanian 2%
- Foreign-born
- 2% · Canada
- Languages at home
- 96% English-only · Spanish 1% Other Indo-European 1% Arabic 1%
Political lean MEDSL · Wayne
- 2024 margin
- Strong D (+29.0) · D 62.7% · R 33.7% · Other 3.6%
- 2008→2024 swing
- -20.5pp toward R · 2008: 49.5pp · 2024: 29.0pp
- All cycles
- 2024: D+29.0 2020: D+38.1 2016: D+37.3 2012: D+46.9 2008: D+49.5
Not yet ingested
- Civics
- —
Market trends
- HPI YoY
- ▼ -202.97%
- Current HPI
- 236.1136
- Rent YoY
- ▲ 3.25%
- Metro
- Detroit-Warren-Dearborn, MI
- State GDP YoY
- ▲ 1.37%
- F500 in state
- 28
Industry mix (Fortune 500 HQ in MI)
| Industry | F500 HQs | Revenue |
|---|---|---|
| Automotive Parts | 3 | $48B |
|
||
| Automotive | 2 | $372B |
|
||
| Chemicals | 1 | $45B |
|
||
| Automotive Retail | 1 | $29B |
|
||
| Healthcare / Medical Devices | 1 | $23B |
|
||
| Automotive Technology | 1 | $20B |
|
||
Price history
+246.2% since first listed4 events — show timeline
- 2026-05-28 Listed $225,000 MiRealSource-MiMLS
- 2026-05-28 Listed $225,000 REALCOMP
- 2026-05-28 Listed $225,000 SW Michigan MLS
- 1991-06-28 Sold (Public Records) $65,000 Public Records
Property tax history
-6.6%/yrLatest (2025): $844 · -66.0% YoY. Source: county tax records.
Cash-flow waterfall
monthlySold comps — $/sqft
last 12 mo · ≤1 miLoading sold comps…