 🌊 Lakefront
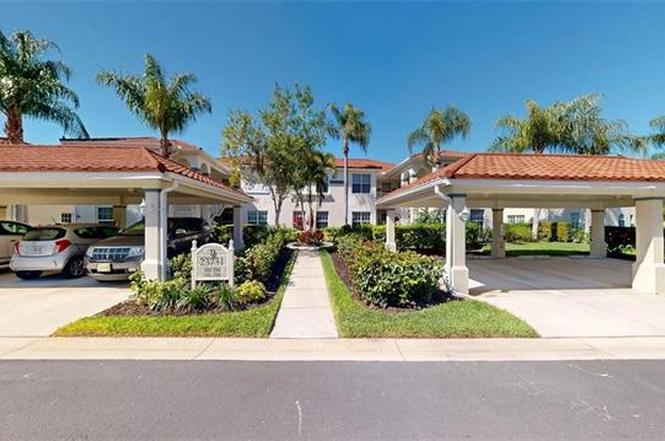
23731 Old Port Rd #201 · Estero, FL
Flood risk 1/10 · Minimal
- FEMA flood zone
- X (unshaded)
- Chance of flooding over 30 yrs
- 0.0%
- Est. flood insurance / yr
- $507 – $1,088
Fire risk 4/10 · Minor
- Est. fire insurance / yr
- $947 – $1,759
Heat risk 10/10 · Severe
- Hot days now (above 107°F)
- 7 days/yr
- Hot days in 30 yrs
- 30 days/yr
Wind risk 10/10 · Severe
- Chance of severe wind over 30 yrs
- 99.0%
Air-quality risk 3/10 · Minor
- Unhealthy air days now
- 2 days/yr
- Unhealthy air days in 30 yrs
- 2 days/yr
Risk factors via First Street. Map © Google.
Why this score? — see what drove the B grade
The composite is a weighted blend of 9 inputs, each scored 0–100. Each bar is that input's sub-score; the figure is the points it added to the 100-point composite (weight × sub-score).
- Cash flow +30.0/30.0
- 1% rule +10.0/10.0
- DSCR +10.0/10.0
- ARV discount +7.5/15.0
- Schools +4.1/10.0
- Livability +4.0/5.0
- Condition / age +2.5/5.0
- Rent growth +2.3/5.0
- Appreciation +0.0/10.0
$295,000
🖨 Deal sheet 📄 Offer letter ✓ Due diligence
Listing remarks
Price REDUCED * Embrace the ultimate Florida lifestyle! This tropical turnkey 3 Bed / 2 Bed plus den END unit offers soaring 11-ft ceilings and breathtaking lake views, overlooking 3 sparkling fountains. Unit 201 is upgraded with vinyl flooring, granite countertops in the kitchen, plantation shutters all round, and convenient electric storm shutters for added peace of mind. This PRICED to SELL home is perfectly nestled in the gated, 100% lakefront Lighthouse Bay community within The Brooks, spanning 162 acres with just 654 residences for a serene low-density vibe (only 4 units per acre). Enjoy 44 acres of stocked lakes, 70 acres of lush green space, including a 26-acre wildlife preserve,
Key facts
- Gated community
- Wildlife preserve
- Lake views
Tags
Property features AI
Finance
- Other: Part of a larger complex with 144 units; building contains 8 units; 2 units per floor; 1 floor in this building unit count context
- Financial info: Total annual recurring HOA fees and one-time fees are managed by the association
- HOA & community: Mandatory HOA with professional management; Quarterly condo fee (listed); HOA maintenance covers cable, insurance, internet/Wi-Fi, irrigation water, lawn/land maintenance, legal/accounting, manager, master association fee, exterior pest control, recreation facilities, repairs, reserves, security, sewer, street lights, street maintenance, trash removal and water; Community amenities include clubhouse, community pool and spa, exercise room, tennis, pickleball, bocce, basketball, fishing pier, community boat dock, beach club access, restaurant, business center, library, hobby room, play area, sidewalks and streetlights
Exterior
- Parking: 1 assigned covered parking; Detached 1-car carport; Paved driveway and paved parking
- Security: Gated community; Entry keypad
- Utilities: Central water; Central sewer; Cable available; Irrigation with reclaimed water and lake/canal source
- Home design: Residential property in a low-rise (1–3) building; 2-story garden apartment; Zero lot line; Rear exposure faces southwest; Part of Lighthouse Bay at The Brooks community
- Construction: Concrete block construction; Stucco exterior finish; Metal roof; Year built 2000; See remarks regarding building description
- Exterior features: Pond and water features with lake view; Sprinkler (automatic); Water display; Shutters (electric)
Interior
- Kitchen: Pantry; Cooktop - electric; Self-cleaning oven; Dishwasher; Microwave; Refrigerator/ice maker; Disposal
- Bedrooms: 3 bedrooms with split bedroom floor plan
- Flooring: Carpet; Vinyl
- Bathrooms: 2 full bathrooms; Master bath with dual sinks and shower (no tub)
- Heating & cooling: Central electric heat; Central electric air conditioning; Ceiling fans
- Interior features: Cable prewire; Foyer; High-speed internet available; Pantry; Smoke detectors; Walk-in closet; Window coverings; Den (study); Great room; Screened lanai/porch; Turnkey furnished; 9 total rooms; 6 ceiling fans
- Laundry & utility: Washer and dryer in residence; Laundry in residence
Neighborhood map
What this means for you Summary
Snapshot
- This is a 3-bed/2.0-bath condo listed at $295k.
Deal economics
- At list price, monthly cash flow is $1k ($16k/yr) — positive.
- The deal already cash-flows at list — no discount required.
- Meets the 1% rule at list price ($5k rent vs $295k).
- Recommended offer: $268k (9.0% below list) — sets the bar for market timing.
- Cap rate 11.7% vs local median 3.4% in Estero — top-decile yield for the area; either an underpriced asset or a hidden risk that comps aren't pricing in. Stress-test before assuming the spread holds.
Location & tenants
- Location reads 79/100 on livability (#149 in FL, #2,242 nationally) — a middle-class / working-renter tenant base. Strengths: crime A+, employment A+, housing A+; Watch: amenities F, commute F, cost of living D-.
- Lee (suburban): math 47% / reading 50% proficiency, ranked #42 of 73 in FL (top 58%) — families likely to look elsewhere, expect single-tenant / working-renter base with shorter leases.
- Market conditions: Rents soft (-0.6%/yr); 835 active listings in the ZIP; 13 comparable units currently listed for rent nearby; rentals at typical pace (median 24d on market — plan ~3-4 weeks tenant-placement turnaround); solid renter incomes; 15,411 units permitted in Lee County in 2024 (4,686 in 5+ unit buildings).
- At $5,253/mo this rent would consume 69% of the median local household income ($91k/yr) (locally 976% of renters already pay >50% of income on rent) — very limited rent-growth headroom before tenants either downsize or default.
Forward outlook
- Local home prices are declining (-3.0%/yr); year-one equity from $2k of loan paydown is wiped out by about $9k of value loss. Plan a longer hold.
- Lee County population projected at +44% by 2050 — long-run rental-demand tailwind backs the buy-and-hold thesis.
- At projected returns (-3.0% appreciation + 0.0% rent growth), your $83k cash investment doubles in ~9 years — after that, you're playing with house money.
Negotiation context
- It's been on market 114 days — a 9% lower offer ($268k) is reasonable based on typical stale-listing flexibility.
- Current owner paid $235k; 26% above their basis — modest negotiation headroom, anchor on the comps not their cost.
Risks & watch-outs
- Climate carrying-cost: severe wind risk, 99% chance of damaging wind over 30y; extreme-heat days projected 7→30/yr by 2055 (HVAC capex compounding) — expect insurance premiums to compound above CPI over the hold.
Questions for the listing agent
- It's been on market 114 days. Have you received any prior offers? Is the seller open to a 9% concession, seller financing, or rate buy-down credit?
- What does the HOA fee cover, when was the last increase, and are there any pending special assessments or reserve-fund shortfalls?
- Any open or pending special assessments — roof, HVAC, plumbing, elevator, façade? What's the per-unit balance and payoff schedule, and is the seller paying it off at close or rolling it to the buyer?
- Why hasn't it sold? Are there any deal-killer items the seller is aware of (foundation, flood, title, zoning, code violations)?
- Is there a deadline driving the sale (1031 exchange, divorce, estate, relocation)? That informs how much negotiation room exists.
- Schools are A-rated — typically a magnet for longer-tenancy family renters. What's the average tenant stay here, and is there a school-zone premium baked into asking?
- This sits on a lake — are riparian / water-frontage rights deeded with the parcel? Any dock permits, shoreline easements, or HOA water-use restrictions?
- What's the documented flood / surge / shoreline-erosion history here (FEMA AND non-FEMA — e.g., storm surge, creek backup, septic-field saturation)?
- Any water-quality or seasonal algae-bloom issues that affect tenant satisfaction or short-term-rental demand?
- What's the average days-on-market for RENTAL listings here right now (not sales)? A rising rental-DOM trend means longer vacancies and softer asking-rent achievability than the comps imply.
- What's the recent tenant-quality profile in this submarket — average credit score on applications, eviction rate, late-payment / NSF rate, and stable-employment percentage? A property-management company in the area should have these aggregated.
- How much new apartment / multifamily construction is in the pipeline within 1–3 miles? Heavy new supply (>2% of stock underway) typically softens rents 12–24 months out; light construction supports rent growth.
Investment metrics
- 1% rule
- 1.78% ✓
- Cap rate
- 11.69%
- Cash-on-cash
- 19.28%
- DSCR
- 1.86
- GRM
- 4.7
CMA / ARV
No comps found within radius.
Projected returns pro-forma
-3.0% appreciation · 0.0% rent growth · sell at horizon
- IRR
- 7.1%
- Equity multiple
- 1.26×
- Total profit
- $21,876
- Equity at exit
- $43,985
- IRR
- 12.9%
- Equity multiple
- 1.86×
- Total profit
- $70,655
- Equity at exit
- $25,506
Cash invested: $82,600 (down + closing). Projections, not guarantees.
Landlord ↔ Tenant lean methodology
- Overall (STATE)
- 87 Strongly Landlord-Friendly
- State Florida
- 87 Strongly Landlord-Friendly · R+3
- County
- — inherits STATE
- City
- — inherits STATE
ZIP-level market 34135
- Rents YoY
- -0.6%
- Active inventory
- 835
- Price-to-rent
- 4.7×
Monthly cashflow live
- Estimated rent
- $5,253 high interval (Pro) →
- Mortgage (P&I)
- −$1,547
- Tax from tax record
- −$354 /mo · $4,252/yr
- Insurance
- −$123
- HOA
- −$799
- Vacancy / Maint / Mgmt
- −$1,103
- Net cashflow
- $1,327
Break-even live
UW: 25.0% down · 7.5% · 30yr · 1.5% tax · 5.0% vac · 8.0% maint · 8.0% mgmt
Financing live
Cash to close
- Down payment
- $73,750
- Closing costs
- $8,850
- Reserves months
- —
- Total cash needed
- —
Loan-product check · same deal, 3 products live
Conventional
25% down · 7.5% · 30yr
- Down + closing
- —
- Monthly P&I
- —
- Monthly cashflow
- —
- DSCR
- —
- Eligible?
- —
Personal DTI + credit; lowest rate.
DSCR
20% down · 8.5% · 30yr
- Down + closing
- —
- Monthly P&I
- —
- Monthly cashflow
- —
- DSCR
- —
- Eligible?
- —
No personal income docs; deal must DSCR.
Hard money
10% down · 12.0% · 12mo
- Down + closing
- —
- Monthly P&I
- —
- Monthly cashflow
- —
- DSCR
- —
- Eligible?
- —
Short-term bridge; refi at stabilization.
Rent comps 13 comps
| Address | Beds | Baths | Sqft | Rent | $/sqft | DOM | Units | Dist |
|---|---|---|---|---|---|---|---|---|
| 10910 Santa Margherita Rd #102 Estero, FL | 3.0 | 2.0 | 1279 | $2,200 | $1.72 | 23d | 1 | 0.28mi |
| 23501 Wisteria Pointe Dr #1206 Estero, FL | 3.0 | 2.0 | 1560 | $7,000 | $4.49 | 23d | 1 | 0.29mi |
| 23810 Marbella Bay Rd #102 Estero, FL | 2.0 | 2.0 | 1103 | $5,000 | $4.53 | 23d | 1 | 0.29mi |
| 23810 Costa del Sol Rd #203 Estero, FL | 2.0 | 2.0 | 1276 | $2,400 | $1.88 | 15d | 1 | 0.31mi |
| 10911 Santa Margherita Rd #102 Estero, FL | 2.0 | 2.0 | 1279 | $2,800 | $2.19 | 23d | 1 | 0.32mi |
| 23821 Marbella Bay Rd #102 Estero, FL | 2.0 | 2.0 | 1279 | $5,750 | $4.50 | 23d | 1 | 0.33mi |
| 23821 Marbella Bay Rd Ofc Season Bonita Springs, FL | 2.0 | 2.0 | 1279 | $2,500 | $1.95 | 23d | 1 | 0.33mi |
| 23785 Clear Spring Ct #2305 Estero, FL | 3.0 | 2.0 | 1811 | $7,500 | $4.14 | 23d | 1 | 0.63mi |
| 9030 Spring Run Blvd #508 Estero, FL | 2.0 | 2.0 | 1333 | $6,500 | $4.88 | 23d | 1 | 1.13mi |
| 23541 Sandycreek Ter #806 Estero, FL | 2.0 | 2.0 | 1700 | $6,000 | $3.53 | 23d | 1 | 1.35mi |
| 23526 Sandycreek Ter #304 Estero, FL | 2.0 | 2.0 | 1368 | $6,500 | $4.75 | 23d | 1 | 1.35mi |
| 23591 Sandycreek Ter #1006 Estero, FL | 2.0 | 2.0 | 1209 | $6,000 | $4.96 | 23d | 1 | 1.38mi |
| 23601 Sandycreek Ter #903 Estero, FL | 2.0 | 2.0 | 1246 | $6,000 | $4.82 | 23d | 1 | 1.40mi |
HOA detail condo
- Monthly dues
- $799 · $9,588/yr
- Likely covers
- electricsecurity
- Assessments
- None detected in remarks — confirm with the listing agent.
Listing history 15 events
-
2026-06-17days on market $295,000 Active 114 DOM
-
2026-06-16days on market $295,000 Active 113 DOM
-
2026-06-15days on market $295,000 Active 112 DOM
-
2026-06-13days on market $295,000 Active 110 DOM
-
2026-06-10days on market $295,000 Active 107 DOM
-
2026-06-09days on market $295,000 Active 106 DOM
-
2026-06-07days on market $295,000 Active 104 DOM
-
2026-06-02days on market $295,000 Active 99 DOM
-
2026-06-01days on market $295,000 Active 98 DOM
-
2026-06-01days on market $295,000 Active 97 DOM
-
2026-05-23price $295,000
-
2026-03-17price $305,000
-
2026-02-23$329,900 Active
-
2008-11-13soldstatus $235,000
-
2000-03-07soldstatus $3,458,800
ⓘ Source: listings_history table (triggers on properties + properties_extension) + one-shot
backfill from property_details.listing_events for pre-trigger history.
Tax reassessment forecast FL · Resets to sale price
- Current annual tax
- $4,252 · $354/mo
- Projected year-2 tax
- $4,252 · $354/mo
- Expected delta
- $0/yr ($0/mo · 0.0%)
ⓘ Screening estimate from a state-policy table — verify with the county assessor before closing.
Climate risk First Street
- Flood 1/10 Low FEMA zone X (unshaded) · 0% chance over 30 yrs
- Wildfire 4/10 Moderate
- Heat 10/10 Extreme 7 d/yr ≥107°F today · 30 d/yr by 30 yrs out
- Wind 10/10 Extreme 99% chance of damaging wind over 30 yrs
- Air quality 3/10 Moderate 2 unhealthy d/yr today · 2 by 30 yrs out
Nearby sold comps map
Loading sold comps map…
Walkable amenities ~0.75 mi
Loading nearby amenities…
Taxation est. · year 1
- Rental income
- $63,041
- − Mortgage interest
- −$16,525
- − Property taxes
- −$4,252
- − Insurance
- −$1,475
- − Repairs & maintenance
- −$5,043
- − Management
- −$5,043
- − HOA
- −$9,588
- − Depreciation
- −$8,582
- Taxable income
- $12,533
- Est. tax owed @ 24.0%
- −$3,008
- After-tax cash flow
- $12,915/yr
For passive investors: Depreciation is non-cash, so a rental often shows a tax loss while cash-flowing — sheltering income. Rental losses are passive: they offset passive income freely, and up to $25,000/yr can offset ordinary (W-2) income if you actively participate and your MAGI is under $100k (phasing out to $0 by $150k); unused losses carry forward. On sale, claimed depreciation is recaptured at up to 25%, and gains may owe capital-gains tax (a 1031 exchange can defer both). Figures are a year-1 estimate at your 24.0% rate — not tax advice; consult a CPA.
Schools (NCES district)
- District
- Lee
- NCES district ID
- 1201080
- Math proficiency
- 47% ▼ -11.00%
- Reading proficiency
- 50% ▼ -4.00%
- Median HH income
- $49,518
- Composite
- 41.49/100
- National rank
- #3458
- State rank
- #42 of 73 in FL
Livability — Estero
- Score
- 79/100
- State rank
- #149
- US rank
- #2242
Category grades
Schools grade is shown separately in the Schools card above.
Census & demographics
- Census place
- Estero, FL
- County
- Lee County · 788,662 people
- City population
- 31,926
- Metro
- Cape Coral-Fort Myers, FL
- Population (ZIP)
- 48,252
- Household income
- $91,380
- Rent vs Own
- Severe rent burden
- 976.0
Population outlook (Lee County) Hauer SSP2
- Today (2025)
- 871,946 people
- By 2030
- 955,468 · +9.6%
- By 2040
- 1,113,587 · +27.7%
- By 2050
- 1,256,891 · +44.1%
- By 2075
- 1,560,270 · +78.9%
- By 2100
- 1,726,848 · +98.0%
Race, ethnicity, and origin ACS 2023
- Neighborhood character
- Predominantly White (69%)
- Race & ethnicity
- White 69% Hispanic / Latino 26% Two or more races 13% Native American 3% Black 2%
- Hispanic origin (detail)
- Mexican 8% Puerto Rican 4% Cuban 3%
- Common ancestry
- Romanian 5% Lithuanian 2% Slovak 2%
- Foreign-born
- 22% · Canada, Jamaica
- Languages at home
- 74% English-only · Spanish 21% French/Haitian/Cajun 1% Russian/Polish/Slavic 1%
Political lean MEDSL · Lee
- 2024 margin
- Strong R (+28.4) · D 35.5% · R 63.9%
- 2008→2024 swing
- -18.0pp toward R · 2008: -10.4pp · 2024: -28.4pp
- All cycles
- 2024: R+28.4 2020: R+19.2 2016: R+20.4 2012: R+16.6 2008: R+10.4
Not yet ingested
- Civics
- —
Market trends
- HPI YoY
- ▼ -188.86%
- Current HPI
- 243.4153
- Rent YoY
- ▼ -0.61%
- Metro
- Cape Coral-Fort Myers, FL
- State GDP YoY
- ▲ 3.28%
- F500 in state
- 36
Industry mix (Fortune 500 HQ in FL)
| Industry | F500 HQs | Revenue |
|---|---|---|
| Industrial Technology | 2 | $29B |
|
||
| Insurance | 2 | $17B |
|
||
| Retail | 1 | $60B |
|
||
| Technology Distribution | 1 | $58B |
|
||
| Homebuilding | 1 | $35B |
|
||
| Technology Manufacturing | 1 | $35B |
|
||
Price history
-91.5% since first listed5 events — show timeline
- 2026-05-23 Price Changed $295,000 NAPLESMLS
- 2026-03-17 Price Changed $305,000 NAPLESMLS
- 2026-02-23 Listed $329,900 NAPLESMLS
- 2008-11-13 Sold (Public Records) $235,000 Public Records
- 2000-03-07 Sold (Public Records) $3,458,800 Public Records
Property tax history
+3.7%/yrLatest (2025): $4,252 · +2.0% YoY. Source: county tax records.
Cash-flow waterfall
monthlySold comps — $/sqft
last 12 mo · ≤1 miLoading sold comps…