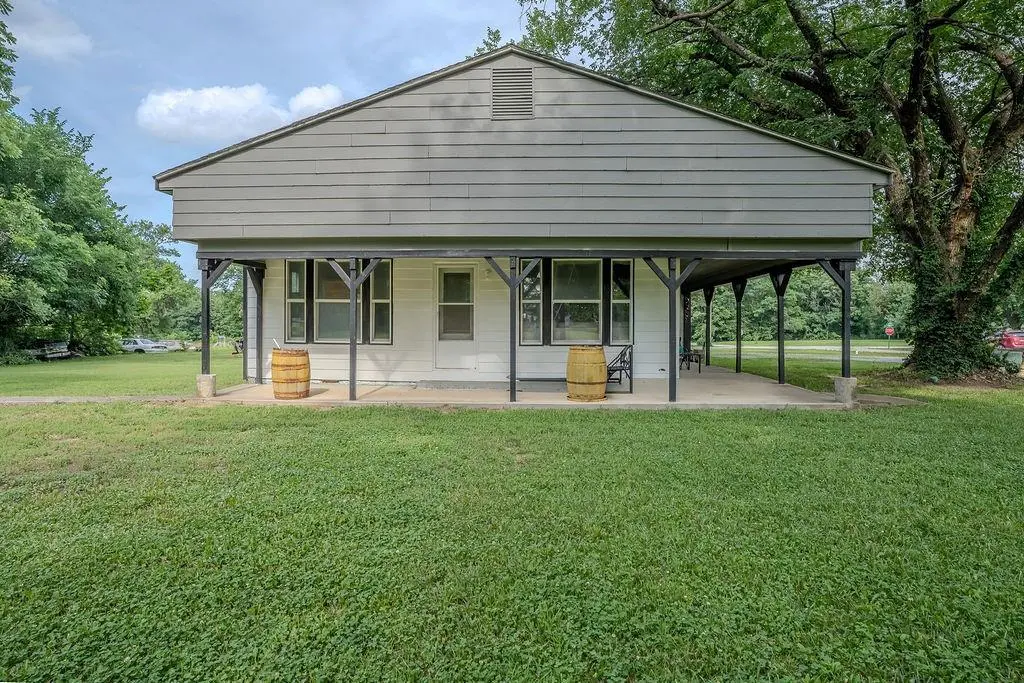
203 E Sycamore St · Weir, KS
Flood risk 1/10 · Minimal
- FEMA flood zone
- X (unshaded)
- Chance of flooding over 30 yrs
- 0.0%
- Est. flood insurance / yr
- $507 – $1,088
Fire risk 4/10 · Minor
- Est. fire insurance / yr
- $1,154 – $2,142
Heat risk 5/10 · Moderate
- Hot days now (above 107°F)
- 7 days/yr
- Hot days in 30 yrs
- 20 days/yr
Wind risk 2/10 · Minimal
- Chance of severe wind over 30 yrs
- 2.0%
Air-quality risk 2/10 · Minimal
- Unhealthy air days now
- 1 days/yr
- Unhealthy air days in 30 yrs
- 1 days/yr
Risk factors via First Street. Map © Google.
Why this score? — see what drove the C- grade
The composite is a weighted blend of 9 inputs, each scored 0–100. Each bar is that input's sub-score; the figure is the points it added to the 100-point composite (weight × sub-score).
- Cash flow +21.0/30.0
- Appreciation +8.9/10.0
- DSCR +6.7/10.0
- 1% rule +4.7/10.0
- Livability +2.7/5.0
- Rent growth +2.5/5.0
- Condition / age +2.5/5.0
- Schools +2.3/10.0
- ARV discount +0.0/15.0
$129,000
🖨 Deal sheet 📄 Offer letter ✓ Due diligence
Key facts
- Expansive lot
- Built-in pantry
- Pocket doors
Tags
Property features AI
Finance
- Other: Above-grade finished living area reported (assessor source)
- Financial info: Annual tax noted (not included in feature details)
- HOA & community: No association fees
Exterior
- Parking: Attached garage facing the side; Off-street parking; 2-car garage
- Utilities: Public water; Public sewer
- Home design: Single-family residence; Ranch floor plan; Residential property
- Construction: Block and lap siding construction; Composition roof; Approximately 101+ years old
- Exterior features: Covered patio; Paved road access; Lot approximately 26,880 sq ft
Interior
- Kitchen: Gas range
- Bedrooms: Three bedrooms on the main level (approx. 12' x 10', 10' x 12', 12' x 10')
- Bathrooms: One full bathroom
- Heating & cooling: Natural gas heating; Electric cooling (has cooling)
- Interior features: Ceiling fans; Pantry; Stained cabinets; Storm windows; Wood windows
- Laundry & utility: Crawl space basement
Neighborhood map
What this means for you Summary
Snapshot
- This is a 3-bed/1.0-bath single-family listed at $129k.
Deal economics
- At list price, monthly cash flow is $181 ($2k/yr) — positive.
- The deal already cash-flows at list — no discount required.
- To meet the 1% rule (rent ≥ 1% of price), the offer needs to be $125k (3.0% below list).
- Recommended offer: $125k (3.0% below list) — sets the bar for 1% rule.
Location & tenants
- Location reads 54/100 on livability (#593 in KS) — a working-class tenant base; expect higher turnover. Strengths: cost of living A+, health & safety A; Watch: schools D+, crime F, amenities F.
- Cherokee (rural): math 23% / reading 32% proficiency, ranked #127 of 169 in KS (top 75%) — low school quality limits family demand, transient renter base, plan for 1-2y turnover.
- Market conditions: 6 active listings in the ZIP; 17 units permitted in Cherokee County in 2024 (0 in 5+ unit buildings).
Forward outlook
- In year one you build about $11k of equity ($892 loan paydown + $10k appreciation (7.9% local appreciation)).
- Cherokee County population projected at -26% by 2050 — secular population decline; favor cash flow + early exit over multi-decade hold.
- At projected returns (7.9% appreciation + 3.0% rent growth), your $36k cash investment doubles in ~3 years — after that, you're playing with house money.
- By year 4, paydown + projected appreciation supports a ~$38k cash-out refi (75% LTV) — recoverable capital for the next deal without selling this one.
Negotiation context
- It's been on market 15 days — a 2% lower offer ($127k) is reasonable based on typical stale-listing flexibility.
Risks & watch-outs
- Watch-outs: built in 1900 — expect roof / HVAC / electrical / plumbing capex.
- Climate carrying-cost: extreme-heat days projected 7→20/yr by 2055 (HVAC capex compounding) — expect insurance premiums to compound above CPI over the hold.
Questions for the listing agent
- Built in 1900 — when were the roof, HVAC, electrical panel, plumbing, and water heater last replaced?
- Is there a deadline driving the sale (1031 exchange, divorce, estate, relocation)? That informs how much negotiation room exists.
- Schools are D-rated, which usually means shorter tenancies and higher turnover. Who's the typical renter profile here, and what's been the actual vacancy rate?
- Crime grade is F in this area — have there been break-ins, vandalism, or insurance claims at this property in the last 3 years? What carrier currently insures it and at what premium?
- What's the average days-on-market for RENTAL listings here right now (not sales)? A rising rental-DOM trend means longer vacancies and softer asking-rent achievability than the comps imply.
- What's the recent tenant-quality profile in this submarket — average credit score on applications, eviction rate, late-payment / NSF rate, and stable-employment percentage? A property-management company in the area should have these aggregated.
- How much new for-sale + rental construction is in the pipeline within 1–3 miles? Heavy new supply typically softens prices + rents 12–24 months out; constrained supply supports both.
Investment metrics
- 1% rule
- 0.97% ✗
- Cap rate
- 7.98%
- Cash-on-cash
- 6.02%
- DSCR
- 1.27
- GRM
- 8.6
CMA / ARV
- ARV (on-the-fly)
- $102,340
- Comps found
- 6
Show comp detail 6 sales within ~0.75 mi
| Address | Dist | Beds/Ba | Sqft | Sold | Price | $/sf | Match |
|---|---|---|---|---|---|---|---|
| 302 W Main St | 0.27mi | 2/1.0 (-1) | 1,455 (-0%) | 15mo | $85,000 | $58 | 69 |
| 300 W Main St | 0.26mi | 2/1.0 (-1) | 1,320 (-10%) | 5mo | $165,000 | $125 | 63 |
| 302 E Walnut St | 0.09mi | 3/2.0 | 1,344 (-8%) | 19mo | $35,000 | $26 | 62 |
| 703 S Washington St | 0.24mi | 3/2.0 | 1,545 (+6%) | 24mo | $139,900 | $91 | 56 |
| 511 W Wood St | 0.51mi | 2/1.0 (-1) | 1,342 (-8%) | 15mo | $79,900 | $60 | 45 |
| 501 W Oak St | 0.35mi | 2/2.0 (-1) | 1,276 (-13%) | 21mo | $89,000 | $70 | 36 |
Match score weights: distance 35% · size 25% · config 20% · recency 20%. Top-matched comps best support the ARV.
Projected returns pro-forma
7.87% appreciation · 3.0% rent growth · sell at horizon
- IRR
- 24.3%
- Equity multiple
- 2.76×
- Total profit
- $63,595
- Equity at exit
- $96,876
- IRR
- 22.1%
- Equity multiple
- 5.87×
- Total profit
- $175,835
- Equity at exit
- $191,231
Cash invested: $36,120 (down + closing). Projections, not guarantees.
Landlord ↔ Tenant lean methodology
- Overall (STATE)
- 83 Strongly Landlord-Friendly
- State Kansas
- 83 Strongly Landlord-Friendly · R+10
- County
- — inherits STATE
- City
- — inherits STATE
ZIP-level market 66781
- Home prices YoY
- 4.6%
- Active inventory
- 6
- Price-to-rent
- 8.6×
Monthly cashflow live
- Estimated rent
- $1,252 medium interval (Pro) →
- Mortgage (P&I)
- −$676
- Tax from tax record
- −$77 /mo · $926/yr
- Insurance
- −$54
- HOA
- −$0
- Vacancy / Maint / Mgmt
- −$263
- Net cashflow
- $181
Break-even live
UW: 25.0% down · 7.5% · 30yr · 1.5% tax · 5.0% vac · 8.0% maint · 8.0% mgmt
Financing live
Cash to close
- Down payment
- $32,250
- Closing costs
- $3,870
- Reserves months
- —
- Total cash needed
- —
Loan-product check · same deal, 3 products live
Conventional
25% down · 7.5% · 30yr
- Down + closing
- —
- Monthly P&I
- —
- Monthly cashflow
- —
- DSCR
- —
- Eligible?
- —
Personal DTI + credit; lowest rate.
DSCR
20% down · 8.5% · 30yr
- Down + closing
- —
- Monthly P&I
- —
- Monthly cashflow
- —
- DSCR
- —
- Eligible?
- —
No personal income docs; deal must DSCR.
Hard money
10% down · 12.0% · 12mo
- Down + closing
- —
- Monthly P&I
- —
- Monthly cashflow
- —
- DSCR
- —
- Eligible?
- —
Short-term bridge; refi at stabilization.
Listing history 11 events
-
2026-06-19days on market $129,000 Active 15 DOM
-
2026-06-18days on market $129,000 Active 14 DOM
-
2026-06-17days on market $129,000 Active 13 DOM
-
2026-06-16days on market $129,000 Active 12 DOM
-
2026-06-15days on market $129,000 Active 11 DOM
-
2026-06-14days on market $129,000 Active 9 DOM
-
2026-06-12days on market $129,000 Active 8 DOM
-
2026-06-09days on market $129,000 Active 5 DOM
-
2026-06-08days on market $129,000 Active 4 DOM
-
2026-06-07days on market $129,000 Active 3 DOM
-
2026-06-05$129,000 Active 1 DOM
ⓘ Source: listings_history table (triggers on properties + properties_extension) + one-shot
backfill from property_details.listing_events for pre-trigger history.
Tax reassessment forecast KS · Resets to sale price
- Current annual tax
- $926 · $77/mo
- Projected year-2 tax
- $1,819 · $152/mo
- Expected delta
- +$893/yr (+$74/mo · 96.5%)
ⓘ Screening estimate from a state-policy table — verify with the county assessor before closing.
Climate risk First Street
- Flood 1/10 Low FEMA zone X (unshaded) · 0% chance over 30 yrs
- Wildfire 4/10 Moderate
- Heat 5/10 Major 7 d/yr ≥107°F today · 20 d/yr by 30 yrs out
- Wind 2/10 Low 2% chance of damaging wind over 30 yrs
- Air quality 2/10 Low 1 unhealthy d/yr today · 1 by 30 yrs out
Nearby sold comps map
Loading sold comps map…
Walkable amenities ~0.75 mi
Loading nearby amenities…
Taxation est. · year 1
- Rental income
- $15,018
- − Mortgage interest
- −$7,226
- − Property taxes
- −$926
- − Insurance
- −$645
- − Repairs & maintenance
- −$1,201
- − Management
- −$1,201
- − Depreciation
- −$3,753
- Taxable income
- $66
- Est. tax owed @ 24.0%
- −$16
- After-tax cash flow
- $2,160/yr
For passive investors: Depreciation is non-cash, so a rental often shows a tax loss while cash-flowing — sheltering income. Rental losses are passive: they offset passive income freely, and up to $25,000/yr can offset ordinary (W-2) income if you actively participate and your MAGI is under $100k (phasing out to $0 by $150k); unused losses carry forward. On sale, claimed depreciation is recaptured at up to 25%, and gains may owe capital-gains tax (a 1031 exchange can defer both). Figures are a year-1 estimate at your 24.0% rate — not tax advice; consult a CPA.
Schools (NCES district)
- District
- Cherokee
- NCES district ID
- 2004710
- Math proficiency
- 23% ▼ -3.00%
- Reading proficiency
- 32% ▼ -5.00%
- Median HH income
- $39,749
- Composite
- 23.12/100
- National rank
- #7956
- State rank
- #127 of 169 in KS
Livability — Weir
- Score
- 54/100
- State rank
- #593
- US rank
- #24241
Category grades
Schools grade is shown separately in the Schools card above.
Census & demographics
- Census place
- Weir, KS
- Population (ZIP)
- 1,155
Population outlook (Cherokee County) Hauer SSP2
- Today (2025)
- 18,848 people
- By 2030
- 17,862 · -5.2%
- By 2040
- 15,850 · -15.9%
- By 2050
- 13,915 · -26.2%
- By 2075
- 10,102 · -46.4%
- By 2100
- 6,977 · -63.0%
Race, ethnicity, and origin ACS 2023
- Neighborhood character
- Predominantly White (94%)
- Race & ethnicity
- White 94% Two or more races 6%
- Common ancestry
- Lithuanian 3% English 2% Slovak 2%
- Foreign-born
- 1% · Canada
- Languages at home
- 99% English-only · Spanish 1%
Political lean MEDSL · Cherokee
- 2024 margin
- Solid R (+52.9) · D 22.6% · R 75.5% · Other 1.9%
- 2008→2024 swing
- -29.2pp toward R · 2008: -23.7pp · 2024: -52.9pp
- All cycles
- 2024: R+52.9 2020: R+49.9 2016: R+48.4 2012: R+29.5 2008: R+23.7
Not yet ingested
- Civics
- —
Market trends
- HPI YoY
- ▲ 7.87%
- Current HPI
- 180.0402
- Rent YoY
- —
- Metro
- —
- State GDP YoY
- —
- F500 in state
- 0
Price history
1 event — show timeline
- 2026-06-04 Listed $129,000 Heartland MLS as Distributed by MLS Grid
Property tax history
-0.1%/yrLatest (2025): $926 · +2.6% YoY. Source: county tax records.
Cash-flow waterfall
monthlySold comps — $/sqft
last 12 mo · ≤1 miLoading sold comps…