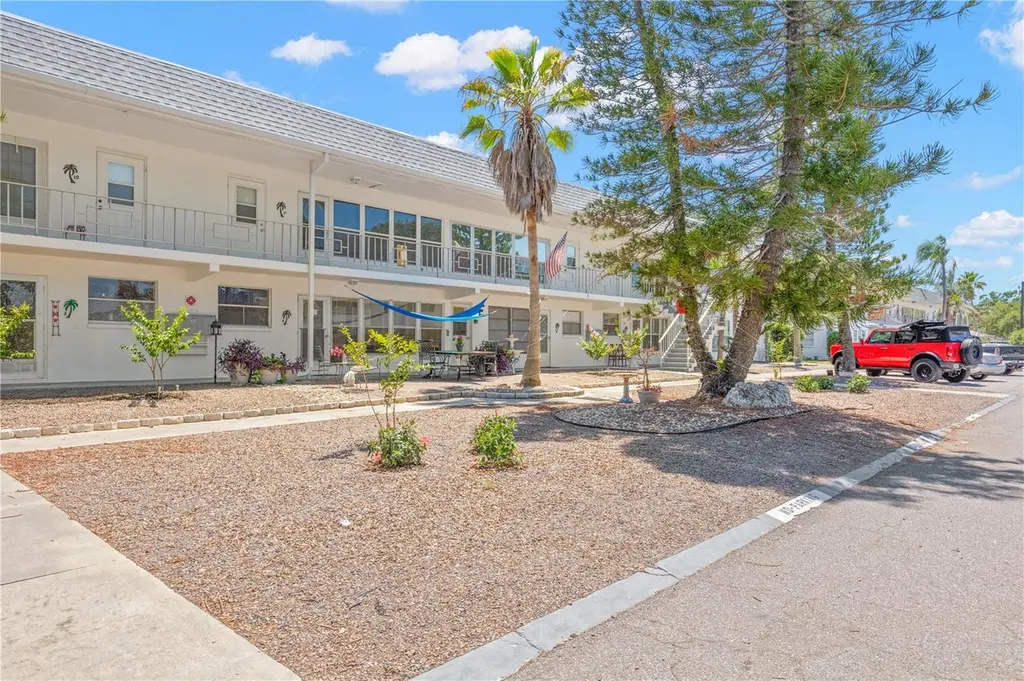
1221 Drew St Unit E12 · Clearwater, FL
Flood risk 1/10 · Minimal
- FEMA flood zone
- X (unshaded)
- Chance of flooding over 30 yrs
- 0.0%
- Est. flood insurance / yr
- $507 – $1,088
Fire risk 1/10 · Minimal
- Est. fire insurance / yr
- $947 – $1,759
Heat risk 10/10 · Severe
- Hot days now (above 107°F)
- 7 days/yr
- Hot days in 30 yrs
- 27 days/yr
Wind risk 10/10 · Severe
- Chance of severe wind over 30 yrs
- 99.0%
Air-quality risk 3/10 · Minor
- Unhealthy air days now
- 2 days/yr
- Unhealthy air days in 30 yrs
- 3 days/yr
Risk factors via First Street. Map © Google.
Why this score? — see what drove the C- grade
The composite is a weighted blend of 9 inputs, each scored 0–100. Each bar is that input's sub-score; the figure is the points it added to the 100-point composite (weight × sub-score).
- Cash flow +17.0/30.0
- 1% rule +10.0/10.0
- ARV discount +7.5/15.0
- DSCR +5.3/10.0
- Schools +4.3/10.0
- Livability +4.1/5.0
- Condition / age +2.5/5.0
- Rent growth +2.0/5.0
- Appreciation +0.0/10.0
$94,000
🖨 Deal sheet 📄 Offer letter ✓ Due diligence
Listing remarks
Under contract-accepting backup offers. One or more photo(s) has been virtually staged. NON-FLOOD ZONE, NO EVACUATION ZONE!! Welcome home to this beautifully maintained 2 bedroom, 1 bath condo co-op located on the 2nd floor with NO NEIGHBORS ABOVE in this desirable 55+ community near Downtown Clearwater! MOVE-IN READY and EXCEPTIONALLY CLEAN, this bright and inviting home offers a spacious open layout designed for comfortable low-maintenance living. The living room features a wall of sliding glass doors with vertical blinds that lead to an OVERSIZED ENCLOSED LANAI with upgraded windows, creating the perfect space for your morning coffee. Open up the windows to enjoy the fresh air and Florid
Key facts
- No neighbors above
- Non flood zone
- No evacuation zone
Tags
Property features AI
Finance
- Other: Lease restrictions apply
- Financial info: Total monthly fees $544; total annual fees $6,528
- HOA & community: Monthly HOA fee of $544 covering cable TV, common area taxes, reserves, insurance, internet, structure and grounds maintenance, management, pest control, sewer, trash and water; HOA required with association approval; Association amenities include laundry; Community features include community mailbox, sidewalks, street lights, deed restrictions, special community restrictions; buyer approval required; senior community; pets not allowed
Exterior
- Parking: Assigned parking; Guest parking
- Utilities: Public water; Public sewer; Cable connected; High-speed/BB internet available; Electricity connected; Sewer connected; Water connected; Fire hydrant nearby
- Home design: Residential condominium; Completed condition; Second-floor unit; Faces north; One level
- Construction: Block construction; Membrane roof; Slab foundation; Built on lot within a 3-acre property
- Exterior features: Balcony; Exterior lighting; Sidewalk; Sliding doors
Interior
- Kitchen: Microwave; Range; Refrigerator
- Bedrooms: 2 bedrooms
- Flooring: Laminate flooring; Tile flooring
- Bathrooms: 1 full bathroom
- Heating & cooling: Central heating (electric); Central air conditioning
- Interior features: Ceiling fans; Stone countertops; Blinds on windows
- Laundry & utility: Common area laundry; Electric water heater
Neighborhood map
What this means for you Summary
Snapshot
- This is a 2-bed/1.0-bath condo listed at $94k.
Deal economics
- At list price, monthly cash flow is $63 ($760/yr) — positive.
- The deal already cash-flows at list — no discount required.
- Meets the 1% rule at list price ($2k rent vs $94k).
- Cap rate 7.1% vs local median 2.9% in Clearwater — top-decile yield for the area; either an underpriced asset or a hidden risk that comps aren't pricing in. Stress-test before assuming the spread holds.
Location & tenants
- Location reads 82/100 on livability (#60 in FL, #988 nationally) — a professional / high-income tenant draw. Strengths: commute A+, housing A+, health & safety A+; Watch: schools C-, employment C-.
- Pinellas (suburban): math 51% / reading 51% proficiency, ranked #31 of 73 in FL (top 42%) — acceptable for families but not a draw, mixed tenant base, ~2y average lease.
- Market conditions: Rents soft (-2.2%/yr); 261 active listings in the ZIP; 40 comparable units currently listed for rent nearby; rentals at typical pace (median 15d on market — plan ~3-4 weeks tenant-placement turnaround); 2,676 units permitted in Pinellas County in 2024 (1,422 in 5+ unit buildings).
- This rent runs 31% of the median local income ($63k/yr) — at the standard rent-burdened threshold; future hikes will face affordability resistance.
Forward outlook
- Local home prices are declining (-3.0%/yr); year-one equity from $650 of loan paydown is wiped out by about $3k of value loss. Plan a longer hold.
- Pinellas County population projected at +14% by 2050 — modest demand growth; plan on rents tracking national, not racing it.
Negotiation context
- Only 8 days on market — expect competitive offers; lowballing is unlikely to land.
- 5 sale attempts since 10y ago with the ask held roughly flat each time — persistent listings suggest the price (not the market) is what's stuck; bring a comps-based counter.
Risks & watch-outs
- Watch-outs: HOA is 34% of rent.
- Climate carrying-cost: severe wind risk, 99% chance of damaging wind over 30y; extreme-heat days projected 7→27/yr by 2055 (HVAC capex compounding) — expect insurance premiums to compound above CPI over the hold.
Questions for the listing agent
- Built in 1967 — when were the roof, HVAC, electrical panel, plumbing, and water heater last replaced?
- What does the HOA fee cover, when was the last increase, and are there any pending special assessments or reserve-fund shortfalls?
- Any open or pending special assessments — roof, HVAC, plumbing, elevator, façade? What's the per-unit balance and payoff schedule, and is the seller paying it off at close or rolling it to the buyer?
- Is there a deadline driving the sale (1031 exchange, divorce, estate, relocation)? That informs how much negotiation room exists.
- What's the average days-on-market for RENTAL listings here right now (not sales)? A rising rental-DOM trend means longer vacancies and softer asking-rent achievability than the comps imply.
- What's the recent tenant-quality profile in this submarket — average credit score on applications, eviction rate, late-payment / NSF rate, and stable-employment percentage? A property-management company in the area should have these aggregated.
- How much new apartment / multifamily construction is in the pipeline within 1–3 miles? Heavy new supply (>2% of stock underway) typically softens rents 12–24 months out; light construction supports rent growth.
Investment metrics
- 1% rule
- 1.71% ✓
- Cap rate
- 7.10%
- Cash-on-cash
- 2.89%
- DSCR
- 1.13
- GRM
- 4.9
CMA / ARV
No comps found within radius.
Projected returns pro-forma
-3.0% appreciation · 0.0% rent growth · sell at horizon
- IRR
- -17.6%
- Equity multiple
- 0.41×
- Total profit
- $-15,550
- Equity at exit
- $14,016
- IRR
- -27.3%
- Equity multiple
- 0.05×
- Total profit
- $-25,091
- Equity at exit
- $8,127
Cash invested: $26,320 (down + closing). Projections, not guarantees.
Landlord ↔ Tenant lean methodology
- Overall (STATE)
- 87 Strongly Landlord-Friendly
- State Florida
- 87 Strongly Landlord-Friendly · R+3
- County
- — inherits STATE
- City
- — inherits STATE
ZIP-level market 33755
- Rents YoY
- -2.2%
- Active inventory
- 261
- Price-to-rent
- 4.9×
Monthly cashflow live
- Estimated rent
- $1,610 high interval (Pro) →
- Mortgage (P&I)
- −$493
- Tax from tax record
- −$133 /mo · $1,592/yr
- Insurance
- −$39
- HOA
- −$544
- Vacancy / Maint / Mgmt
- −$338
- Net cashflow
- $63
Break-even live
UW: 25.0% down · 7.5% · 30yr · 1.5% tax · 5.0% vac · 8.0% maint · 8.0% mgmt
Financing live
Cash to close
- Down payment
- $23,500
- Closing costs
- $2,820
- Reserves months
- —
- Total cash needed
- —
Loan-product check · same deal, 3 products live
Conventional
25% down · 7.5% · 30yr
- Down + closing
- —
- Monthly P&I
- —
- Monthly cashflow
- —
- DSCR
- —
- Eligible?
- —
Personal DTI + credit; lowest rate.
DSCR
20% down · 8.5% · 30yr
- Down + closing
- —
- Monthly P&I
- —
- Monthly cashflow
- —
- DSCR
- —
- Eligible?
- —
No personal income docs; deal must DSCR.
Hard money
10% down · 12.0% · 12mo
- Down + closing
- —
- Monthly P&I
- —
- Monthly cashflow
- —
- DSCR
- —
- Eligible?
- —
Short-term bridge; refi at stabilization.
Rent comps 40 comps
| Address | Beds | Baths | Sqft | Rent | $/sqft | DOM | Units | Dist |
|---|---|---|---|---|---|---|---|---|
| 1221 Drew St Unit A21 Clearwater, FL | 2.0 | 1.0 | 705 | $1,300 | $1.84 | 3d | 1 | 0.02mi |
| 1221 Drew St Clearwater, FL | 1.0 | 1.0 | 777 | $1,600 | $2.06 | 22d | 1 | 0.03mi |
| 1257 Drew St #1 Clearwater, FL | 2.0 | 1.0 | 1055 | $1,750 | $1.66 | 24d | 1 | 0.08mi |
| 124 N Jefferson Ave Unit 5 Clearwater, FL | 1.0 | 1.0 | 750 | $1,345 | $1.79 | 24d | 1 | 0.08mi |
| 124 N Jefferson Ave Unit 2 Clearwater, FL | 1.0 | 1.0 | 750 | $1,395 | $1.86 | 24d | 1 | 0.08mi |
| 1233 Grove St Clearwater, FL | 1.0 | 1.0 | 540 | $1,350 | $2.50 | 24d | 1 | 0.10mi |
| 200 N Betty Ln Unit 3E Clearwater, FL | 1.0 | 1.0 | 875 | $1,200 | $1.37 | 3d | 1 | 0.11mi |
| 1260 Cleveland St Clearwater, FL | 1.0 | 1.0 | 617 | $1,432 | $2.32 | 3d | 2 | 0.16mi |
| 1329 Drew St #6 Clearwater, FL | 2.0 | 1.0 | 850 | $1,495 | $1.76 | 4d | 1 | 0.25mi |
| 100 Waverly Way #403 Clearwater, FL | 2.0 | 2.0 | 900 | $1,600 | $1.78 | 18d | 1 | 0.28mi |
| 1345 Drew St #16 Clearwater, FL | 2.0 | 1.0 | 925 | $1,500 | $1.62 | 24d | 1 | 0.29mi |
| 106 S Fredrica Ave Clearwater, FL | 2.0 | 1.0 | 836 | $1,350 | $1.61 | 22d | 1 | 0.30mi |
| 1103 Drew St Clearwater, FL | 1.0 | 1.0 | 580 | $1,250 | $2.16 | 8d | 1 | 0.34mi |
| 135 N Martin Luther King Jr Ave Clearwater, FL | 1.0 | 1.0 | 650 | $1,195 | $1.84 | 18d | 1 | 0.34mi |
| 1100 Cleveland St Clearwater, FL | 1.0–2.0 | 1.0–2.5 | 1168 | $2,795 | $2.39 | 3d | 15 | 0.34mi |
| 1365 Drew St #102 Clearwater, FL | 2.0 | 1.0 | 850 | $1,400 | $1.65 | 24d | 1 | 0.34mi |
| 117 N Evergreen Ave Clearwater, FL | 1.0 | 1.0 | 800 | $1,275 | $1.59 | 12d | 1 | 0.35mi |
| 117 N Evergreen Ave Clearwater, FL | 1.0 | 1.0 | 808 | $1,135 | $1.40 | 24d | 2 | 0.35mi |
| 949 Cleveland St Unit C309 Clearwater, FL | 1.0 | 1.0 | 748 | $2,345 | $3.14 | 14d | 1 | 0.48mi |
| 949 Cleveland St Unit C213 Clearwater, FL | 1.0 | 1.0 | 783 | $2,340 | $2.99 | 14d | 1 | 0.48mi |
| 949 Cleveland St Clearwater, FL | 1.0–2.0 | 1.0–2.0 | 820 | $2,595 | $3.16 | 2d | 50 | 0.48mi |
| 404 Pennsylvania Ave Clearwater, FL | 1.0 | 1.0 | 748 | $1,275 | $1.70 | 15d | 1 | 0.49mi |
| 912 Hart St Unit B Clearwater, FL | 3.0 | 1.0 | 840 | $1,545 | $1.84 | 22d | 1 | 0.50mi |
| 1221 Court St Unit 1 Clearwater, FL | 2.0 | 1.0 | 1000 | $1,800 | $1.80 | 24d | 1 | 0.51mi |
| 906 Jones St Apt A Clearwater, FL | 1.0 | 1.0 | 700 | $1,200 | $1.71 | 8d | 1 | 0.52mi |
| 905 Jones St Clearwater, FL | 3.0 | 2.0 | 1072 | $2,450 | $2.29 | 24d | 1 | 0.52mi |
| 905 Jones St Clearwater, FL | 2.0 | 1.0 | 660 | $1,700 | $2.58 | 11d | 1 | 0.52mi |
| 27 N San Remo Ave Unit A Clearwater, FL | 2.0 | 1.0 | 625 | $1,297 | $2.08 | 3d | 1 | 0.55mi |
| 1458 Grove St Clearwater, FL | 1.0 | 1.0 | 625 | $1,295 | $2.07 | 22d | 1 | 0.56mi |
| 1003 West Ave Clearwater, FL | 2.0 | 1.0 | 800 | $1,195 | $1.49 | 3d | 4 | 0.56mi |
| 1458 Cleveland St Clearwater, FL | 1.0 | 1.0 | 750 | $1,300 | $1.73 | 4d | 1 | 0.58mi |
| 1458 Cleveland St Clearwater, FL | 1.0 | 1.0 | 750 | $1,300 | $1.73 | 3d | 1 | 0.58mi |
| 600 S Betty Ln Apt 7 Clearwater, FL | 1.0 | 1.0 | 680 | $1,225 | $1.80 | 24d | 1 | 0.63mi |
| 1482 Cleveland St Clearwater, FL | 3.0 | 2.0 | 1110 | $2,750 | $2.48 | 4d | 1 | 0.63mi |
| 711 S Lincoln Ave Clearwater, FL | 1.0–2.0 | 1.0 | 860 | $1,660 | $1.93 | 2d | 8 | 0.64mi |
| 1100 Turner St Clearwater, FL | 1.0 | 1.5 | 900 | $1,750 | $1.94 | 3d | 2 | 0.64mi |
| 1485 Cleveland St Clearwater, FL | 3.0 | 1.0 | 978 | $2,200 | $2.25 | 4d | 1 | 0.64mi |
| 1477 Pierce St Clearwater, FL | 2.0 | 1.0 | 650 | $1,575 | $2.42 | 24d | 1 | 0.66mi |
| 1009 Pine Brook Dr Unit B Clearwater, FL | 2.0 | 2.0 | 1000 | $2,200 | $2.20 | 22d | 1 | 0.67mi |
| 612 Sally Ln S Unit 14 Clearwater, FL | 1.0 | 1.0 | 750 | $1,500 | $2.00 | 24d | 1 | 0.68mi |
HOA detail condo
- Monthly dues
- $544 · $6,528/yr
- Likely covers
- water
- Assessments
- None detected in remarks — confirm with the listing agent.
Listing history 17 events
-
2026-05-20$94,000 Active
-
2025-09-29historical
-
2025-07-25price $96,000
-
2025-05-09$104,000 Active
-
2024-03-25historical
-
2024-02-28price $135,500
-
2024-02-01price $137,500
-
2024-01-19price $139,500
-
2023-11-11price $140,000
-
2023-09-29$142,000 Active
-
2023-01-18soldstatus $89,500 Closed
-
2022-12-22status Pending
-
2022-10-14price $99,900
-
2022-08-23$104,900 Active
-
2016-05-01historical
-
2016-01-30$35,500 Active
-
1994-01-01soldstatus $18,000
ⓘ Source: listings_history table (triggers on properties + properties_extension) + one-shot
backfill from property_details.listing_events for pre-trigger history.
Tax reassessment forecast FL · Resets to sale price
- Current annual tax
- $1,592 · $133/mo
- Projected year-2 tax
- $1,592 · $133/mo
- Expected delta
- $0/yr ($0/mo · 0.0%)
ⓘ Screening estimate from a state-policy table — verify with the county assessor before closing.
Climate risk First Street
- Flood 1/10 Low FEMA zone X (unshaded) · 0% chance over 30 yrs
- Wildfire 1/10 Low
- Heat 10/10 Extreme 7 d/yr ≥107°F today · 27 d/yr by 30 yrs out
- Wind 10/10 Extreme 99% chance of damaging wind over 30 yrs
- Air quality 3/10 Moderate 2 unhealthy d/yr today · 3 by 30 yrs out
Nearby sold comps map
Loading sold comps map…
Walkable amenities ~0.75 mi
Loading nearby amenities…
Taxation est. · year 1
- Rental income
- $19,323
- − Mortgage interest
- −$5,265
- − Property taxes
- −$1,592
- − Insurance
- −$470
- − Repairs & maintenance
- −$1,546
- − Management
- −$1,546
- − HOA
- −$6,528
- − Depreciation
- −$2,735
- Taxable loss
- −$359
- Est. tax savings @ 24.0%
- +$86
- After-tax cash flow
- $846/yr
For passive investors: Depreciation is non-cash, so a rental often shows a tax loss while cash-flowing — sheltering income. Rental losses are passive: they offset passive income freely, and up to $25,000/yr can offset ordinary (W-2) income if you actively participate and your MAGI is under $100k (phasing out to $0 by $150k); unused losses carry forward. On sale, claimed depreciation is recaptured at up to 25%, and gains may owe capital-gains tax (a 1031 exchange can defer both). Figures are a year-1 estimate at your 24.0% rate — not tax advice; consult a CPA.
Schools (NCES district)
- District
- Pinellas
- NCES district ID
- 1201560
- Math proficiency
- 51% ▼ -5.00%
- Reading proficiency
- 51% ▼ -3.00%
- Median HH income
- $46,270
- Composite
- 43.27/100
- National rank
- #3046
- State rank
- #31 of 73 in FL
Livability — Clearwater
- Score
- 82/100
- State rank
- #60
- US rank
- #988
Category grades
Schools grade is shown separately in the Schools card above.
Census & demographics
- Census place
- Clearwater, FL
- County
- Pinellas County · 939,478 people
- City population
- 170,933
- Metro
- Tampa-St. Petersburg-Clearwater, FL
- Population (ZIP)
- 27,476
- Household income
- $62,886
- Rent vs Own
- Severe rent burden
- 1511.0
Population outlook (Pinellas County) Hauer SSP2
- Today (2025)
- 1,027,532 people
- By 2030
- 1,063,586 · +3.5%
- By 2040
- 1,125,020 · +9.5%
- By 2050
- 1,168,637 · +13.7%
- By 2075
- 1,265,188 · +23.1%
- By 2100
- 1,260,357 · +22.7%
Race, ethnicity, and origin ACS 2023
- Neighborhood character
- Diverse neighborhood (Simpson 0.63)
- Race & ethnicity
- White 54% Black 22% Hispanic / Latino 17% Two or more races 10% Asian 3%
- Hispanic origin (detail)
- Mexican 6% Puerto Rican 5% Cuban 1%
- Common ancestry
- Romanian 2% Italian 2% Arab 1%
- Foreign-born
- 15% · Canada
- Languages at home
- 78% English-only · Spanish 13% Other Indo-European 3% Russian/Polish/Slavic 2%
Political lean MEDSL · Pinellas
- 2024 margin
- Lean R (+5.2) · D 46.9% · R 52.1%
- 2008→2024 swing
- -13.5pp toward R · 2008: 8.3pp · 2024: -5.2pp
- All cycles
- 2024: R+5.2 2020: D+0.2 2016: R+1.1 2012: D+5.6 2008: D+8.3
Not yet ingested
- Civics
- —
Market trends
- HPI YoY
- ▼ -472.62%
- Current HPI
- 351.4973
- Rent YoY
- ▼ -2.20%
- Metro
- Tampa-St. Petersburg-Clearwater, FL
- State GDP YoY
- ▲ 3.28%
- F500 in state
- 36
Industry mix (Fortune 500 HQ in FL)
| Industry | F500 HQs | Revenue |
|---|---|---|
| Industrial Technology | 2 | $29B |
|
||
| Insurance | 2 | $17B |
|
||
| Retail | 1 | $60B |
|
||
| Technology Distribution | 1 | $58B |
|
||
| Homebuilding | 1 | $35B |
|
||
| Technology Manufacturing | 1 | $35B |
|
||
Price history
+422.2% since first listed17 events — show timeline
- 2026-05-20 Listed $94,000 Stellar MLS as Distributed by MLS Grid
- 2025-09-29 Listing Removed — Stellar MLS as Distributed by MLS Grid
- 2025-07-25 Price Changed $96,000 Stellar MLS as Distributed by MLS Grid
- 2025-05-09 Listed $104,000 Stellar MLS as Distributed by MLS Grid
- 2024-03-25 Listing Removed — Stellar MLS as Distributed by MLS Grid
- 2024-02-28 Price Changed $135,500 Stellar MLS as Distributed by MLS Grid
- 2024-02-01 Price Changed $137,500 Stellar MLS as Distributed by MLS Grid
- 2024-01-19 Price Changed $139,500 Stellar MLS as Distributed by MLS Grid
- 2023-11-11 Price Changed $140,000 Stellar MLS as Distributed by MLS Grid
- 2023-09-29 Listed $142,000 Stellar MLS as Distributed by MLS Grid
- 2023-01-18 Sold (MLS) $89,500 Stellar MLS as Distributed by MLS Grid
- 2022-12-22 Pending — Stellar MLS as Distributed by MLS Grid
- 2022-10-14 Price Changed $99,900 Stellar MLS as Distributed by MLS Grid
- 2022-08-23 Listed $104,900 Stellar MLS as Distributed by MLS Grid
- 2016-05-01 Listing Removed — Stellar MLS as Distributed by MLS Grid
- 2016-01-30 Listed $35,500 Stellar MLS as Distributed by MLS Grid
- 1994-01-01 Sold (Public Records) $18,000 Public Records
Property tax history
+10.7%/yrLatest (2025): $1,592 · -2.0% YoY. Source: county tax records.
Cash-flow waterfall
monthlySold comps — $/sqft
last 12 mo · ≤1 miLoading sold comps…