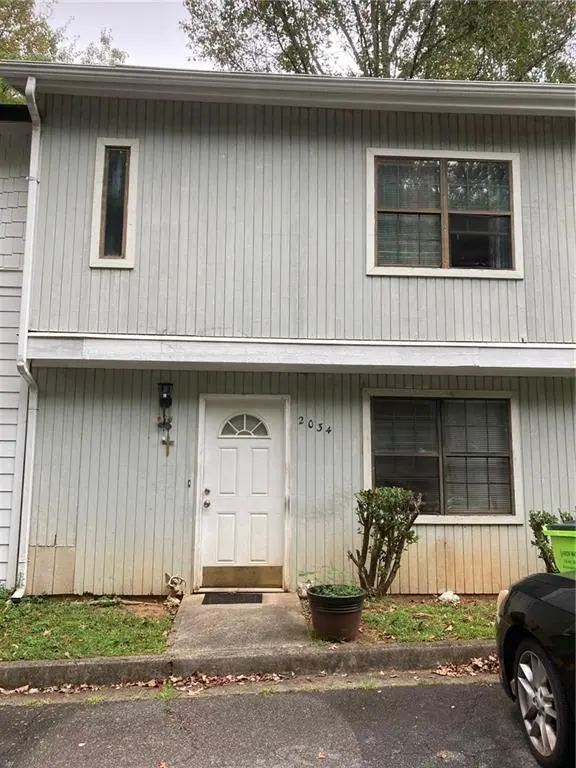
2034 Drennon Ave · Austell, GA
Flood risk 1/10 · Minimal
- FEMA flood zone
- X (unshaded)
- Chance of flooding over 30 yrs
- 0.0%
- Est. flood insurance / yr
- $507 – $1,088
Fire risk 2/10 · Minimal
- Est. fire insurance / yr
- $963 – $1,789
Heat risk 5/10 · Moderate
- Hot days now (above 103°F)
- 7 days/yr
- Hot days in 30 yrs
- 17 days/yr
Wind risk 5/10 · Moderate
- Chance of severe wind over 30 yrs
- 25.0%
Air-quality risk 4/10 · Minor
- Unhealthy air days now
- 4 days/yr
- Unhealthy air days in 30 yrs
- 5 days/yr
Risk factors via First Street. Map © Google.
Why this score? — see what drove the C+ grade
The composite is a weighted blend of 9 inputs, each scored 0–100. Each bar is that input's sub-score; the figure is the points it added to the 100-point composite (weight × sub-score).
- Cash flow +23.9/30.0
- ARV discount +10.5/15.0
- DSCR +7.7/10.0
- 1% rule +5.7/10.0
- Schools +3.8/10.0
- Livability +3.4/5.0
- Rent growth +2.8/5.0
- Condition / age +2.5/5.0
- Appreciation +0.0/10.0
$159,999
🖨 Deal sheet 📄 Offer letter ✓ Due diligence
Listing remarks MLS
HUD HOMES ARE "SOLD AS-IS". INFORMATION DEEMED RELIABLE BUT NOT GUARANTEED. SELLING BROKER TO VERIFY ALL INFORMATION. BIDS OVER "AS-IS" VALUE W/FHA REQUIRES CASH PAID AT CLOSING FOR OVERBID AMOUNT. EQUAL HOUSING OPPORTUNITY. CASE# 105-145272. FHA FINANCING: IE (INSURED ESCROW) $2365
Key facts
- High demand area
- Cornet trail
- 2 parking spots
Tags
Property features AI
Finance
- Other: Asphalt road frontage on a city street; GPS-friendly directions
- HOA & community: Community includes sidewalks, street lights, nearby trails/greenway and proximity to public transport; Community has 2,034 units
Exterior
- Parking: Two total parking spaces; Assigned parking; Driveway with level access; Open parking available
- Utilities: Public water; Public sewer; 110-volt electric; Cable available; Electricity available; Natural gas available; Phone available
- Home design: One level; Fee simple ownership; Resale condition
- Construction: HardiPlank and wood siding; Shingle roof; Slab foundation
- Exterior features: Private entrance; Private yard; Rear porch; Outdoor lighting; Back yard fencing; Pond on property
Interior
- Kitchen: Dishwasher; Disposal; Electric oven; Electric range; Cabinets and other counter surfaces; Open-concept dining area
- Bedrooms: Two upper-level bedrooms; Roommate floor plan
- Flooring: Carpet; Laminate; Other
- Bathrooms: Two full bathrooms; One half bathroom (main level); Master bath with tub/shower combo
- Heating & cooling: Central heating; Central air
- Interior features: Walk-in closets; Double-pane windows; 2+ common walls
- Laundry & utility: Laundry in hall
Neighborhood map
What this means for you Summary
Snapshot
- This is a 2-bed/1.5-bath townhouse listed at $160k.
Deal economics
- At list price, monthly cash flow is $311 ($4k/yr) — positive.
- The deal already cash-flows at list — no discount required.
- Meets the 1% rule at list price ($2k rent vs $160k).
- Recommended offer: $155k (3.0% below list) — sets the bar for market timing.
- Cap rate 8.6% vs local median 4.7% in Austell — top-decile yield for the area; either an underpriced asset or a hidden risk that comps aren't pricing in. Stress-test before assuming the spread holds.
Location & tenants
- Location reads 67/100 on livability (#175 in GA) — a middle-class / working-renter tenant base. Strengths: cost of living A+, housing A+; Watch: employment D+, amenities F, commute F.
- Cobb County (suburban): math 39% / reading 45% proficiency, ranked #25 of 174 in GA (top 14%) — families likely to look elsewhere, expect single-tenant / working-renter base with shorter leases.
- Zoned schools: Sanders Elementary School (math 19% / reading 22%, grade F, #860 of 1,228 statewide, top 70%, 620 students, 82% FRL); Garrett Middle School (math 15% / reading 21%, grade F, #375 of 470 statewide, top 80%, 906 students, 85% FRL); South Cobb High School (math 21% / reading 20%, grade F, #231 of 424 statewide, top 54%, 2,127 students, 67% FRL) — zoned schools average 78% FRL vs 39% district-wide (39 pts higher); higher-poverty schools than district average — tighter screening recommended.
- Zoned-school proficiency averages 20% at this address vs 42% district-wide (-22 pts) — the specific schools serving this property underperform the Cobb County average; the district grade overstates school quality for this exact location.
- Market conditions: Rents rising (+1.3%/yr); 184 active listings in the ZIP; 28 comparable units currently listed for rent nearby; rentals leasing fast (median 11d on market — plan ~1-2 weeks tenant-placement turnaround); 1,625 units permitted in Cobb County in 2024 (389 in 5+ unit buildings).
Forward outlook
- Local home prices are declining (-3.0%/yr); year-one equity from $1k of loan paydown is wiped out by about $5k of value loss. Plan a longer hold.
- Cobb County population projected at +33% by 2050 — long-run rental-demand tailwind backs the buy-and-hold thesis.
Negotiation context
- It's been on market 43 days — a 3% lower offer ($155k) is reasonable based on typical stale-listing flexibility.
- 3 sale attempts since 13y ago; this cycle's ask is 3% above the opening price — seller raised mid-cycle; expect resistance to lowballs.
- Current owner paid $25k; list at $160k implies a 540% gain — meaningful room to come down on a strong offer.
Risks & watch-outs
- Climate carrying-cost: moderate wind risk, 25% chance of damaging wind over 30y; extreme-heat days projected 7→17/yr by 2055 (HVAC capex compounding) — expect insurance premiums to compound above CPI over the hold.
Questions for the listing agent
- It's been on market 43 days. Have you received any prior offers? Is the seller open to a 3% concession, seller financing, or rate buy-down credit?
- Is there a deadline driving the sale (1031 exchange, divorce, estate, relocation)? That informs how much negotiation room exists.
- Schools are D-rated, which usually means shorter tenancies and higher turnover. Who's the typical renter profile here, and what's been the actual vacancy rate?
- What's the average days-on-market for RENTAL listings here right now (not sales)? A rising rental-DOM trend means longer vacancies and softer asking-rent achievability than the comps imply.
- What's the recent tenant-quality profile in this submarket — average credit score on applications, eviction rate, late-payment / NSF rate, and stable-employment percentage? A property-management company in the area should have these aggregated.
- How much new for-sale + rental construction is in the pipeline within 1–3 miles? Heavy new supply typically softens prices + rents 12–24 months out; constrained supply supports both.
Investment metrics
- 1% rule
- 1.07% ✓
- Cap rate
- 8.62%
- Cash-on-cash
- 8.33%
- DSCR
- 1.37
- GRM
- 7.8
CMA / ARV
- ARV (median comp)
- $171,429
- List price
- $159,999
- Delta
- -6.67%
- Verdict
- FAIR
- Comps
- 17 within 1.0 mi
Show comp detail 7 sales within ~0.75 mi
| Address | Dist | Beds/Ba | Sqft | Sold | Price | $/sf | Match |
|---|---|---|---|---|---|---|---|
| 2075 Lenoa Ln | 0.10mi | 2/2.5 | 1,078 (0%) | 1mo | $113,000 | $105 | 90 |
| 2012 Drennon Ave | 0.06mi | 2/2.5 | 1,056 (-2%) | 4mo | $179,000 | $170 | 86 |
| 1984 Padgett Dr | 0.09mi | 2/2.5 | 1,084 (+1%) | 7mo | $139,000 | $128 | 86 |
| 2020 Drennon Ave | 0.04mi | 2/2.5 | 1,078 (0%) | 13mo | $205,000 | $190 | 83 |
| 2102 Lenoa Ln | 0.15mi | 2/2.5 | 1,078 (0%) | 11mo | $206,000 | $191 | 80 |
| 2044 Lenoa Ln | 0.14mi | 2/2.5 | 1,078 (0%) | 15mo | $152,000 | $141 | 77 |
| 2070 Lenoa Ln | 0.12mi | 2/2.5 | 1,078 (0%) | 24mo | $205,000 | $190 | 70 |
Match score weights: distance 35% · size 25% · config 20% · recency 20%. Top-matched comps best support the ARV.
Projected returns pro-forma
-3.0% appreciation · 1.3% rent growth · sell at horizon
- IRR
- -5.5%
- Equity multiple
- 0.80×
- Total profit
- $-9,023
- Equity at exit
- $23,856
- IRR
- 2.1%
- Equity multiple
- 1.14×
- Total profit
- $6,160
- Equity at exit
- $13,834
Cash invested: $44,800 (down + closing). Projections, not guarantees.
Landlord ↔ Tenant lean methodology
- Overall (STATE)
- 90 Strongly Landlord-Friendly
- State Georgia
- 90 Strongly Landlord-Friendly · R+3
- County
- — inherits STATE
- City
- — inherits STATE
ZIP-level market 30106
- Home prices YoY
- -33.4%
- Rents YoY
- 1.3%
- Active inventory
- 184
- Price-to-rent
- 7.8×
Monthly cashflow live
- Estimated rent
- $1,712 high interval (Pro) →
- Mortgage (P&I)
- −$839
- Tax from tax record
- −$136 /mo · $1,633/yr
- Insurance
- −$67
- HOA
- −$0
- Vacancy / Maint / Mgmt
- −$360
- Net cashflow
- $311
Break-even live
UW: 25.0% down · 7.5% · 30yr · 1.5% tax · 5.0% vac · 8.0% maint · 8.0% mgmt
Financing live
Cash to close
- Down payment
- $40,000
- Closing costs
- $4,800
- Reserves months
- —
- Total cash needed
- —
Loan-product check · same deal, 3 products live
Conventional
25% down · 7.5% · 30yr
- Down + closing
- —
- Monthly P&I
- —
- Monthly cashflow
- —
- DSCR
- —
- Eligible?
- —
Personal DTI + credit; lowest rate.
DSCR
20% down · 8.5% · 30yr
- Down + closing
- —
- Monthly P&I
- —
- Monthly cashflow
- —
- DSCR
- —
- Eligible?
- —
No personal income docs; deal must DSCR.
Hard money
10% down · 12.0% · 12mo
- Down + closing
- —
- Monthly P&I
- —
- Monthly cashflow
- —
- DSCR
- —
- Eligible?
- —
Short-term bridge; refi at stabilization.
Rent comps 28 comps
| Address | Beds | Baths | Sqft | Rent | $/sqft | DOM | Units | Dist |
|---|---|---|---|---|---|---|---|---|
| 1975 Padgett Dr Unit 1 Austell, GA | 2.0 | 2.5 | 1200 | $1,449 | $1.21 | 22d | 1 | 0.05mi |
| 2051 Lenoa Ln Austell, GA | 2.0 | 2.5 | 1078 | $1,600 | $1.48 | 5d | 1 | 0.08mi |
| 4649 Danna Dr Austell, GA | 3.0 | 2.0 | 1438 | $1,765 | $1.23 | 24d | 1 | 0.24mi |
| 4236 Austell Rd Austell, GA | 1.0–2.0 | 1.0–2.0 | 1050 | $1,623 | $1.55 | 2d | 17 | 0.47mi |
| 2141 Sandalwood Ln SW Austell, GA | 3.0 | 2.0 | 1475 | $2,136 | $1.45 | 15d | 1 | 0.47mi |
| 2105 Mesa Valley Way Austell, GA | 1.0–3.0 | 1.0–2.0 | 1102 | $1,672 | $1.52 | 2d | 35 | 0.51mi |
| 1650 Anderson Mill Rd Austell, GA | 1.0–3.0 | 1.0–2.0 | 1026 | $1,492 | $1.45 | 2d | 22 | 0.56mi |
| 1707 Virginia Cir SW Mableton, GA | 3.0 | 2.0 | 1235 | $1,835 | $1.49 | 24d | 1 | 0.81mi |
| 1899 Mulkey Rd Austell, GA | 1.0–3.0 | 1.0–2.0 | 990 | $1,416 | $1.43 | 3d | 7 | 0.94mi |
| 3759 Mulkey Cir SW Marietta, GA | 3.0 | 1.5 | 1216 | $1,600 | $1.32 | 44d | 1 | 1.02mi |
| 1820 Mulkey Rd Austell, GA | 1.0–3.0 | 1.0–2.0 | 970 | $1,468 | $1.51 | 2d | 19 | 1.13mi |
| 2222 East-West Connector Austell, GA | 1.0–3.0 | 1.0–2.0 | 1143 | $1,450 | $1.27 | 44d | 30 | 1.17mi |
| 3730 Silver Leaf Ct SW Marietta, GA | 3.0 | 2.0 | 1248 | $2,250 | $1.80 | 44d | 1 | 1.26mi |
| 3755 Medical Park Dr Austell, GA | 1.0–2.0 | 1.0–2.0 | 979 | $1,636 | $1.67 | 5d | 13 | 1.29mi |
| 5128 Lakeview Ct Austell, GA | 2.0 | 1.5 | 1080 | $1,605 | $1.49 | 13d | 1 | 1.34mi |
| 3890 Floyd Rd Unit B1 Austell, GA | 2.0 | 2.5 | 1461 | $2,801 | $1.92 | 44d | 1 | 1.38mi |
| 3561 Ashley Station Dr SW #3561 Marietta, GA | 2.0 | 2.5 | 1160 | $1,500 | $1.29 | 44d | 1 | 1.38mi |
| 2020 Annette Ln Austell, GA | 3.0 | 2.0 | 1452 | $1,900 | $1.31 | 24d | 1 | 1.38mi |
| 3753 Austell Rd SW Unit C1 Austell, GA | 3.0 | 2.0 | 1391 | $2,375 | $1.71 | 3d | 1 | 1.39mi |
| 3753 Austell Rd SW Unit B2 Austell, GA | 2.0 | 2.0 | 1094 | $2,279 | $2.08 | 3d | 1 | 1.39mi |
| 3753 Austell Rd SW Unit A1 Austell, GA | 1.0 | 1.0 | 718 | $1,884 | $2.62 | 3d | 1 | 1.39mi |
| 3753 Austell Rd Austell, GA | 1.0–3.0 | 1.0–2.0 | 1110 | $2,199 | $1.98 | 1d | 89 | 1.39mi |
| 2347 Glencairn Ln SW Marietta, GA | 3.0 | 2.0 | 1486 | $1,831 | $1.23 | 5d | 1 | 1.42mi |
| 3890 Floyd Rd Unit B2 Austell, GA | 2.0 | 2.0 | 1094 | $2,393 | $2.19 | 44d | 1 | 1.43mi |
| 3890 Floyd Rd Unit A4 Austell, GA | 1.0 | 1.0 | 853 | $1,961 | $2.30 | 4d | 1 | 1.43mi |
| 3890 Floyd Rd Unit 2201 Austell, GA | 2.0 | 2.0 | 1128 | $2,147 | $1.90 | 24d | 1 | 1.43mi |
| 1860 Gherry Dr Austell, GA | 3.0 | 2.0 | 1465 | $1,606 | $1.10 | 5d | 1 | 1.46mi |
| 3510 Ashley Station Dr SW Marietta, GA | 3.0 | 2.5 | 1408 | $1,845 | $1.31 | 11d | 1 | 1.50mi |
Listing history 25 events
-
2026-06-18days on market $159,999 Active 43 DOM
-
2026-06-17days on market $159,999 Active 42 DOM
-
2026-06-16days on market $159,999 Active 41 DOM
-
2026-06-15days on market $159,999 Active 40 DOM
-
2026-06-13days on market $159,999 Active 38 DOM
-
2026-06-13days on market $159,999 Active 37 DOM
-
2026-06-09days on market $159,999 Active 34 DOM
-
2026-06-08days on market $159,999 Active 33 DOM
-
2026-06-07days on market $159,999 Active 32 DOM
-
2026-06-04days on market $159,999 Active 29 DOM
-
2026-06-03days on market $159,999 Active 28 DOM
-
2026-06-02days on market $159,999 Active 27 DOM
-
2026-06-01days on market $159,999 Active 26 DOM
-
2026-05-31days on market $159,999 Active 25 DOM
-
2026-05-07price $159,999 497-char remark
-
2026-05-02$155,000 Active 497-char remark
-
2026-03-31historical
-
2025-10-09$175,000 Active
-
2014-10-08price $17,100
Show marketing remark (303 chars)
HUD HOMES ARE "SOLD AS-IS". INFORMATION DEEMED RELIABLE BUT NOT GUARANTEED. SELLING BROKER TO VERIFY ALL INFORMATION. BIDS OVER "AS-IS" VALUE W/FHA REQUIRES CASH PAID AT CLOSING FOR OVERBID AMOUNT. EQUAL HOUSING OPPORTUNITY. CASE# 105-145272. FHA FINANCING: IE (INSURED ESCROW) $2365
-
2013-05-20soldstatus $25,000 Sold
Show marketing remark (303 chars)
HUD HOMES ARE "SOLD AS-IS". INFORMATION DEEMED RELIABLE BUT NOT GUARANTEED. SELLING BROKER TO VERIFY ALL INFORMATION. BIDS OVER "AS-IS" VALUE W/FHA REQUIRES CASH PAID AT CLOSING FOR OVERBID AMOUNT. EQUAL HOUSING OPPORTUNITY. CASE# 105-145272. FHA FINANCING: IE (INSURED ESCROW) $2365
-
2013-04-16status Under Contract
Show marketing remark (303 chars)
HUD HOMES ARE "SOLD AS-IS". INFORMATION DEEMED RELIABLE BUT NOT GUARANTEED. SELLING BROKER TO VERIFY ALL INFORMATION. BIDS OVER "AS-IS" VALUE W/FHA REQUIRES CASH PAID AT CLOSING FOR OVERBID AMOUNT. EQUAL HOUSING OPPORTUNITY. CASE# 105-145272. FHA FINANCING: IE (INSURED ESCROW) $2365
-
2013-04-16price $25,000
Show marketing remark (303 chars)
HUD HOMES ARE "SOLD AS-IS". INFORMATION DEEMED RELIABLE BUT NOT GUARANTEED. SELLING BROKER TO VERIFY ALL INFORMATION. BIDS OVER "AS-IS" VALUE W/FHA REQUIRES CASH PAID AT CLOSING FOR OVERBID AMOUNT. EQUAL HOUSING OPPORTUNITY. CASE# 105-145272. FHA FINANCING: IE (INSURED ESCROW) $2365
-
2013-04-06$17,100 New
Show marketing remark (303 chars)
HUD HOMES ARE "SOLD AS-IS". INFORMATION DEEMED RELIABLE BUT NOT GUARANTEED. SELLING BROKER TO VERIFY ALL INFORMATION. BIDS OVER "AS-IS" VALUE W/FHA REQUIRES CASH PAID AT CLOSING FOR OVERBID AMOUNT. EQUAL HOUSING OPPORTUNITY. CASE# 105-145272. FHA FINANCING: IE (INSURED ESCROW) $2365
-
1999-12-30soldstatus $40,000
-
1983-03-07soldstatus $40,700
ⓘ Source: listings_history table (triggers on properties + properties_extension) + one-shot
backfill from property_details.listing_events for pre-trigger history.
Tax reassessment forecast GA · Resets to sale price
- Current annual tax
- $1,633 · $136/mo
- Projected year-2 tax
- $1,633 · $136/mo
- Expected delta
- $0/yr ($0/mo · 0.0%)
ⓘ Screening estimate from a state-policy table — verify with the county assessor before closing.
Climate risk First Street
- Flood 1/10 Low FEMA zone X (unshaded) · 0% chance over 30 yrs
- Wildfire 2/10 Low
- Heat 5/10 Major 7 d/yr ≥103°F today · 17 d/yr by 30 yrs out
- Wind 5/10 Major 25% chance of damaging wind over 30 yrs
- Air quality 4/10 Moderate 4 unhealthy d/yr today · 5 by 30 yrs out
Nearby sold comps map
Loading sold comps map…
Walkable amenities ~0.75 mi
Loading nearby amenities…
Taxation est. · year 1
- Rental income
- $20,546
- − Mortgage interest
- −$8,962
- − Property taxes
- −$1,633
- − Insurance
- −$800
- − Repairs & maintenance
- −$1,644
- − Management
- −$1,644
- − Depreciation
- −$4,655
- Taxable income
- $1,209
- Est. tax owed @ 24.0%
- −$290
- After-tax cash flow
- $3,440/yr
For passive investors: Depreciation is non-cash, so a rental often shows a tax loss while cash-flowing — sheltering income. Rental losses are passive: they offset passive income freely, and up to $25,000/yr can offset ordinary (W-2) income if you actively participate and your MAGI is under $100k (phasing out to $0 by $150k); unused losses carry forward. On sale, claimed depreciation is recaptured at up to 25%, and gains may owe capital-gains tax (a 1031 exchange can defer both). Figures are a year-1 estimate at your 24.0% rate — not tax advice; consult a CPA.
Schools (NCES district)
- District
- Cobb County
- NCES district ID
- 1301290
- Math proficiency
- 39% ▼ -15.00%
- Reading proficiency
- 45% ▼ -10.00%
- Median HH income
- $68,845
- Composite
- 37.93/100
- National rank
- #4308
- State rank
- #25 of 174 in GA
Livability — Austell
- Score
- 67/100
- State rank
- #175
- US rank
- #11059
Category grades
Schools grade is shown separately in the Schools card above.
Census & demographics
- County
- Cobb County · 777,758 people
- City population
- 49,719
- Metro
- Atlanta-Sandy Springs-Alpharetta, GA
- Population (ZIP)
- 23,107
- Household income
- $68,881
- Rent vs Own
- Severe rent burden
- 907.0
Population outlook (Cobb County) Hauer SSP2
- Today (2025)
- 868,385 people
- By 2030
- 929,614 · +7.1%
- By 2040
- 1,047,533 · +20.6%
- By 2050
- 1,155,537 · +33.1%
- By 2075
- 1,405,030 · +61.8%
- By 2100
- 1,555,058 · +79.1%
Race, ethnicity, and origin ACS 2023
- Neighborhood character
- Diverse neighborhood (Simpson 0.62)
- Race & ethnicity
- Black 54% White 22% Hispanic / Latino 20% Two or more races 8% Asian 1%
- Hispanic origin (detail)
- Mexican 9% Puerto Rican 6%
- Common ancestry
- Italian 2% Hispanic 1% Romanian 1%
- Foreign-born
- 14% · Canada, Jamaica, Vietnam
- Languages at home
- 79% English-only · Spanish 16% Other Indo-European 1% French/Haitian/Cajun 1%
Political lean MEDSL · Cobb
- 2024 margin
- D (+14.9) · D 56.9% · R 42.0% · Other 1.1%
- 2008→2024 swing
- +24.3pp toward D · 2008: -9.4pp · 2024: 14.9pp
- All cycles
- 2024: D+14.9 2020: D+14.3 2016: D+2.1 2012: R+12.6 2008: R+9.4
Not yet ingested
- Civics
- —
Market trends
- HPI YoY
- ▼ -128.55%
- Current HPI
- 256.6988
- Rent YoY
- ▲ 1.30%
- Metro
- Atlanta-Sandy Springs-Alpharetta, GA
- State GDP YoY
- ▲ 2.66%
- F500 in state
- 28
Industry mix (Fortune 500 HQ in GA)
| Industry | F500 HQs | Revenue |
|---|---|---|
| Paper / Packaging | 2 | $29B |
|
||
| Retail | 1 | $160B |
|
||
| Transportation / Logistics | 1 | $91B |
|
||
| Airlines | 1 | $62B |
|
||
| Consumer Goods | 1 | $47B |
|
||
| Utilities | 1 | $25B |
|
||
Price history
+293.1% since first listed11 events — show timeline
- 2026-05-07 Price Changed $159,999 FMLS
- 2026-05-02 Listed $155,000 FMLS
- 2026-03-31 Listing Removed — FMLS
- 2025-10-09 Listed $175,000 FMLS
- 2014-10-08 Price Changed $17,100 GAMLS
- 2013-05-20 Sold (MLS) $25,000 GAMLS
- 2013-04-16 Pending — GAMLS
- 2013-04-16 Price Changed $25,000 GAMLS
- 2013-04-06 Listed $17,100 GAMLS
- 1999-12-30 Sold (Public Records) $40,000 Public Records
- 1983-03-07 Sold (Public Records) $40,700 Public Records
Property tax history
+5.4%/yrLatest (2025): $1,633 · -0.1% YoY. Source: county tax records.
Cash-flow waterfall
monthlySold comps — $/sqft
last 12 mo · ≤1 miLoading sold comps…