3607 Borgess Dr · Comstock Northwest, MI
Flood risk 1/10 · Minimal
- FEMA flood zone
- X (unshaded)
- Chance of flooding over 30 yrs
- 0.0%
- Est. flood insurance / yr
- $473 – $860
Fire risk 2/10 · Minimal
- Est. fire insurance / yr
- $784 – $1,456
Heat risk 2/10 · Minimal
- Hot days now (above 98°F)
- 7 days/yr
- Hot days in 30 yrs
- 16 days/yr
Wind risk 2/10 · Minimal
- Chance of severe wind over 30 yrs
- —
Air-quality risk 2/10 · Minimal
- Unhealthy air days now
- 1 days/yr
- Unhealthy air days in 30 yrs
- 2 days/yr
Risk factors via First Street. Map © Google.
Why this score? — see what drove the C+ grade
The composite is a weighted blend of 9 inputs, each scored 0–100. Each bar is that input's sub-score; the figure is the points it added to the 100-point composite (weight × sub-score).
- Cash flow +20.5/30.0
- ARV discount +15.0/15.0
- DSCR +6.5/10.0
- 1% rule +6.1/10.0
- Rent growth +4.5/5.0
- Livability +3.7/5.0
- Condition / age +2.5/5.0
- Schools +2.1/10.0
- Appreciation +0.0/10.0
$125,000
🖨 Deal sheet 📄 Offer letter ✓ Due diligence
Listing remarks MLS
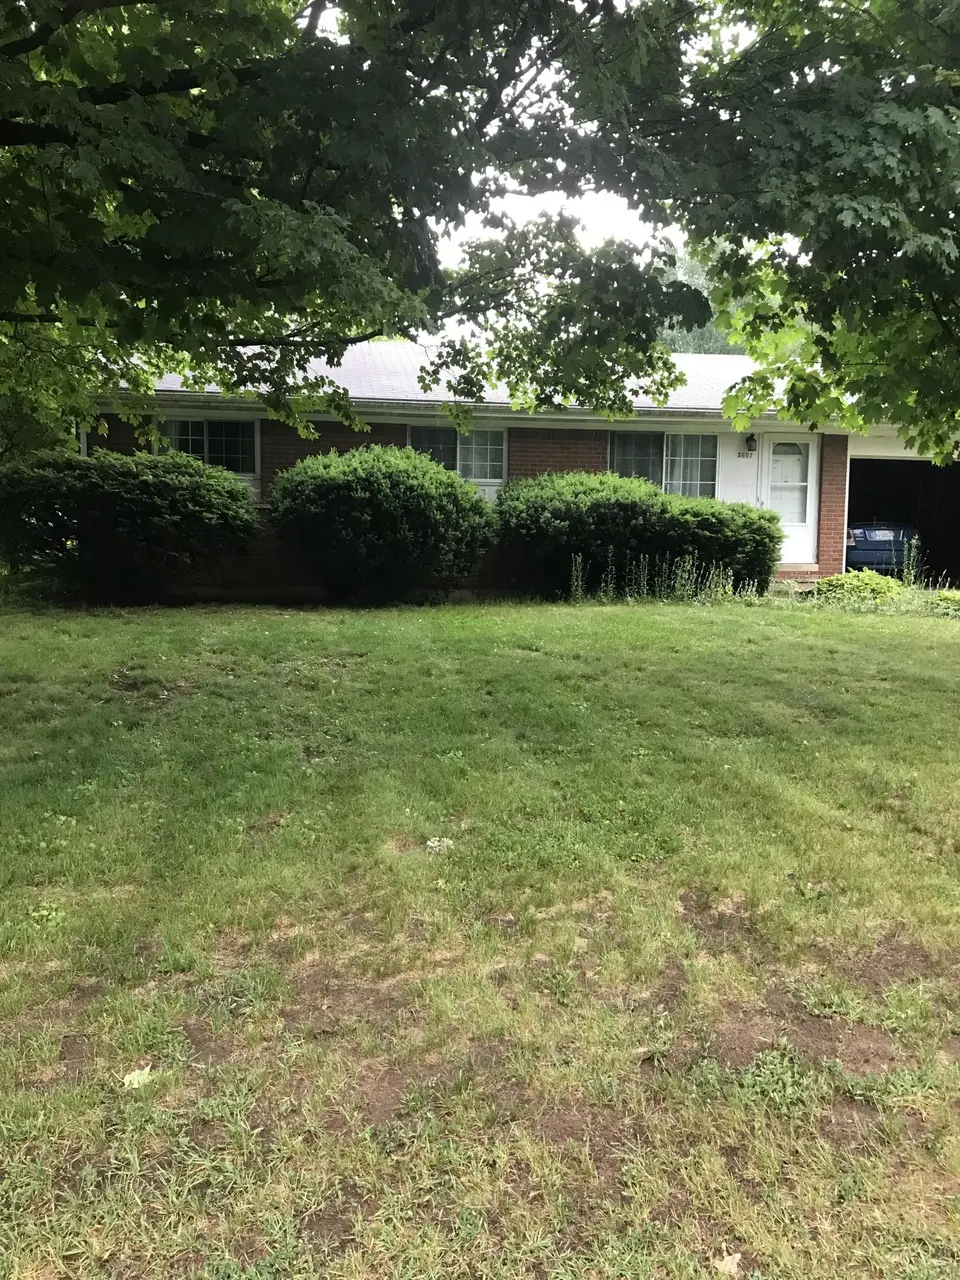
Three-bedroom one bath ranch home with a one car attached garage. Home is being sold as is and needs repairs.
Key facts
- 0.24 acre lot
- Garage
- Built 1960
Property features AI
Exterior
- Parking: Attached garage (1 car)
- Utilities: Natural gas connected
- Home design: Ranch-style single family residence; Living area approximately 1,014; Built in 1960
- Construction: Aluminum siding; Composition roof; Full foundation
- Exterior features: Public water; Lot about 0.24 acres
Interior
- Kitchen: Microwave; Oven; Refrigerator
- Bathrooms: 1 full bathroom; 1 half bathroom
- Heating & cooling: Forced air heating; Has cooling
- Interior features: Six total rooms; Full basement
- Laundry & utility: Washer; Dryer; Natural gas water heater
Neighborhood map
What this means for you Summary
Snapshot
- This is a 3-bed/1.0-bath single-family listed at $125k.
Deal economics
- At list price, monthly cash flow is $165 ($2k/yr) — positive.
- The deal already cash-flows at list — no discount required.
- Meets the 1% rule at list price ($1k rent vs $125k).
- Cap rate 7.9% vs local median 3.6% in Comstock Northwest — top-decile yield for the area; either an underpriced asset or a hidden risk that comps aren't pricing in. Stress-test before assuming the spread holds.
Location & tenants
- Location reads 73/100 on livability (#224 in MI) — a middle-class / working-renter tenant base. Strengths: cost of living A+, housing A+, crime B; Watch: amenities D, commute F, health & safety F.
- Comstock Public Schools (suburban): math 18% / reading 32% proficiency, ranked #428 of 540 in MI (top 79%) — low school quality limits family demand, transient renter base, plan for 1-2y turnover; 65% free/reduced lunch — lower-income household profile, screen leases tightly.
- Market conditions: Rents rising fast (+7.9%/yr); 154 active listings in the ZIP; 7 comparable units currently listed for rent nearby; rentals leasing fast (median 14d on market — plan ~1-2 weeks tenant-placement turnaround); 339 units permitted in Kalamazoo County in 2024 (22 in 5+ unit buildings).
Forward outlook
- Local home prices are declining (-3.0%/yr); year-one equity from $864 of loan paydown is wiped out by about $4k of value loss. Plan a longer hold.
- Kalamazoo County population projected at +18% by 2050 — long-run rental-demand tailwind backs the buy-and-hold thesis.
- At projected returns (-3.0% appreciation + 7.9% rent growth), your $35k cash investment doubles in ~9 years — after that, you're playing with house money.
Negotiation context
- Only 1 days on market — expect competitive offers; lowballing is unlikely to land.
- 3 sale attempts with the ask held roughly flat each time — persistent listings suggest the price (not the market) is what's stuck; bring a comps-based counter.
Questions for the listing agent
- Built in 1960 — when were the roof, HVAC, electrical panel, plumbing, and water heater last replaced?
- Is there a deadline driving the sale (1031 exchange, divorce, estate, relocation)? That informs how much negotiation room exists.
- What's the average days-on-market for RENTAL listings here right now (not sales)? A rising rental-DOM trend means longer vacancies and softer asking-rent achievability than the comps imply.
- What's the recent tenant-quality profile in this submarket — average credit score on applications, eviction rate, late-payment / NSF rate, and stable-employment percentage? A property-management company in the area should have these aggregated.
- How much new for-sale + rental construction is in the pipeline within 1–3 miles? Heavy new supply typically softens prices + rents 12–24 months out; constrained supply supports both.
Investment metrics
- 1% rule
- 1.11% ✓
- Cap rate
- 7.88%
- Cash-on-cash
- 5.67%
- DSCR
- 1.25
- GRM
- 7.5
CMA / ARV
- ARV (on-the-fly)
- $194,688
- Comps found
- 12
Show comp detail 12 sales within ~0.75 mi
| Address | Dist | Beds/Ba | Sqft | Sold | Price | $/sf | Match |
|---|---|---|---|---|---|---|---|
| 5007 Fordham Ave | 0.40mi | 2/2.0 (-1) | 972 (-4%) | 1mo | $210,000 | $216 | 65 |
| 3097 Margaret Ave | 0.35mi | 3/1.0 | 1,092 (+8%) | 11mo | $210,100 | $192 | 62 |
| 1934 Nazareth Rd | 0.27mi | 3/1.0 | 1,165 (+15%) | 3mo | $159,575 | $137 | 60 |
| 3052 Clarice St | 0.69mi | 3/1.0 | 1,040 (+3%) | 6mo | $235,000 | $226 | 59 |
| 2616 Fairfield Ave | 0.46mi | 2/1.0 (-1) | 988 (-3%) | 14mo | $141,925 | $144 | 57 |
| 5346 E H Ave E | 0.59mi | 2/1.5 (-1) | 960 (-5%) | 0mo | $220,000 | $229 | 56 |
| 3131 Casper St | 0.30mi | 3/2.0 | 960 (-5%) | 21mo | $221,500 | $231 | 56 |
| 1734 Texel Dr | 0.60mi | 2/1.0 (-1) | 1,080 (+6%) | 2mo | $170,000 | $157 | 55 |
| 1512 Upland Dr | 0.63mi | 3/1.0 | 1,094 (+8%) | 8mo | $157,000 | $144 | 51 |
| 3221 Miami Ave | 0.47mi | 2/2.0 (-1) | 1,116 (+10%) | 2mo | $150,000 | $134 | 50 |
| 1707 Sunnyside Dr | 0.61mi | 2/1.0 (-1) | 960 (-5%) | 15mo | $179,900 | $187 | 46 |
| 1509 Baker Dr | 0.62mi | 2/1.0 (-1) | 864 (-15%) | 8mo | $179,900 | $208 | 34 |
Match score weights: distance 35% · size 25% · config 20% · recency 20%. Top-matched comps best support the ARV.
Projected returns pro-forma
-3.0% appreciation · 7.88% rent growth · sell at horizon
- IRR
- -1.8%
- Equity multiple
- 0.93×
- Total profit
- $-2,545
- Equity at exit
- $18,638
- IRR
- 12.8%
- Equity multiple
- 2.25×
- Total profit
- $43,904
- Equity at exit
- $10,808
Cash invested: $35,000 (down + closing). Projections, not guarantees.
Landlord ↔ Tenant lean methodology
- Overall (STATE)
- 62 Landlord-Friendly
- State Michigan
- 62 Landlord-Friendly · EVEN
- County
- — inherits STATE
- City
- — inherits STATE
ZIP-level market 49048
- Rents YoY
- 7.9%
- Active inventory
- 154
- Price-to-rent
- 7.5×
Monthly cashflow live
- Estimated rent
- $1,382 high interval (Pro) →
- Mortgage (P&I)
- −$656
- Tax from tax record
- −$219 /mo · $2,623/yr
- Insurance
- −$52
- HOA
- −$0
- Vacancy / Maint / Mgmt
- −$290
- Net cashflow
- $165
Break-even live
UW: 25.0% down · 7.5% · 30yr · 1.5% tax · 5.0% vac · 8.0% maint · 8.0% mgmt
Financing live
Cash to close
- Down payment
- $31,250
- Closing costs
- $3,750
- Reserves months
- —
- Total cash needed
- —
Loan-product check · same deal, 3 products live
Conventional
25% down · 7.5% · 30yr
- Down + closing
- —
- Monthly P&I
- —
- Monthly cashflow
- —
- DSCR
- —
- Eligible?
- —
Personal DTI + credit; lowest rate.
DSCR
20% down · 8.5% · 30yr
- Down + closing
- —
- Monthly P&I
- —
- Monthly cashflow
- —
- DSCR
- —
- Eligible?
- —
No personal income docs; deal must DSCR.
Hard money
10% down · 12.0% · 12mo
- Down + closing
- —
- Monthly P&I
- —
- Monthly cashflow
- —
- DSCR
- —
- Eligible?
- —
Short-term bridge; refi at stabilization.
Rent comps 7 comps
| Address | Beds | Baths | Sqft | Rent | $/sqft | DOM | Units | Dist |
|---|---|---|---|---|---|---|---|---|
| 2024 Sunnyside Dr Kalamazoo, MI | 1.0–2.0 | 1.0 | 740 | $1,000 | $1.35 | 13d | 1 | 0.30mi |
| 1926 Sunnyside Dr Kalamazoo, MI | 2.0 | 1.5 | 1020 | $1,200 | $1.18 | 21d | 1 | 0.44mi |
| 1928 Colgrove Ave Kalamazoo, MI | 1.0–3.0 | 1.0–2.0 | 912 | $1,390 | $1.52 | 13d | 13 | 1.00mi |
| 621 Washburn Ave Kalamazoo, MI | 2.0 | 1.0 | 720 | $1,300 | $1.81 | 21d | 1 | 1.31mi |
| 4495 Gull Run Dr Kalamazoo, MI | 1.0–2.0 | 1.0–2.0 | 854 | $1,524 | $1.78 | 13d | 88 | 1.35mi |
| 450 Haymac Dr Parchment, MI | 1.0–3.0 | 1.0–2.0 | 867 | $1,375 | $1.59 | 13d | 1 | 1.41mi |
| 5001 Coopers Landing Dr Kalamazoo, MI | 1.0–3.0 | 1.0–2.0 | 1111 | $1,600 | $1.44 | 13d | 1 | 1.48mi |
Listing history 2 events
-
2026-06-07remarks 109-char remark
-
2026-06-07$125,000 Pending 1 DOM
ⓘ Source: listings_history table (triggers on properties + properties_extension) + one-shot
backfill from property_details.listing_events for pre-trigger history.
Tax reassessment forecast MI · Partial reset (capped growth)
- Current annual tax
- $2,623 · $219/mo
- Projected year-2 tax
- $2,623 · $219/mo
- Expected delta
- $0/yr ($0/mo · 0.0%)
ⓘ Screening estimate from a state-policy table — verify with the county assessor before closing.
Climate risk First Street
- Flood 1/10 Low FEMA zone X (unshaded) · 0% chance over 30 yrs
- Wildfire 2/10 Low
- Heat 2/10 Low 7 d/yr ≥98°F today · 16 d/yr by 30 yrs out
- Wind 2/10 Low
- Air quality 2/10 Low 1 unhealthy d/yr today · 2 by 30 yrs out
Nearby sold comps map
Loading sold comps map…
Walkable amenities ~0.75 mi
Loading nearby amenities…
Taxation est. · year 1
- Rental income
- $16,581
- − Mortgage interest
- −$7,002
- − Property taxes
- −$2,623
- − Insurance
- −$625
- − Repairs & maintenance
- −$1,326
- − Management
- −$1,326
- − Depreciation
- −$3,636
- Taxable income
- $41
- Est. tax owed @ 24.0%
- −$10
- After-tax cash flow
- $1,975/yr
For passive investors: Depreciation is non-cash, so a rental often shows a tax loss while cash-flowing — sheltering income. Rental losses are passive: they offset passive income freely, and up to $25,000/yr can offset ordinary (W-2) income if you actively participate and your MAGI is under $100k (phasing out to $0 by $150k); unused losses carry forward. On sale, claimed depreciation is recaptured at up to 25%, and gains may owe capital-gains tax (a 1031 exchange can defer both). Figures are a year-1 estimate at your 24.0% rate — not tax advice; consult a CPA.
Schools (NCES district)
- District
- Comstock Public Schools
- NCES district ID
- 2610590
- Math proficiency
- 18% ▼ -2.00%
- Reading proficiency
- 32% ▼ -1.00%
- Median HH income
- $41,293
- Composite
- 21.17/100
- National rank
- #8423
- State rank
- #428 of 540 in MI
Livability — Comstock Northwest
- Score
- 73/100
- State rank
- #224
- US rank
- #5631
Category grades
Schools grade is shown separately in the Schools card above.
Census & demographics
- Census place
- Comstock Northwest, MI
- County
- Kalamazoo County · 224,317 people
- Metro
- Kalamazoo-Portage, MI
- Population (ZIP)
- 22,791
- Household income
- $60,454
- Rent vs Own
- Severe rent burden
- 835.0
Population outlook (Kalamazoo County) Hauer SSP2
- Today (2025)
- 280,982 people
- By 2030
- 292,068 · +3.9%
- By 2040
- 312,191 · +11.1%
- By 2050
- 331,196 · +17.9%
- By 2075
- 379,021 · +34.9%
- By 2100
- 396,579 · +41.1%
Race, ethnicity, and origin ACS 2023
- Neighborhood character
- Predominantly White (67%)
- Race & ethnicity
- White 67% Black 20% Hispanic / Latino 7% Two or more races 7% Asian 2%
- Hispanic origin (detail)
- Mexican 4%
- Common ancestry
- Iranian 6% Romanian 4% Lithuanian 2%
- Foreign-born
- 4% · Canada
- Languages at home
- 94% English-only · Spanish 3% Other Indo-European 1%
Political lean MEDSL · Kalamazoo
- 2024 margin
- D (+17.7) · D 58.0% · R 40.3% · Other 1.7%
- 2008→2024 swing
- -1.8pp toward R · 2008: 19.5pp · 2024: 17.7pp
- All cycles
- 2024: D+17.7 2020: D+18.7 2016: D+12.8 2012: D+13.3 2008: D+19.5
Not yet ingested
- Civics
- —
Market trends
- HPI YoY
- ▼ -205.26%
- Current HPI
- 180.4766
- Rent YoY
- ▲ 7.88%
- Metro
- Kalamazoo-Portage, MI
- State GDP YoY
- ▲ 1.37%
- F500 in state
- 28
Industry mix (Fortune 500 HQ in MI)
| Industry | F500 HQs | Revenue |
|---|---|---|
| Automotive Parts | 3 | $48B |
|
||
| Automotive | 2 | $372B |
|
||
| Chemicals | 1 | $45B |
|
||
| Automotive Retail | 1 | $29B |
|
||
| Healthcare / Medical Devices | 1 | $23B |
|
||
| Automotive Technology | 1 | $20B |
|
||
Price history
+0.0% since first listed6 events — show timeline
- 2026-06-06 Pending — SW Michigan MLS
- 2026-06-05 Listing Removed — MiRealSource-MiMLS
- 2026-06-05 Listed $125,000 MiRealSource-MiMLS
- 2026-06-05 Listing Removed — REALCOMP
- 2026-06-05 Listed $125,000 REALCOMP
- 2026-06-05 Listed $125,000 SW Michigan MLS
Property tax history
+4.6%/yrLatest (2025): $2,623 · +3.9% YoY. Source: county tax records.
Cash-flow waterfall
monthlySold comps — $/sqft
last 12 mo · ≤1 miLoading sold comps…