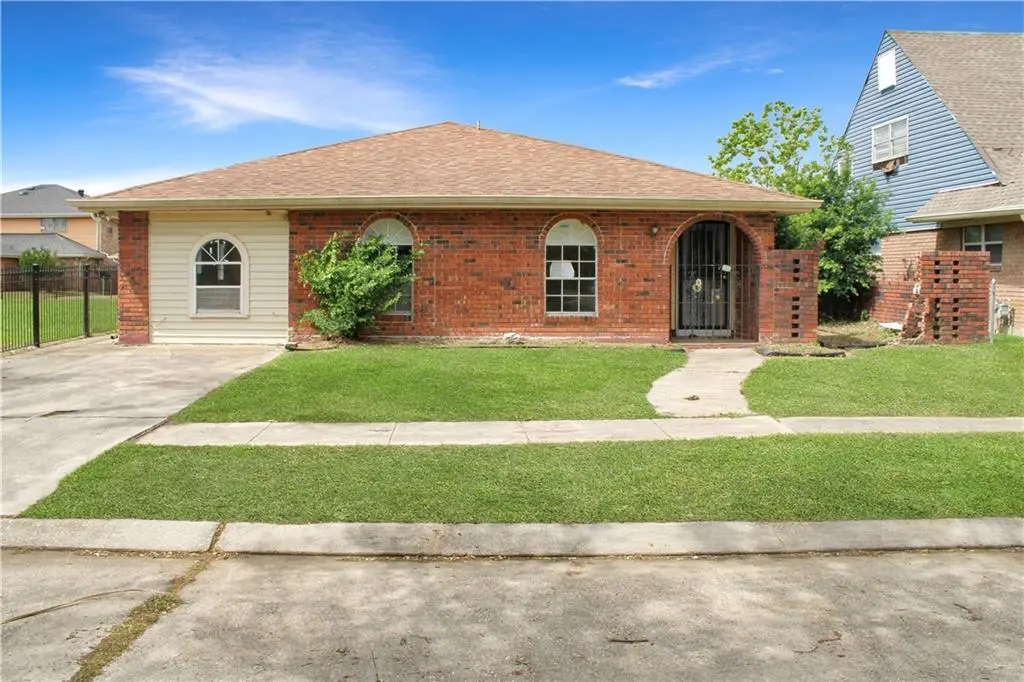
7432 Dartmoor Dr · New Orleans, LA
Flood risk 8/10 · Major
- FEMA flood zone
- X (shaded)
- Chance of flooding over 30 yrs
- 0.6%
- Est. flood insurance / yr
- $507 – $1,088
Fire risk 1/10 · Minimal
- Est. fire insurance / yr
- $1,269 – $2,357
Heat risk 10/10 · Severe
- Hot days now (above 107°F)
- 7 days/yr
- Hot days in 30 yrs
- 21 days/yr
Wind risk 10/10 · Severe
- Chance of severe wind over 30 yrs
- 99.0%
Air-quality risk 3/10 · Minor
- Unhealthy air days now
- 3 days/yr
- Unhealthy air days in 30 yrs
- 3 days/yr
Risk factors via First Street. Map © Google.
Why this score? — see what drove the C grade
The composite is a weighted blend of 9 inputs, each scored 0–100. Each bar is that input's sub-score; the figure is the points it added to the 100-point composite (weight × sub-score).
- Cash flow +20.5/30.0
- ARV discount +15.0/15.0
- DSCR +6.5/10.0
- 1% rule +5.2/10.0
- Livability +4.0/5.0
- Rent growth +2.5/5.0
- Condition / age +2.5/5.0
- Schools +1.6/10.0
- Appreciation +0.0/10.0
$174,900
🖨 Deal sheet 📄 Offer letter ✓ Due diligence
Listing remarks MLS
Very Spacious, all brick home looking for the right new owner to add their special TLC and make it there own! This home features 4 Bedrooms and 2 Full Baths. There is a formal dining room, living room, laundry, and lots of storage space. The garage is enclosed and could be used as an office, game room, or playroom for little ones, plus there a private yard for outdoor functions! This property is part of first look offeree program and will be marketed first 30 days to owner occupants. Investor offers will be considers after May 09, 2026. Sold in As-Is condition. This opportunity won't last long! Call your agent today to schedule your private showing.
Key facts
- Enclosed garage
- Formal dining room
- Private yard
Tags
Neighborhood map
What this means for you Summary
Snapshot
- This is a 4-bed/2.0-bath single-family listed at $175k.
Deal economics
- At list price, monthly cash flow is $165 ($2k/yr) — positive.
- The deal already cash-flows at list — no discount required.
- Meets the 1% rule at list price ($2k rent vs $175k).
- Recommended offer: $164k (6.0% below list) — sets the bar for market timing.
- Cap rate 7.9% vs local median 4.4% in New Orleans — top-decile yield for the area; either an underpriced asset or a hidden risk that comps aren't pricing in. Stress-test before assuming the spread holds.
Location & tenants
- Location reads 81/100 on livability (#3 in LA, #1,383 nationally) — a professional / high-income tenant draw. Strengths: amenities A+, commute A+, health & safety A+; Watch: crime C-, employment D.
- Orleans Parish (urban): math 11% / reading 27% proficiency, ranked #69 of 98 in LA (top 70%) — low school quality limits family demand, transient renter base, plan for 1-2y turnover; 68% free/reduced lunch — lower-income household profile, screen leases tightly.
- Market conditions: 128 active listings in the ZIP; 20 comparable units currently listed for rent nearby; rentals at typical pace (median 24d on market — plan ~3-4 weeks tenant-placement turnaround); lower-income renter base — watch delinquency; 710 units permitted in Orleans Parish in 2024 (244 in 5+ unit buildings).
- At $1,791/mo this rent would consume 53% of the median local household income ($41k/yr) (locally 2030% of renters already pay >50% of income on rent) — very limited rent-growth headroom before tenants either downsize or default.
Forward outlook
- Local home prices are declining (-3.0%/yr); year-one equity from $1k of loan paydown is wiped out by about $5k of value loss. Plan a longer hold.
- Orleans County population projected at +61% by 2050 — long-run rental-demand tailwind backs the buy-and-hold thesis.
Negotiation context
- It's been on market 70 days — a 6% lower offer ($164k) is reasonable based on typical stale-listing flexibility.
- 3 sale attempts since 5y ago; this cycle's ask has dropped $10k (5%) from the opening price — seller is motivated, your offer sets the floor, not the list.
- Current owner paid $53k; list at $175k implies a 233% gain — meaningful room to come down on a strong offer.
Risks & watch-outs
- Watch-outs: flood insurance adds $66/mo.
- Climate carrying-cost: severe flood risk; severe wind risk, 99% chance of damaging wind over 30y; extreme-heat days projected 7→21/yr by 2055 (HVAC capex compounding) — expect insurance premiums to compound above CPI over the hold.
Questions for the listing agent
- It's been on market 70 days. Have you received any prior offers? Is the seller open to a 6% concession, seller financing, or rate buy-down credit?
- What's the actual annual flood-insurance premium (NFIP or private), and is the property in a SFHA with mandatory coverage?
- Why hasn't it sold? Are there any deal-killer items the seller is aware of (foundation, flood, title, zoning, code violations)?
- Is there a deadline driving the sale (1031 exchange, divorce, estate, relocation)? That informs how much negotiation room exists.
- What's the average days-on-market for RENTAL listings here right now (not sales)? A rising rental-DOM trend means longer vacancies and softer asking-rent achievability than the comps imply.
- What's the recent tenant-quality profile in this submarket — average credit score on applications, eviction rate, late-payment / NSF rate, and stable-employment percentage? A property-management company in the area should have these aggregated.
- How much new for-sale + rental construction is in the pipeline within 1–3 miles? Heavy new supply typically softens prices + rents 12–24 months out; constrained supply supports both.
Investment metrics
- 1% rule
- 1.02% ✓
- Cap rate
- 7.88%
- Cash-on-cash
- 5.68%
- DSCR
- 1.25
- GRM
- 8.1
CMA / ARV
- ARV (median comp)
- $217,686
- List price
- $174,900
- Delta
- -19.66%
- Verdict
- UNDERPRICED
- Comps
- 20 within 1.0 mi
Show comp detail 12 sales within ~0.75 mi
| Address | Dist | Beds/Ba | Sqft | Sold | Price | $/sf | Match |
|---|---|---|---|---|---|---|---|
| 7523 Benson St | 0.08mi | 3/2.0 (-1) | 1,707 (-6%) | 6mo | $190,000 | $111 | 75 |
| 7800 Trapier Ave | 0.45mi | 4/2.0 | 1,713 (-6%) | 0mo | $180,000 | $105 | 68 |
| 7984 Edgelake Ct | 0.44mi | 3/2.0 (-1) | 1,765 (-3%) | 6mo | $193,000 | $109 | 64 |
| 7619 Burke Rd | 0.20mi | 4/2.0 | 1,700 (-7%) | 18mo | $140,000 | $82 | 64 |
| 8936 Curran Blvd | 0.21mi | 3/2.0 (-1) | 2,050 (+12%) | 5mo | $70,000 | $34 | 60 |
| 7600 Burke Rd | 0.17mi | 4/3.5 | 2,066 (+13%) | 4mo | $266,000 | $129 | 60 |
| 7500 Primrose Dr | 0.62mi | 3/2.0 (-1) | 1,750 (-4%) | 6mo | $190,000 | $109 | 54 |
| 9962 E Wheaton Cir | 0.75mi | 3/2.0 (-1) | 1,911 (+5%) | 6mo | $240,000 | $126 | 47 |
| 7817 Woodbine Dr | 0.57mi | 3/2.0 (-1) | 1,656 (-9%) | 16mo | $181,000 | $109 | 40 |
| 9740 Andover Dr | 0.73mi | 3/2.0 (-1) | 1,613 (-12%) | 6mo | $190,000 | $118 | 37 |
| 8008 Brevard Ave | 0.49mi | 3/2.0 (-1) | 1,600 (-12%) | 19mo | $179,000 | $112 | 36 |
| 7608 Dogwood Dr | 0.72mi | 3/2.0 (-1) | 1,554 (-15%) | 13mo | $149,330 | $96 | 26 |
Match score weights: distance 35% · size 25% · config 20% · recency 20%. Top-matched comps best support the ARV.
Projected returns pro-forma
-3.0% appreciation · 3.0% rent growth · sell at horizon
- IRR
- -9.9%
- Equity multiple
- 0.64×
- Total profit
- $-17,764
- Equity at exit
- $26,078
- IRR
- -0.5%
- Equity multiple
- 0.97×
- Total profit
- $-1,703
- Equity at exit
- $15,122
Cash invested: $48,972 (down + closing). Projections, not guarantees.
Landlord ↔ Tenant lean methodology
- Overall (STATE)
- 90 Strongly Landlord-Friendly
- State Louisiana
- 90 Strongly Landlord-Friendly · R+12
- County
- — inherits STATE
- City
- — inherits STATE
ZIP-level market 70127
- Home prices YoY
- -29.2%
- Active inventory
- 128
- Price-to-rent
- 8.1×
Monthly cashflow live
- Estimated rent
- $1,791 high interval (Pro) →
- Mortgage (P&I)
- −$917
- Tax from tax record
- −$193 /mo · $2,320/yr
- Insurance
- −$73
- Flood insurance flood zone
- −$66 /mo · $798/yr
- HOA
- −$0
- Vacancy / Maint / Mgmt
- −$376
- Net cashflow
- $165
Break-even live
UW: 25.0% down · 7.5% · 30yr · 1.5% tax · 5.0% vac · 8.0% maint · 8.0% mgmt
Financing live
Cash to close
- Down payment
- $43,725
- Closing costs
- $5,247
- Reserves months
- —
- Total cash needed
- —
Loan-product check · same deal, 3 products live
Conventional
25% down · 7.5% · 30yr
- Down + closing
- —
- Monthly P&I
- —
- Monthly cashflow
- —
- DSCR
- —
- Eligible?
- —
Personal DTI + credit; lowest rate.
DSCR
20% down · 8.5% · 30yr
- Down + closing
- —
- Monthly P&I
- —
- Monthly cashflow
- —
- DSCR
- —
- Eligible?
- —
No personal income docs; deal must DSCR.
Hard money
10% down · 12.0% · 12mo
- Down + closing
- —
- Monthly P&I
- —
- Monthly cashflow
- —
- DSCR
- —
- Eligible?
- —
Short-term bridge; refi at stabilization.
Rent comps 20 comps
| Address | Beds | Baths | Sqft | Rent | $/sqft | DOM | Units | Dist |
|---|---|---|---|---|---|---|---|---|
| 7401 Scottsdale Dr New Orleans, LA | 3.0 | 2.5 | 2100 | $2,000 | $0.95 | 23d | 1 | 0.15mi |
| 8936 Curran Blvd New Orleans, LA | 3.0 | 2.0 | 2050 | $1,575 | $0.77 | 21d | 1 | 0.19mi |
| 7230 Yorktown Dr New Orleans, LA | 3.0 | 2.0 | 1550 | $1,600 | $1.03 | 23d | 1 | 0.21mi |
| 7230 Yorktown Dr New Orleans, LA | 3.0 | 2.0 | 1550 | $1,600 | $1.03 | 16d | 1 | 0.21mi |
| 7202 Salem Dr New Orleans, LA | 3.0 | 2.5 | 1995 | $1,750 | $0.88 | 23d | 1 | 0.29mi |
| 7201 Salem Dr New Orleans, LA | 3.0 | 2.5 | 1764 | $1,650 | $0.94 | 23d | 1 | 0.30mi |
| 7063 Boston Dr New Orleans, LA | 4.0 | 2.5 | 1750 | $1,900 | $1.09 | 16d | 1 | 0.37mi |
| 6972 Bundy Rd New Orleans, LA | 3.0 | 2.5 | 2048 | $1,500 | $0.73 | 23d | 1 | 0.48mi |
| 6951 Salem Dr New Orleans, LA | 3.0 | 2.5 | 1900 | $1,875 | $0.99 | 23d | 1 | 0.48mi |
| 6910 Bunker Hill Rd New Orleans, LA | 3.0 | 2.5 | 1785 | $1,400 | $0.78 | 19d | 1 | 0.49mi |
| 9020 Bunker Hill Rd New Orleans, LA | 3.0 | 1.5 | 1400 | $1,400 | $1.00 | 23d | 1 | 0.53mi |
| 9022 Bunker Hill Rd New Orleans, LA | 3.0 | 1.5 | 1400 | $1,400 | $1.00 | 23d | 1 | 0.53mi |
| 9042 Bunker Hill Rd New Orleans, LA | 3.0 | 1.5 | 1400 | $1,450 | $1.04 | 16d | 1 | 0.54mi |
| 9040 Bunker Hill Rd New Orleans, LA | 3.0 | 1.5 | 1400 | $1,450 | $1.04 | 16d | 1 | 0.54mi |
| 7500 Symmes Ave New Orleans, LA | 4.0 | 2.0 | 1400 | $2,100 | $1.50 | 23d | 1 | 0.70mi |
| 7608 Laine Ave New Orleans, LA | 3.0 | 2.5 | 2060 | $1,950 | $0.95 | 23d | 1 | 1.07mi |
| 5611 Rickert Dr New Orleans, LA | 3.0 | 2.5 | 2155 | $2,900 | $1.35 | 43d | 1 | 1.12mi |
| 4828 Eastview Dr New Orleans, LA | 4.0 | 2.0 | 1260 | $1,675 | $1.33 | 23d | 1 | 1.19mi |
| 5131 Bundy Rd New Orleans, LA | 1.0–3.0 | 1.0–2.0 | 1000 | $1,314 | $1.31 | 1d | 21 | 1.27mi |
| 10951 Roger Dr Unit B New Orleans, LA | 3.0 | 2.5 | 2048 | $1,850 | $0.90 | 23d | 1 | 1.37mi |
Listing history 20 events
-
2026-06-18days on market $174,900 Active 70 DOM
-
2026-06-17days on market $174,900 Active 69 DOM
-
2026-06-16days on market $174,900 Active 68 DOM
-
2026-06-15days on market $174,900 Active 67 DOM
-
2026-06-13days on market $174,900 Active 65 DOM
-
2026-06-10days on market $174,900 Active 62 DOM
-
2026-06-09days on market $174,900 Active 61 DOM
-
2026-06-08days on market $174,900 Active 60 DOM
-
2026-06-07days on market $174,900 Active 59 DOM
-
2026-06-05days on market $174,900 Active 56 DOM
-
2026-06-03days on market $174,900 Active 55 DOM
-
2026-06-02days on market $174,900 Active 54 DOM
-
2026-06-01days on market $174,900 Active 53 DOM
-
2026-05-31days on market $174,900 Active 52 DOM
-
2026-04-08$184,900 Active 659-char remark
Show marketing remark (657 chars)
Very Spacious, all brick home looking for the right new owner to add their special TLC and make it there own! This home features 4 Bedrooms and 2 Full Baths. There is a formal dining room, living room, laundry, and lots of storage space. The garage is enclosed and could be used as an office, game room, or playroom for little ones, plus there a private yard for outdoor functions! This property is part of first look offeree program and will be marketed first 30 days to owner occupants. Investor offers will be considers after May 09, 2026. Sold in As-Is condition. This opportunity won't last long! Call your agent today to schedule your private showing.
-
2026-04-08$184,900 Active 657-char remark
Show marketing remark (657 chars)
Very Spacious, all brick home looking for the right new owner to add their special TLC and make it there own! This home features 4 Bedrooms and 2 Full Baths. There is a formal dining room, living room, laundry, and lots of storage space. The garage is enclosed and could be used as an office, game room, or playroom for little ones, plus there a private yard for outdoor functions! This property is part of first look offeree program and will be marketed first 30 days to owner occupants. Investor offers will be considers after May 09, 2026. Sold in As-Is condition. This opportunity won't last long! Call your agent today to schedule your private showing.
-
2021-06-15price $217,000
-
2021-05-27$217,000
-
1995-06-22soldstatus $52,538
-
1991-03-20soldstatus $52,538
ⓘ Source: listings_history table (triggers on properties + properties_extension) + one-shot
backfill from property_details.listing_events for pre-trigger history.
Tax reassessment forecast LA · Resets to sale price
- Current annual tax
- $2,320 · $193/mo
- Projected year-2 tax
- $2,320 · $193/mo
- Expected delta
- $0/yr ($0/mo · 0.0%)
ⓘ Screening estimate from a state-policy table — verify with the county assessor before closing.
Climate risk First Street
- Flood 8/10 Severe FEMA zone X (shaded) · 60% chance over 30 yrs
- Wildfire 1/10 Low
- Heat 10/10 Extreme 7 d/yr ≥107°F today · 21 d/yr by 30 yrs out
- Wind 10/10 Extreme 99% chance of damaging wind over 30 yrs
- Air quality 3/10 Moderate 3 unhealthy d/yr today · 3 by 30 yrs out
Nearby sold comps map
Loading sold comps map…
Walkable amenities ~0.75 mi
Loading nearby amenities…
Taxation est. · year 1
- Rental income
- $21,495
- − Mortgage interest
- −$9,797
- − Property taxes
- −$2,320
- − Insurance
- −$1,672
- − Repairs & maintenance
- −$1,720
- − Management
- −$1,720
- − Depreciation
- −$5,088
- Taxable loss
- −$821
- Est. tax savings @ 24.0%
- +$197
- After-tax cash flow
- $2,180/yr
For passive investors: Depreciation is non-cash, so a rental often shows a tax loss while cash-flowing — sheltering income. Rental losses are passive: they offset passive income freely, and up to $25,000/yr can offset ordinary (W-2) income if you actively participate and your MAGI is under $100k (phasing out to $0 by $150k); unused losses carry forward. On sale, claimed depreciation is recaptured at up to 25%, and gains may owe capital-gains tax (a 1031 exchange can defer both). Figures are a year-1 estimate at your 24.0% rate — not tax advice; consult a CPA.
Schools (NCES district)
- District
- Orleans Parish
- NCES district ID
- 2201170
- Math proficiency
- 11% ▼ -52.00%
- Reading proficiency
- 27% ▼ -46.00%
- Median HH income
- $37,011
- Composite
- 15.78/100
- National rank
- #9271
- State rank
- #69 of 98 in LA
Livability — New Orleans
- Score
- 81/100
- State rank
- #3
- US rank
- #1383
Category grades
Schools grade is shown separately in the Schools card above.
Census & demographics
- Census place
- New Orleans, LA
- County
- Orleans Parish · 338,817 people
- City population
- 338,817
- Metro
- New Orleans-Metairie, LA
- Population (ZIP)
- 23,107
- Household income
- $40,765
- Rent vs Own
- Severe rent burden
- 2030.0
Population outlook (Orleans County) Hauer SSP2
- Today (2025)
- 513,025 people
- By 2030
- 575,781 · +12.2%
- By 2040
- 700,174 · +36.5%
- By 2050
- 826,541 · +61.1%
- By 2075
- 1,123,374 · +119.0%
- By 2100
- 1,355,609 · +164.2%
Race, ethnicity, and origin ACS 2023
- Neighborhood character
- Predominantly Black (91%)
- Race & ethnicity
- Black 91% Hispanic / Latino 4% Two or more races 4% White 2%
- Common ancestry
- Lithuanian 1% Hispanic 1%
- Foreign-born
- 3% · Canada, Vietnam
- Languages at home
- 96% English-only · Spanish 2%
Political lean MEDSL · Orleans
- 2024 margin
- Solid D (+67.0) · D 82.2% · R 15.2% · Other 2.7%
- 2008→2024 swing
- +6.7pp toward D · 2008: 60.3pp · 2024: 67.0pp
- All cycles
- 2024: D+67.0 2020: D+68.2 2016: D+66.2 2012: D+62.5 2008: D+60.3
Not yet ingested
- Civics
- —
Market trends
- HPI YoY
- ▼ -72.43%
- Current HPI
- 175.4465
- Rent YoY
- —
- Metro
- New Orleans-Metairie, LA
- State GDP YoY
- ▲ 3.29%
- F500 in state
- 10
Industry mix (Fortune 500 HQ in LA)
| Industry | F500 HQs | Revenue |
|---|---|---|
| Telecommunications | 2 | $23B |
|
||
| Utilities | 1 | $12B |
|
||
| Wholesale / Distribution | 1 | $5B |
|
||
| Advertising | 1 | $2B |
|
||
Price history
+251.9% since first listed6 events — show timeline
- 2026-04-08 Listed $184,900 AcadianaMLS
- 2026-04-08 Listed $184,900 GSREIN
- 2021-06-15 Price Changed $217,000 GSREIN
- 2021-05-27 Listed $217,000 AcadianaMLS
- 1995-06-22 Sold (Public Records) $52,538 Public Records
- 1991-03-20 Sold (Public Records) $52,538 Public Records
Property tax history
+21.4%/yrLatest (2026): $2,320 · +1.0% YoY. Source: county tax records.
Cash-flow waterfall
monthlySold comps — $/sqft
last 12 mo · ≤1 miLoading sold comps…