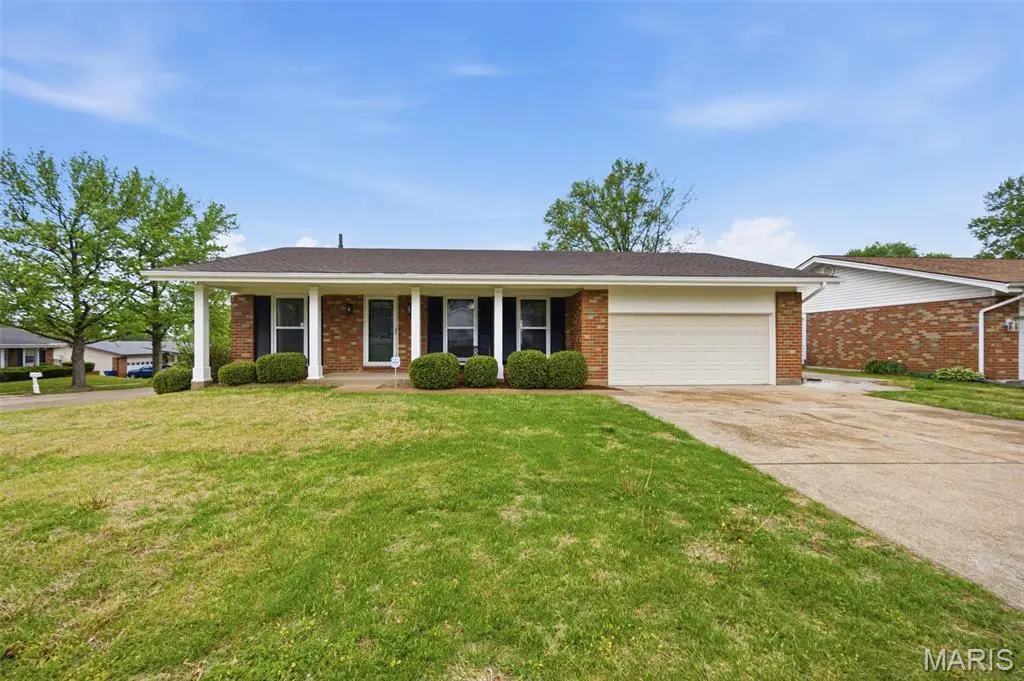
4394 Satiris Dr · Black Jack, MO
Flood risk 1/10 · Minimal
- FEMA flood zone
- X (unshaded)
- Chance of flooding over 30 yrs
- 0.0%
- Est. flood insurance / yr
- $473 – $860
Fire risk 1/10 · Minimal
- Est. fire insurance / yr
- $1,054 – $1,958
Heat risk 5/10 · Moderate
- Hot days now (above 106°F)
- 7 days/yr
- Hot days in 30 yrs
- 21 days/yr
Wind risk 2/10 · Minimal
- Chance of severe wind over 30 yrs
- 1.0%
Air-quality risk 3/10 · Minor
- Unhealthy air days now
- 3 days/yr
- Unhealthy air days in 30 yrs
- 5 days/yr
Risk factors via First Street. Map © Google.
Why this score? — see what drove the F grade
The composite is a weighted blend of 9 inputs, each scored 0–100. Each bar is that input's sub-score; the figure is the points it added to the 100-point composite (weight × sub-score).
- Appreciation +10.0/10.0
- Cash flow +8.0/30.0
- Rent growth +4.4/5.0
- Livability +3.5/5.0
- Condition / age +2.5/5.0
- DSCR +2.1/10.0
- 1% rule +2.0/10.0
- Schools +1.7/10.0
- ARV discount +0.0/15.0
$235,000
🖨 Deal sheet 📄 Offer letter ✓ Due diligence
Listing remarks MLS
Welcome to 4394 Satiris Drive, a three-bedroom, two-full bath home in unincorporated Missouri offering 1301 square feet of potential. Featuring a full basement-partially finished and ready for your vision-this property provides ample rooms to expand or create additional living space. The home includes a garage for convenience and ceramic tile flooring. With a little TLC, This residence can truly shine. It's a blank canvas, perfect for bringing your own ideas and personal touches to life. Great opportunity for homeowners or investors looking to add value!
Key facts
- 0.26 acre lot
- 2 garage spots
- Built 1965
Property features AI
Finance
- Financial info: Seller may consider concessions; Home warranty included; Lease not considered
Exterior
- Parking: Driveway; Attached 2-car garage
- Utilities: Public water; Public sewer; Electric service by Ameren; Electricity and natural gas available; sewer and water connected
- Home design: Single-family residence; One level
- Construction: Brick and vinyl siding; Finished full basement with 8+ ft pour and storage space
- Exterior features: Storm door(s); Backyard; Front yard
Interior
- Kitchen: Stainless steel appliances; Dishwasher; Microwave; Free‑standing refrigerator
- Bedrooms: Three bedrooms on the main level
- Bathrooms: Two full bathrooms
- Heating & cooling: Natural gas heating; Central air conditioning
- Interior features: Bar; Breakfast bar; Ceiling fans
- Laundry & utility: Gas water heater
Neighborhood map
What this means for you Summary
Snapshot
- This is a 3-bed/2.0-bath single-family listed at $235k.
Deal economics
- At list price, monthly cash flow is $-238 ($-3k/yr) — negative.
- To cash-flow at today's rent, offer at most $193k (17.9% below list).
- To meet the 1% rule (rent ≥ 1% of price), the offer needs to be $165k (29.7% below list).
- Recommended offer: $165k (29.7% below list) — sets the bar for 1% rule.
Location & tenants
- Location reads 70/100 on livability (#132 in MO) — a middle-class / working-renter tenant base. Strengths: cost of living A+, housing A+; Watch: health & safety C-, crime D+, amenities F.
- Hazelwood (suburban): math 11% / reading 26% proficiency, ranked #306 of 324 in MO (top 94%) — low school quality limits family demand, transient renter base, plan for 1-2y turnover.
- Zoned schools: Jury Elem. (math 5% / reading 19%, grade F, #1,016 of 1,115 statewide, top 92%, 420 students, 99% FRL); Hazelwood Central High (math 12% / reading 33%, grade F, #455 of 521 statewide, top 88%, 1,628 students, 52% FRL) — zoned schools average 75% FRL vs 53% district-wide (22 pts higher); higher-poverty schools than district average — tighter screening recommended.
- Market conditions: Rents rising fast (+7.5%/yr); 218 active listings in the ZIP; 20 comparable units currently listed for rent nearby; rentals at typical pace (median 24d on market — plan ~3-4 weeks tenant-placement turnaround); 45% of comp listings sitting > 30 days — soft ceiling on asking rent; 920 units permitted in St. Louis County in 2024 (250 in 5+ unit buildings).
Forward outlook
- In year one you build about $25k of equity ($2k loan paydown + $24k appreciation (10.0% local appreciation)).
- By year 2, paydown + projected appreciation supports a ~$40k cash-out refi (75% LTV) — recoverable capital for the next deal without selling this one.
Negotiation context
- Only 12 days on market — expect competitive offers; lowballing is unlikely to land.
- 2 sale attempts with the ask held roughly flat each time — persistent listings suggest the price (not the market) is what's stuck; bring a comps-based counter.
- Current owner paid $129k; list at $235k implies a 82% gain — meaningful room to come down on a strong offer.
Risks & watch-outs
- Climate carrying-cost: extreme-heat days projected 7→21/yr by 2055 (HVAC capex compounding) — expect insurance premiums to compound above CPI over the hold.
Questions for the listing agent
- What do current leases actually rent for vs. the listed asking? Can we see a recent rent roll and the last 12 months of T-12 income?
- Built in 1965 — when were the roof, HVAC, electrical panel, plumbing, and water heater last replaced?
- Is there a deadline driving the sale (1031 exchange, divorce, estate, relocation)? That informs how much negotiation room exists.
- Crime grade is D in this area — have there been break-ins, vandalism, or insurance claims at this property in the last 3 years? What carrier currently insures it and at what premium?
- The area grade is low — what's the realistic commute time and amenity access for the typical tenant pool here? Any planned neighborhood developments (good or bad) we should know about?
- What's the average days-on-market for RENTAL listings here right now (not sales)? A rising rental-DOM trend means longer vacancies and softer asking-rent achievability than the comps imply.
- What's the recent tenant-quality profile in this submarket — average credit score on applications, eviction rate, late-payment / NSF rate, and stable-employment percentage? A property-management company in the area should have these aggregated.
- How much new for-sale + rental construction is in the pipeline within 1–3 miles? Heavy new supply typically softens prices + rents 12–24 months out; constrained supply supports both.
Investment metrics
- 1% rule
- 0.70% ✗
- Cap rate
- 5.08%
- Cash-on-cash
- -4.33%
- DSCR
- 0.81
- GRM
- 11.9
CMA / ARV
- ARV (on-the-fly)
- $199,053
- Comps found
- 12
Show comp detail 12 sales within ~0.75 mi
| Address | Dist | Beds/Ba | Sqft | Sold | Price | $/sf | Match |
|---|---|---|---|---|---|---|---|
| 4394 Satiris Dr | 0.00mi | 3/2.0 | 1,301 (0%) | 0mo | $235,000 | $181 | 100 |
| 4428 Papal Dr | 0.18mi | 3/2.0 | 1,318 (+1%) | 6mo | $129,900 | $99 | 85 |
| 4333 Caracalla Dr | 0.21mi | 3/2.5 | 1,271 (-2%) | 3mo | $225,000 | $177 | 82 |
| 11565 Mehl Ave | 0.15mi | 2/1.5 (-1) | 1,270 (-2%) | 4mo | $81,000 | $64 | 79 |
| 11678 Galba Dr | 0.43mi | 3/2.0 | 1,292 (-1%) | 2mo | $129,900 | $101 | 77 |
| 4451 Rhine Dr | 0.15mi | 3/2.0 | 1,421 (+9%) | 0mo | $165,000 | $116 | 77 |
| 4443 Remus Dr | 0.19mi | 4/2.5 (+1) | 1,354 (+4%) | 3mo | $224,900 | $166 | 75 |
| 4384 Remus Dr | 0.11mi | 3/2.0 | 1,128 (-13%) | 2mo | $209,900 | $186 | 71 |
| 11962 Nero Dr | 0.33mi | 3/2.0 | 1,440 (+11%) | 1mo | $220,000 | $153 | 66 |
| 4377 Varano Dr | 0.39mi | 3/2.0 | 1,155 (-11%) | 2mo | $150,000 | $130 | 62 |
| 4950 Patricia Ridge Dr | 0.46mi | 3/1.5 | 1,124 (-14%) | 4mo | $177,500 | $158 | 51 |
| 12415 Danube Dr | 0.75mi | 3/2.0 | 1,124 (-14%) | 6mo | $150,000 | $133 | 38 |
Match score weights: distance 35% · size 25% · config 20% · recency 20%. Top-matched comps best support the ARV.
Projected returns pro-forma
10.0% appreciation · 7.51% rent growth · sell at horizon
- IRR
- 22.5%
- Equity multiple
- 2.83×
- Total profit
- $120,664
- Equity at exit
- $211,707
- IRR
- 21.2%
- Equity multiple
- 6.87×
- Total profit
- $386,234
- Equity at exit
- $456,553
Cash invested: $65,800 (down + closing). Projections, not guarantees.
Landlord ↔ Tenant lean methodology
- Overall (STATE)
- 81 Strongly Landlord-Friendly
- State Missouri
- 81 Strongly Landlord-Friendly · R+10
- County
- — inherits STATE
- City
- — inherits STATE
ZIP-level market 63033
- Home prices YoY
- 2.5%
- Rents YoY
- 7.5%
- Active inventory
- 218
- Price-to-rent
- 11.9×
Monthly cashflow live
- Estimated rent
- $1,652 high interval (Pro) →
- Mortgage (P&I)
- −$1,232
- Tax from tax record
- −$212 /mo · $2,548/yr
- Insurance
- −$98
- HOA
- −$0
- Vacancy / Maint / Mgmt
- −$347
- Net cashflow
- $-238
Break-even live
UW: 25.0% down · 7.5% · 30yr · 1.5% tax · 5.0% vac · 8.0% maint · 8.0% mgmt
Financing live
Cash to close
- Down payment
- $58,750
- Closing costs
- $7,050
- Reserves months
- —
- Total cash needed
- —
Loan-product check · same deal, 3 products live
Conventional
25% down · 7.5% · 30yr
- Down + closing
- —
- Monthly P&I
- —
- Monthly cashflow
- —
- DSCR
- —
- Eligible?
- —
Personal DTI + credit; lowest rate.
DSCR
20% down · 8.5% · 30yr
- Down + closing
- —
- Monthly P&I
- —
- Monthly cashflow
- —
- DSCR
- —
- Eligible?
- —
No personal income docs; deal must DSCR.
Hard money
10% down · 12.0% · 12mo
- Down + closing
- —
- Monthly P&I
- —
- Monthly cashflow
- —
- DSCR
- —
- Eligible?
- —
Short-term bridge; refi at stabilization.
Rent comps 20 comps
| Address | Beds | Baths | Sqft | Rent | $/sqft | DOM | Units | Dist |
|---|---|---|---|---|---|---|---|---|
| 11635 Hazeloak Dr Black Jack, MO | 3.0 | 2.0 | 1124 | $1,728 | $1.54 | 17d | 1 | 0.49mi |
| 2745 Rottingdean Dr St. Louis, MO | 1.0–2.0 | 1.0 | 825 | $975 | $1.18 | 43d | 1 | 0.50mi |
| 4872 Bristol Rock Rd Black Jack, MO | 4.0 | 2.0 | 1448 | $2,061 | $1.42 | 1d | 1 | 0.59mi |
| 2544 Netherton Dr Saint Louis, MO | 3.0 | 2.0 | 1288 | $1,945 | $1.51 | 1d | 1 | 0.89mi |
| 4583 Whisper Lake Dr Black Jack, MO | 1.0–5.0 | 1.0–2.5 | 1225 | $1,156 | $0.94 | 1d | 17 | 0.91mi |
| 2257 Luxmore Dr Saint Louis, MO | 3.0 | 3.0 | 1073 | $1,495 | $1.39 | 23d | 1 | 1.09mi |
| 1670 Arundel Dr Florissant, MO | 3.0 | 2.0 | 1012 | $1,450 | $1.43 | 23d | 1 | 1.21mi |
| 1536 Springlet Ct #31 Florissant, MO | 3.0 | 2.5 | 1161 | $1,450 | $1.25 | 7d | 1 | 1.23mi |
| 2259 Ainsworth Dr Saint Louis, MO | 4.0 | 2.0 | 1561 | $2,100 | $1.35 | 1d | 1 | 1.24mi |
| 2259 Ainsworth Dr Saint Louis, MO | 4.0 | 2.0 | 1500 | $1,776 | $1.18 | 43d | 1 | 1.24mi |
| 1502 Summer Run Dr #108 Florissant, MO | 2.0 | 1.5 | 922 | $1,200 | $1.30 | 23d | 1 | 1.28mi |
| 10329 Chesley Dr Saint Louis, MO | 3.0 | 1.0 | 1014 | $1,350 | $1.33 | 23d | 1 | 1.36mi |
| 62 Capitol Hill Dr Saint Louis, MO | 3.0 | 2.0 | 1239 | $1,250 | $1.01 | 43d | 1 | 1.38mi |
| 3582 Pershall Rd Unit 3631 Ferguson, MO | 2.0 | 2.0 | 1500 | $1,295 | $0.86 | 43d | 1 | 1.39mi |
| 1915 Green Valley Dr Saint Louis, MO | 4.0 | 2.0 | 1740 | $1,500 | $0.86 | 3d | 1 | 1.40mi |
| 10304 Bon Oak Dr Saint Louis, MO | 3.0 | 1.5 | 1500 | $1,250 | $0.83 | 43d | 1 | 1.41mi |
| 1547 Babcock Dr Saint Louis, MO | 3.0 | 1.0 | 1014 | $1,480 | $1.46 | 43d | 1 | 1.42mi |
| 3585 Pershall Rd Ferguson, MO | 2.0 | 2.0 | 1388 | $1,400 | $1.01 | 43d | 1 | 1.44mi |
| 3585 Pershall Rd Unit Moor Ferguson, MO | 3.0 | 2.0 | 1577 | $1,500 | $0.95 | 43d | 1 | 1.44mi |
| 3585 Pershall Rd Unit Savana Ferguson, MO | 2.0 | 1.5 | 1518 | $1,375 | $0.91 | 43d | 1 | 1.44mi |
Listing history 10 events
-
2026-04-29status Pending
-
2026-04-17$235,000 Active
-
2026-04-16historical $235,000
-
2025-12-18soldstatus Closed 564-char remark
Show marketing remark (564 chars)
Welcome to 4394 Satiris Drive, a three-bedroom, two-full bath home in unincorporated Missouri offering 1301 square feet of potential. Featuring a full basement-partially finished and ready for your vision-this property provides ample rooms to expand or create additional living space. The home includes a garage for convenience and ceramic tile flooring. With a little TLC, This residence can truly shine. It's a blank canvas, perfect for bringing your own ideas and personal touches to life. Great opportunity for homeowners or investors looking to add value!
-
2025-11-29status Pending 564-char remark
Show marketing remark (564 chars)
Welcome to 4394 Satiris Drive, a three-bedroom, two-full bath home in unincorporated Missouri offering 1301 square feet of potential. Featuring a full basement-partially finished and ready for your vision-this property provides ample rooms to expand or create additional living space. The home includes a garage for convenience and ceramic tile flooring. With a little TLC, This residence can truly shine. It's a blank canvas, perfect for bringing your own ideas and personal touches to life. Great opportunity for homeowners or investors looking to add value!
-
2025-11-28$169,900 Active 564-char remark
Show marketing remark (564 chars)
Welcome to 4394 Satiris Drive, a three-bedroom, two-full bath home in unincorporated Missouri offering 1301 square feet of potential. Featuring a full basement-partially finished and ready for your vision-this property provides ample rooms to expand or create additional living space. The home includes a garage for convenience and ceramic tile flooring. With a little TLC, This residence can truly shine. It's a blank canvas, perfect for bringing your own ideas and personal touches to life. Great opportunity for homeowners or investors looking to add value!
-
2025-11-26historical $169,900 564-char remark
Show marketing remark (564 chars)
Welcome to 4394 Satiris Drive, a three-bedroom, two-full bath home in unincorporated Missouri offering 1301 square feet of potential. Featuring a full basement-partially finished and ready for your vision-this property provides ample rooms to expand or create additional living space. The home includes a garage for convenience and ceramic tile flooring. With a little TLC, This residence can truly shine. It's a blank canvas, perfect for bringing your own ideas and personal touches to life. Great opportunity for homeowners or investors looking to add value!
-
2004-08-05soldstatus
-
2004-08-05soldstatus $129,300
-
1979-09-01soldstatus
ⓘ Source: listings_history table (triggers on properties + properties_extension) + one-shot
backfill from property_details.listing_events for pre-trigger history.
Tax reassessment forecast MO · Resets to sale price
- Current annual tax
- $2,548 · $212/mo
- Projected year-2 tax
- $2,548 · $212/mo
- Expected delta
- $0/yr ($0/mo · 0.0%)
ⓘ Screening estimate from a state-policy table — verify with the county assessor before closing.
Climate risk First Street
- Flood 1/10 Low FEMA zone X (unshaded) · 0% chance over 30 yrs
- Wildfire 1/10 Low
- Heat 5/10 Major 7 d/yr ≥106°F today · 21 d/yr by 30 yrs out
- Wind 2/10 Low 100% chance of damaging wind over 30 yrs
- Air quality 3/10 Moderate 3 unhealthy d/yr today · 5 by 30 yrs out
Nearby sold comps map
Loading sold comps map…
Walkable amenities ~0.75 mi
Loading nearby amenities…
Taxation est. · year 1
- Rental income
- $19,823
- − Mortgage interest
- −$13,164
- − Property taxes
- −$2,548
- − Insurance
- −$1,175
- − Repairs & maintenance
- −$1,586
- − Management
- −$1,586
- − Depreciation
- −$6,836
- Taxable loss
- −$7,072
- Est. tax savings @ 24.0%
- +$1,697
- After-tax cash flow
- $-1,154/yr
For passive investors: Depreciation is non-cash, so a rental often shows a tax loss while cash-flowing — sheltering income. Rental losses are passive: they offset passive income freely, and up to $25,000/yr can offset ordinary (W-2) income if you actively participate and your MAGI is under $100k (phasing out to $0 by $150k); unused losses carry forward. On sale, claimed depreciation is recaptured at up to 25%, and gains may owe capital-gains tax (a 1031 exchange can defer both). Figures are a year-1 estimate at your 24.0% rate — not tax advice; consult a CPA.
Schools (NCES district)
- District
- Hazelwood
- NCES district ID
- 2913830
- Math proficiency
- 11% ▼ -13.00%
- Reading proficiency
- 26% ▼ -6.00%
- Median HH income
- $51,621
- Composite
- 16.77/100
- National rank
- #9156
- State rank
- #306 of 324 in MO
Livability — Black Jack
- Score
- 70/100
- State rank
- #132
- US rank
- #7706
Category grades
Schools grade is shown separately in the Schools card above.
Census & demographics
- County
- Saint Louis County · 888,823 people
- City population
- 42,258
- Metro
- St. Louis, MO-IL
- Population (ZIP)
- 43,056
- Household income
- $66,776
- Rent vs Own
- Severe rent burden
- 1429.0
Population outlook (St. Louis County) Hauer SSP2
- Today (2025)
- 1,025,227 people
- By 2030
- 1,028,023 · +0.3%
- By 2040
- 1,020,940 · -0.4%
- By 2050
- 1,007,280 · -1.8%
- By 2075
- 987,277 · -3.7%
- By 2100
- 921,984 · -10.1%
Race, ethnicity, and origin ACS 2023
- Neighborhood character
- Predominantly Black (71%)
- Race & ethnicity
- Black 71% White 23% Two or more races 4% Hispanic / Latino 1%
- Common ancestry
- Romanian 1% Lithuanian 1% Italian 1%
- Foreign-born
- 3% · Canada, Vietnam
- Languages at home
- 95% English-only · Spanish 1% French/Haitian/Cajun 1%
Political lean MEDSL · St. Louis
- 2024 margin
- Strong D (+23.4) · D 60.8% · R 37.4% · Other 1.7%
- 2008→2024 swing
- +3.5pp toward D · 2008: 19.9pp · 2024: 23.4pp
- All cycles
- 2024: D+23.4 2020: D+24.0 2016: D+16.2 2012: D+13.7 2008: D+19.9
Not yet ingested
- Civics
- —
Market trends
- HPI YoY
- ▲ 13.78%
- Current HPI
- 570.6
- Rent YoY
- ▲ 7.51%
- Metro
- St. Louis, MO-IL
- State GDP YoY
- ▲ 1.84%
- F500 in state
- 20
Industry mix (Fortune 500 HQ in MO)
| Industry | F500 HQs | Revenue |
|---|---|---|
| Healthcare | 1 | $163B |
|
||
| Insurance | 1 | $21B |
|
||
| Industrial Technology | 1 | $17B |
|
||
| Retail | 1 | $16B |
|
||
| Industrial Distribution | 1 | $10B |
|
||
| Utilities | 1 | $9B |
|
||
Price history
+81.7% since first listed10 events — show timeline
- 2026-04-29 Pending — MARIS as Distributed by MLS Grid
- 2026-04-17 Listed $235,000 MARIS as Distributed by MLS Grid
- 2026-04-16 Coming Soon $235,000 MARIS as Distributed by MLS Grid
- 2025-12-18 Sold (MLS) — MARIS as Distributed by MLS Grid
- 2025-11-29 Pending — MARIS as Distributed by MLS Grid
- 2025-11-28 Listed $169,900 MARIS as Distributed by MLS Grid
- 2025-11-26 Coming Soon $169,900 MARIS as Distributed by MLS Grid
- 2004-08-05 Sold (Public Records) $129,300 Public Records
- 2004-08-05 Sold (Public Records) — Public Records
- 1979-09-01 Sold (Public Records) — Public Records
Property tax history
+3.5%/yrLatest (2022): $2,548 · +5.6% YoY. Source: county tax records.
Cash-flow waterfall
monthlySold comps — $/sqft
last 12 mo · ≤1 miLoading sold comps…