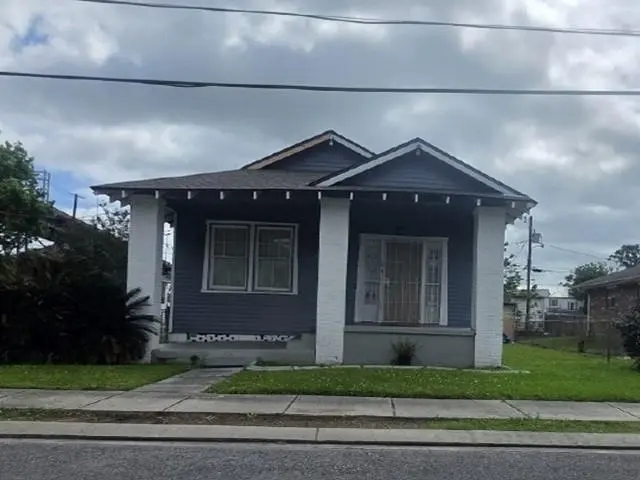
1900 Evergreen Ave · New Orleans, LA
Flood risk 8/10 · Major
- FEMA flood zone
- AE
- Chance of flooding over 30 yrs
- 0.76%
- Est. flood insurance / yr
- $1,737 – $8,500
Fire risk 1/10 · Minimal
- Est. fire insurance / yr
- $1,269 – $2,357
Heat risk 10/10 · Severe
- Hot days now (above 108°F)
- 7 days/yr
- Hot days in 30 yrs
- 21 days/yr
Wind risk 10/10 · Severe
- Chance of severe wind over 30 yrs
- 99.0%
Air-quality risk 2/10 · Minimal
- Unhealthy air days now
- 2 days/yr
- Unhealthy air days in 30 yrs
- 2 days/yr
Risk factors via First Street. Map © Google.
Why this score? — see what drove the B+ grade
The composite is a weighted blend of 9 inputs, each scored 0–100. Each bar is that input's sub-score; the figure is the points it added to the 100-point composite (weight × sub-score).
- Cash flow +30.0/30.0
- ARV discount +15.0/15.0
- 1% rule +10.0/10.0
- DSCR +10.0/10.0
- Livability +4.0/5.0
- Condition / age +2.5/5.0
- Rent growth +2.3/5.0
- Schools +1.6/10.0
- Appreciation +0.0/10.0
$96,460
🖨 Deal sheet 📄 Offer letter ✓ Due diligence
Listing remarks MLS
Opportunity awaits in this cozy two bedroom, one and a half bath home. Covered porch to enjoy morning coffee or an afternoon beverage. Work is required to make this home move in ready but could be worth the effort. Whether you decide to customize this home for yourself or rent it out, this house could be a great option.
Key facts
- Covered porch
- 3,963 sq ft lot
- Built 1940
Tags
Property features AI
Exterior
- Utilities: Public water; Public sewer
- Home design: Single-story; Shingle roof; Frame construction
- Construction: Built with frame construction
- Exterior features: City lot; Rectangular lot
Interior
- Bedrooms: Total of 4 rooms (includes bedrooms and living spaces)
- Bathrooms: 1 full bathroom; 1 half bathroom
- Heating & cooling: Central heating; Central air conditioning
- Interior features: Average condition
Neighborhood map
What this means for you Summary
Snapshot
- This is a 2-bed/1.5-bath single-family listed at $96k.
Deal economics
- At list price, monthly cash flow is $120 ($1k/yr) — positive.
- The deal already cash-flows at list — no discount required.
- Meets the 1% rule at list price ($2k rent vs $96k).
- Cap rate 13.1% vs local median 4.4% in New Orleans — top-decile yield for the area; either an underpriced asset or a hidden risk that comps aren't pricing in. Stress-test before assuming the spread holds.
Location & tenants
- Location reads 81/100 on livability (#3 in LA, #1,383 nationally) — a professional / high-income tenant draw. Strengths: amenities A+, commute A+, health & safety A+; Watch: crime C-, employment D.
- Orleans Parish (urban): math 11% / reading 27% proficiency, ranked #69 of 98 in LA (top 70%) — low school quality limits family demand, transient renter base, plan for 1-2y turnover; 68% free/reduced lunch — lower-income household profile, screen leases tightly.
- Market conditions: Rents soft (-0.7%/yr); 265 active listings in the ZIP; 40 comparable units currently listed for rent nearby; rentals at typical pace (median 24d on market — plan ~3-4 weeks tenant-placement turnaround); lower-income renter base — watch delinquency; 710 units permitted in Orleans Parish in 2024 (244 in 5+ unit buildings).
- This rent runs 42% of the median local income ($43k/yr) — at the standard rent-burdened threshold; future hikes will face affordability resistance.
Forward outlook
- Local home prices are declining (-3.0%/yr); year-one equity from $667 of loan paydown is wiped out by about $3k of value loss. Plan a longer hold.
- Orleans County population projected at +61% by 2050 — long-run rental-demand tailwind backs the buy-and-hold thesis.
Negotiation context
- Only 13 days on market — expect competitive offers; lowballing is unlikely to land.
- 7 sale attempts since 30y ago with the ask held roughly flat each time — persistent listings suggest the price (not the market) is what's stuck; bring a comps-based counter.
Risks & watch-outs
- Watch-outs: flood insurance adds $427/mo; built in 1940 — expect roof / HVAC / electrical / plumbing capex.
- Climate carrying-cost: in FEMA flood zone AE (mandatory federal flood insurance); severe wind risk, 99% chance of damaging wind over 30y; extreme-heat days projected 7→21/yr by 2055 (HVAC capex compounding) — expect insurance premiums to compound above CPI over the hold.
Questions for the listing agent
- Built in 1940 — when were the roof, HVAC, electrical panel, plumbing, and water heater last replaced?
- What's the actual annual flood-insurance premium (NFIP or private), and is the property in a SFHA with mandatory coverage?
- Is there a deadline driving the sale (1031 exchange, divorce, estate, relocation)? That informs how much negotiation room exists.
- What's the average days-on-market for RENTAL listings here right now (not sales)? A rising rental-DOM trend means longer vacancies and softer asking-rent achievability than the comps imply.
- What's the recent tenant-quality profile in this submarket — average credit score on applications, eviction rate, late-payment / NSF rate, and stable-employment percentage? A property-management company in the area should have these aggregated.
- How much new for-sale + rental construction is in the pipeline within 1–3 miles? Heavy new supply typically softens prices + rents 12–24 months out; constrained supply supports both.
Investment metrics
- 1% rule
- 1.59% ✓
- Cap rate
- 13.10%
- Cash-on-cash
- 24.30%
- DSCR
- 2.08
- GRM
- 5.2
CMA / ARV
- ARV (median comp)
- $173,474
- List price
- $96,460
- Delta
- -44.40%
- Verdict
- UNDERPRICED
- Comps
- 20 within 1.0 mi
Show comp detail 6 sales within ~0.75 mi
| Address | Dist | Beds/Ba | Sqft | Sold | Price | $/sf | Match |
|---|---|---|---|---|---|---|---|
| 1518 Leboeuf St | 0.34mi | 2/1.0 | 1,095 (+4%) | 3mo | $15,000 | $14 | 74 |
| 819 Hancock St | 0.44mi | 2/1.0 | 973 (-8%) | 1mo | $150,000 | $154 | 63 |
| 1410 Hendee St | 0.54mi | 3/2.5 (+1) | 1,150 (+9%) | 0mo | $90,000 | $78 | 51 |
| 615 Perry St | 0.49mi | 2/2.0 | 1,198 (+13%) | 4mo | $230,000 | $192 | 50 |
| 930 Thayer St | 0.64mi | 2/1.0 | 966 (-8%) | 6mo | $91,000 | $94 | 49 |
| 1401 Nunez St | 0.36mi | 3/2.0 (+1) | 1,213 (+15%) | 8mo | $175,000 | $144 | 44 |
Match score weights: distance 35% · size 25% · config 20% · recency 20%. Top-matched comps best support the ARV.
Projected returns pro-forma
-3.0% appreciation · 0.0% rent growth · sell at horizon
- IRR
- -13.1%
- Equity multiple
- 0.55×
- Total profit
- $-12,174
- Equity at exit
- $14,382
- IRR
- -13.8%
- Equity multiple
- 0.37×
- Total profit
- $-16,960
- Equity at exit
- $8,340
Cash invested: $27,009 (down + closing). Projections, not guarantees.
Landlord ↔ Tenant lean methodology
- Overall (STATE)
- 90 Strongly Landlord-Friendly
- State Louisiana
- 90 Strongly Landlord-Friendly · R+12
- County
- — inherits STATE
- City
- — inherits STATE
ZIP-level market 70114
- Rents YoY
- -0.7%
- Active inventory
- 265
- Price-to-rent
- 5.2×
Monthly cashflow live
- Estimated rent
- $1,536 high interval (Pro) →
- Mortgage (P&I)
- −$506
- Tax est. 1.5%
- −$121 /mo · $1,447/yr
- Insurance
- −$40
- Flood insurance flood zone
- −$427 /mo · $5,118/yr
- HOA
- −$0
- Vacancy / Maint / Mgmt
- −$323
- Net cashflow
- $120
Break-even live
UW: 25.0% down · 7.5% · 30yr · 1.5% tax · 5.0% vac · 8.0% maint · 8.0% mgmt
Financing live
Cash to close
- Down payment
- $24,115
- Closing costs
- $2,894
- Reserves months
- —
- Total cash needed
- —
Loan-product check · same deal, 3 products live
Conventional
25% down · 7.5% · 30yr
- Down + closing
- —
- Monthly P&I
- —
- Monthly cashflow
- —
- DSCR
- —
- Eligible?
- —
Personal DTI + credit; lowest rate.
DSCR
20% down · 8.5% · 30yr
- Down + closing
- —
- Monthly P&I
- —
- Monthly cashflow
- —
- DSCR
- —
- Eligible?
- —
No personal income docs; deal must DSCR.
Hard money
10% down · 12.0% · 12mo
- Down + closing
- —
- Monthly P&I
- —
- Monthly cashflow
- —
- DSCR
- —
- Eligible?
- —
Short-term bridge; refi at stabilization.
Rent comps 40 comps
| Address | Beds | Baths | Sqft | Rent | $/sqft | DOM | Units | Dist |
|---|---|---|---|---|---|---|---|---|
| 718 Majestic Pl New Orleans, LA | 3.0 | 2.0 | 1164 | $1,785 | $1.53 | 21d | 1 | 0.28mi |
| 1010 Isbell St Gretna, LA | 3.0 | 1.0 | 1300 | $1,350 | $1.04 | 43d | 1 | 0.44mi |
| 606 Drum St New Orleans, LA | 3.0 | 2.0 | 1131 | $2,350 | $2.08 | 23d | 1 | 0.51mi |
| 1140 Teche St Apt B New Orleans, LA | 3.0 | 1.0 | 1100 | $1,850 | $1.68 | 23d | 1 | 0.54mi |
| 1510 Sumner St New Orleans, LA | 2.0 | 1.0 | 950 | $1,474 | $1.55 | 16d | 1 | 0.56mi |
| 1136 Brooklyn Ave New Orleans, LA | 3.0 | 1.0 | 913 | $1,600 | $1.75 | 23d | 1 | 0.57mi |
| 507 Newton St New Orleans, LA | 2.0 | 2.0 | 1150 | $1,400 | $1.22 | 23d | 1 | 0.61mi |
| 731 Anson St Gretna, LA | 1.0 | 1.0 | 750 | $1,000 | $1.33 | 43d | 1 | 0.62mi |
| 909 Atlantic Ave New Orleans, LA | 2.0 | 1.0 | 741 | $1,200 | $1.62 | 23d | 1 | 0.64mi |
| 517 Burmaster St Gretna, LA | 2.0 | 1.0 | 900 | $1,600 | $1.78 | 43d | 1 | 0.64mi |
| 1418 Behrman Ave New Orleans, LA | 2.0 | 1.0 | 876 | $1,400 | $1.60 | 16d | 1 | 0.65mi |
| 435 Homer St New Orleans, LA | 1.0 | 1.0 | 950 | $1,100 | $1.16 | 23d | 1 | 0.69mi |
| 1421 23 Numa St New Orleans, LA | 3.0 | 2.0 | 861 | $1,400 | $1.63 | 14d | 1 | 0.69mi |
| 1421 23 Numa St New Orleans, LA | 3.0 | 2.0 | 861 | $1,400 | $1.63 | 2d | 1 | 0.69mi |
| 1421 Numa St Unit 1421 New Orleans, LA | 3.0 | 2.0 | 861 | $1,400 | $1.63 | 23d | 1 | 0.69mi |
| 1108 Sumner St New Orleans, LA | 3.0 | 1.5 | 1197 | $1,500 | $1.25 | 11d | 1 | 0.72mi |
| 733 Elmira Ave New Orleans, LA | 2.0 | 1.0 | 864 | $1,100 | $1.27 | 23d | 1 | 0.75mi |
| 740 Thayer Unit 2A New Orleans, LA | 2.0 | 2.0 | 950 | $1,350 | $1.42 | 23d | 1 | 0.77mi |
| 807 Whitney Ave Unit 1 New Orleans, LA | 3.0 | 2.0 | 1262 | $1,500 | $1.19 | 3d | 1 | 0.78mi |
| 810 Whitney Ave New Orleans, LA | 2.0 | 1.0 | 900 | $1,250 | $1.39 | 11d | 1 | 0.79mi |
| 1318 Monroe St Gretna, LA | 2.0 | 1.0 | 1200 | $1,595 | $1.33 | 3d | 1 | 0.82mi |
| 1320 Monroe St Gretna, LA | 2.0 | 2.0 | 1030 | $2,000 | $1.94 | 23d | 1 | 0.82mi |
| 625 Atlantic Ave New Orleans, LA | 2.0 | 1.0 | 780 | $1,400 | $1.79 | 17d | 1 | 0.83mi |
| 620 Opelousas Ave Unit 103 New Orleans, LA | 2.0 | 1.5 | 1000 | $1,650 | $1.65 | 3d | 1 | 0.84mi |
| 1625 Lauradale Dr New Orleans, LA | 3.0 | 2.0 | 1029 | $1,700 | $1.65 | 3d | 1 | 0.85mi |
| 2243 Kraft Pl New Orleans, LA | 2.0 | 1.0 | 865 | $1,200 | $1.39 | 23d | 1 | 0.85mi |
| 611 Pacific Ave New Orleans, LA | 1.0 | 1.0 | 765 | $1,799 | $2.35 | 23d | 1 | 0.85mi |
| 601 Vallette St New Orleans, LA | 2.0 | 1.0 | 815 | $1,600 | $1.96 | 3d | 1 | 0.88mi |
| 543 Atlantic Ave New Orleans, LA | 2.0 | 2.5 | 1430 | $2,200 | $1.54 | 23d | 1 | 0.89mi |
| 724 Evelina St Unit B New Orleans, LA | 2.0 | 1.0 | 1000 | $1,600 | $1.60 | 17d | 1 | 0.89mi |
| 540 Pacific Ave New Orleans, LA | 1.0 | 1.0 | 900 | $1,200 | $1.33 | 23d | 1 | 0.89mi |
| 537 Pacific Ave New Orleans, LA | 2.0 | 1.0 | 750 | $1,400 | $1.87 | 3d | 1 | 0.89mi |
| 537 Pacific Ave New Orleans, LA | 2.0 | 1.0 | 750 | $1,400 | $1.87 | 3d | 1 | 0.89mi |
| 1500 Madison St Unit 3 Gretna, LA | 2.0 | 1.0 | 840 | $1,100 | $1.31 | 3d | 1 | 0.93mi |
| 1500 Madison St Unit 3 Gretna, LA | 2.0 | 1.0 | 840 | $1,100 | $1.31 | 3d | 1 | 0.93mi |
| 701 Behrman Ave New Orleans, LA | 3.0 | 2.0 | 1368 | $2,300 | $1.68 | 3d | 1 | 0.97mi |
| 521 Bouny St New Orleans, LA | 2.0 | 1.0 | 950 | $1,400 | $1.47 | 23d | 1 | 0.97mi |
| 519 Bouny St New Orleans, LA | 2.0 | 1.0 | 950 | $1,400 | $1.47 | 23d | 1 | 0.97mi |
| 500 Powder St Unit B New Orleans, LA | 2.0 | 1.0 | 1085 | $1,600 | $1.47 | 23d | 1 | 0.98mi |
| 336 Elmira Ave New Orleans, LA | 3.0 | 1.0 | 1250 | $1,825 | $1.46 | 23d | 1 | 1.06mi |
Listing history 20 events
-
2026-06-18days on market $96,460 Active 13 DOM
-
2026-06-17days on market $96,460 Active 12 DOM
-
2026-06-16days on market $96,460 Active 11 DOM
-
2026-06-15days on market $96,460 Active 10 DOM
-
2026-06-13days on market $96,460 Active 8 DOM
-
2026-06-10days on market $96,460 Active 5 DOM
-
2026-06-09days on market $96,460 Active 4 DOM
-
2026-06-08days on market $96,460 Active 3 DOM
-
2026-06-07remarks 321-char remark
-
2026-06-07statusdays on market $96,460 Active 2 DOM
-
2026-05-08$96,460 Active 318-char remark
-
2026-05-08$96,460 Active 318-char remark
-
2006-06-16soldstatus $95,000
-
2006-06-16soldstatus $95,000
-
2006-04-29$100,000
-
2006-04-29$100,000
-
1996-05-21soldstatus $54,000
-
1996-05-15soldstatus $54,400
-
1996-03-07$55,000
-
1996-03-07$55,000
ⓘ Source: listings_history table (triggers on properties + properties_extension) + one-shot
backfill from property_details.listing_events for pre-trigger history.
Climate risk First Street
- Flood 8/10 Severe FEMA zone AE · 76% chance over 30 yrs
- Wildfire 1/10 Low
- Heat 10/10 Extreme 7 d/yr ≥108°F today · 21 d/yr by 30 yrs out
- Wind 10/10 Extreme 99% chance of damaging wind over 30 yrs
- Air quality 2/10 Low 2 unhealthy d/yr today · 2 by 30 yrs out
Nearby sold comps map
Loading sold comps map…
Walkable amenities ~0.75 mi
Loading nearby amenities…
Taxation est. · year 1
- Rental income
- $18,435
- − Mortgage interest
- −$5,403
- − Property taxes
- −$1,447
- − Insurance
- −$5,601
- − Repairs & maintenance
- −$1,475
- − Management
- −$1,475
- − Depreciation
- −$2,806
- Taxable income
- $228
- Est. tax owed @ 24.0%
- −$55
- After-tax cash flow
- $1,391/yr
For passive investors: Depreciation is non-cash, so a rental often shows a tax loss while cash-flowing — sheltering income. Rental losses are passive: they offset passive income freely, and up to $25,000/yr can offset ordinary (W-2) income if you actively participate and your MAGI is under $100k (phasing out to $0 by $150k); unused losses carry forward. On sale, claimed depreciation is recaptured at up to 25%, and gains may owe capital-gains tax (a 1031 exchange can defer both). Figures are a year-1 estimate at your 24.0% rate — not tax advice; consult a CPA.
Schools (NCES district)
- District
- Orleans Parish
- NCES district ID
- 2201170
- Math proficiency
- 11% ▼ -52.00%
- Reading proficiency
- 27% ▼ -46.00%
- Median HH income
- $37,011
- Composite
- 15.78/100
- National rank
- #9271
- State rank
- #69 of 98 in LA
Livability — New Orleans
- Score
- 81/100
- State rank
- #3
- US rank
- #1383
Category grades
Schools grade is shown separately in the Schools card above.
Census & demographics
- Census place
- New Orleans, LA
- County
- Orleans Parish · 338,817 people
- City population
- 338,817
- Metro
- New Orleans-Metairie, LA
- Population (ZIP)
- 22,659
- Household income
- $43,493
- Rent vs Own
- Severe rent burden
- 2240.0
Population outlook (Orleans County) Hauer SSP2
- Today (2025)
- 513,025 people
- By 2030
- 575,781 · +12.2%
- By 2040
- 700,174 · +36.5%
- By 2050
- 826,541 · +61.1%
- By 2075
- 1,123,374 · +119.0%
- By 2100
- 1,355,609 · +164.2%
Race, ethnicity, and origin ACS 2023
- Neighborhood character
- Predominantly Black (72%)
- Race & ethnicity
- Black 72% White 16% Hispanic / Latino 8% Two or more races 5%
- Hispanic origin (detail)
- Mexican 2% Puerto Rican 1%
- Common ancestry
- Lithuanian 3% Slovak 1% Italian 1%
- Foreign-born
- 5% · Canada
- Languages at home
- 91% English-only · Spanish 6% French/Haitian/Cajun 2% Other Indo-European 1%
Political lean MEDSL · Orleans
- 2024 margin
- Solid D (+67.0) · D 82.2% · R 15.2% · Other 2.7%
- 2008→2024 swing
- +6.7pp toward D · 2008: 60.3pp · 2024: 67.0pp
- All cycles
- 2024: D+67.0 2020: D+68.2 2016: D+66.2 2012: D+62.5 2008: D+60.3
Not yet ingested
- Civics
- —
Market trends
- HPI YoY
- ▼ -98.56%
- Current HPI
- 149.0172
- Rent YoY
- ▼ -0.72%
- Metro
- New Orleans-Metairie, LA
- State GDP YoY
- ▲ 3.29%
- F500 in state
- 10
Industry mix (Fortune 500 HQ in LA)
| Industry | F500 HQs | Revenue |
|---|---|---|
| Telecommunications | 2 | $23B |
|
||
| Utilities | 1 | $12B |
|
||
| Wholesale / Distribution | 1 | $5B |
|
||
| Advertising | 1 | $2B |
|
||
Price history
+75.4% since first listed11 events — show timeline
- 2026-06-05 Listed $96,460 GSREIN
- 2026-06-05 Listed $96,460 AcadianaMLS
- 2026-05-08 Listed $96,460 AcadianaMLS
- 2006-06-16 Sold (Public Records) $95,000 Public Records
- 2006-06-16 Sold (MLS) $95,000 GSREIN
- 2006-04-29 Listed $100,000 GSREIN
- 2006-04-29 Listed $100,000 AcadianaMLS
- 1996-05-21 Sold (Public Records) $54,000 Public Records
- 1996-05-15 Sold (MLS) $54,400 GSREIN
- 1996-03-07 Listed $55,000 GSREIN
- 1996-03-07 Listed $55,000 AcadianaMLS
Property tax history
-9.0%/yrLatest (2026): $84 · -12.4% YoY. Source: county tax records.
Cash-flow waterfall
monthlySold comps — $/sqft
last 12 mo · ≤1 miLoading sold comps…