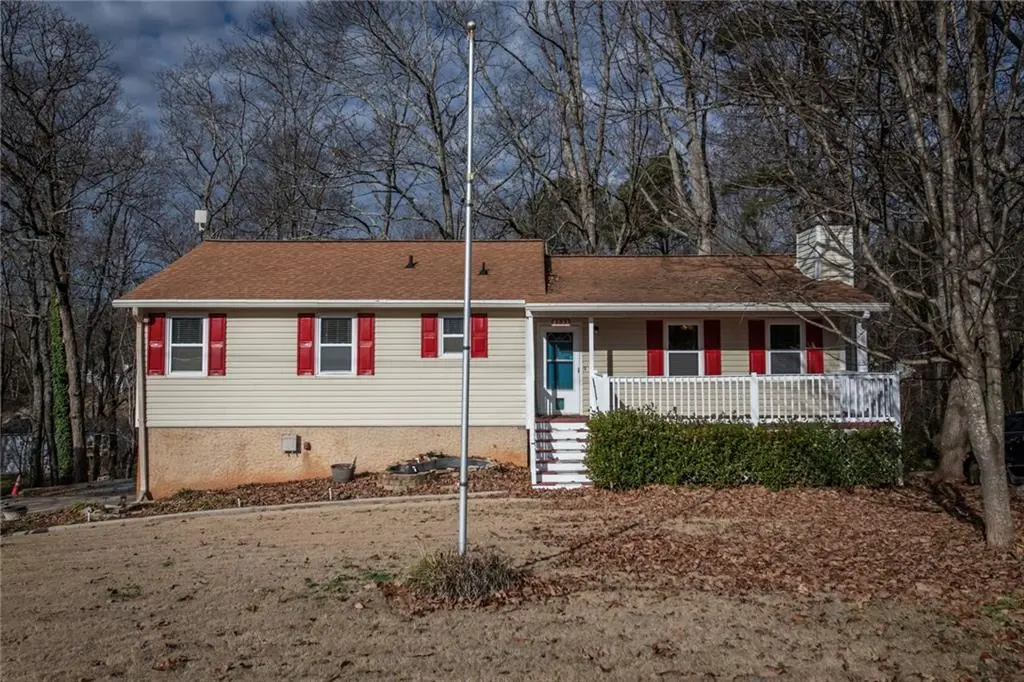
4135 Macduff Dr · Douglasville, GA
Flood risk 1/10 · Minimal
- FEMA flood zone
- X (unshaded)
- Chance of flooding over 30 yrs
- 0.0%
- Est. flood insurance / yr
- $507 – $1,088
Fire risk 2/10 · Minimal
- Est. fire insurance / yr
- $963 – $1,789
Heat risk 5/10 · Moderate
- Hot days now (above 102°F)
- 7 days/yr
- Hot days in 30 yrs
- 18 days/yr
Wind risk 5/10 · Moderate
- Chance of severe wind over 30 yrs
- 25.0%
Air-quality risk 3/10 · Minor
- Unhealthy air days now
- 4 days/yr
- Unhealthy air days in 30 yrs
- 4 days/yr
Risk factors via First Street. Map © Google.
Why this score? — see what drove the D grade
The composite is a weighted blend of 9 inputs, each scored 0–100. Each bar is that input's sub-score; the figure is the points it added to the 100-point composite (weight × sub-score).
- Cash flow +13.1/30.0
- ARV discount +10.0/15.0
- DSCR +3.9/10.0
- Livability +3.6/5.0
- 1% rule +3.0/10.0
- Schools +2.6/10.0
- Rent growth +2.5/5.0
- Condition / age +2.5/5.0
- Appreciation +0.0/10.0
$236,000
🖨 Deal sheet 📄 Offer letter ✓ Due diligence
Listing remarks MLS
***$5,000 seller credit with approved offer. Cute as a button ranch home in Douglasville. With its basement bonus/flex room and unfinished area, this 3bed/2bath home has tons of storage space. Two years old HVAC. Laminate floors in main living area, tilt sash windows, and vinyl siding exterior make maintenance a breeze. The extended front porch and back deck provide a peaceful setting.
Key facts
- 0.48 acre lot
- Garage
- Built 1978
Property features AI
Exterior
- Parking: Drive-under main level parking; Garage faces the side
- Utilities: Public water; Septic tank sewer; 220V in garage; 220V in laundry; Cable available; Electricity available; Natural gas available; Phone available; Water available
- Home design: Two levels; Resale property; Vinyl siding exterior; Composition shingle roof; Block foundation
- Construction: Vinyl siding construction; Composition shingle roof; Block foundation
- Exterior features: Front porch; Deck; Rain gutters; Exterior storage; Shed on property; Walk-out partial unfinished basement with both exterior and interior entry
Interior
- Kitchen: Laminate counters; Dishwasher; Electric range; Refrigerator
- Bedrooms: Three main-level bedrooms; Master suite on the main level
- Flooring: Carpet; Laminate; Vinyl
- Bathrooms: Two full bathrooms; Master bath with shower (no tub)
- Heating & cooling: Central heating (natural gas); Central air conditioning; Ceiling fans; Attic fan; Electric components
- Interior features: High-speed internet; His and hers closets; Double-pane windows; One gas fireplace with factory-built unit, gas log and gas starter in the living room; No shared walls
- Laundry & utility: Laundry located in basement; Electric dryer hookup in basement
Neighborhood map
What this means for you Summary
Snapshot
- This is a 3-bed/2.0-bath single-family listed at $236k.
Deal economics
- At list price, monthly cash flow is $-10 ($-122/yr) — negative.
- To cash-flow at today's rent, offer at most $234k (0.8% below list).
- To meet the 1% rule (rent ≥ 1% of price), the offer needs to be $188k (20.1% below list).
- Recommended offer: $188k (20.1% below list) — sets the bar for 1% rule.
- Cap rate 6.2% vs local median 4.5% in Douglasville — top-decile yield for the area; either an underpriced asset or a hidden risk that comps aren't pricing in. Stress-test before assuming the spread holds.
Location & tenants
- Location reads 71/100 on livability (#82 in GA) — a middle-class / working-renter tenant base. Strengths: cost of living A+, housing A+, health & safety B; Watch: crime F, amenities F.
- Douglas County (suburban): math 23% / reading 35% proficiency, ranked #92 of 174 in GA (top 53%) — low school quality limits family demand, transient renter base, plan for 1-2y turnover.
- Zoned schools: Dorsett Shoals Elementary School (math 17% / reading 37%, grade F, #689 of 1,228 statewide, top 58%, 387 students, 74% FRL); Yeager Middle School (math 22% / reading 38%, grade F, #243 of 470 statewide, top 53%, 542 students, 70% FRL); Chapel Hill High School (math 16% / reading 32%, grade F, #203 of 424 statewide, top 48%, 1,609 students, 48% FRL).
- Market conditions: Rents flat; 595 active listings in the ZIP; 19 comparable units currently listed for rent nearby; rentals leasing fast (median 13d on market — plan ~1-2 weeks tenant-placement turnaround); solid renter incomes; 595 units permitted in Douglas County in 2024 (72 in 5+ unit buildings).
Forward outlook
- Local home prices are declining (-3.0%/yr); year-one equity from $2k of loan paydown is wiped out by about $7k of value loss. Plan a longer hold.
- Douglas County population projected at +35% by 2050 — long-run rental-demand tailwind backs the buy-and-hold thesis.
Negotiation context
- It's been on market 18 days — a 2% lower offer ($232k) is reasonable based on typical stale-listing flexibility.
- 7 sale attempts with the ask held roughly flat each time — persistent listings suggest the price (not the market) is what's stuck; bring a comps-based counter.
- Current owner paid $112k; list at $236k implies a 111% gain — meaningful room to come down on a strong offer.
Risks & watch-outs
- Climate carrying-cost: moderate wind risk, 25% chance of damaging wind over 30y; extreme-heat days projected 7→18/yr by 2055 (HVAC capex compounding) — expect insurance premiums to compound above CPI over the hold.
Questions for the listing agent
- What do current leases actually rent for vs. the listed asking? Can we see a recent rent roll and the last 12 months of T-12 income?
- Built in 1978 — when were the roof, HVAC, electrical panel, plumbing, and water heater last replaced?
- Is there a deadline driving the sale (1031 exchange, divorce, estate, relocation)? That informs how much negotiation room exists.
- Crime grade is F in this area — have there been break-ins, vandalism, or insurance claims at this property in the last 3 years? What carrier currently insures it and at what premium?
- The area grade is low — what's the realistic commute time and amenity access for the typical tenant pool here? Any planned neighborhood developments (good or bad) we should know about?
- What's the average days-on-market for RENTAL listings here right now (not sales)? A rising rental-DOM trend means longer vacancies and softer asking-rent achievability than the comps imply.
- What's the recent tenant-quality profile in this submarket — average credit score on applications, eviction rate, late-payment / NSF rate, and stable-employment percentage? A property-management company in the area should have these aggregated.
- How much new for-sale + rental construction is in the pipeline within 1–3 miles? Heavy new supply typically softens prices + rents 12–24 months out; constrained supply supports both.
Investment metrics
- 1% rule
- 0.80% ✗
- Cap rate
- 6.24%
- Cash-on-cash
- -0.18%
- DSCR
- 0.99
- GRM
- 10.4
CMA / ARV
- ARV (median comp)
- $249,889
- List price
- $236,000
- Delta
- -5.56%
- Verdict
- FAIR
- Comps
- 20 within 1.0 mi
Show comp detail 12 sales within ~0.75 mi
| Address | Dist | Beds/Ba | Sqft | Sold | Price | $/sf | Match |
|---|---|---|---|---|---|---|---|
| 3990 N Quail Dr | 0.13mi | 3/2.0 | 1,342 (-1%) | 6mo | $182,500 | $136 | 86 |
| 5804 Macedin Dr | 0.33mi | 3/2.0 | 1,336 (-2%) | 2mo | $225,000 | $168 | 80 |
| 5720 Bob White Ln | 0.36mi | 4/2.0 (+1) | 1,372 (+1%) | 2mo | $205,000 | $149 | 75 |
| 4220 Kings Hwy | 0.36mi | 3/2.0 | 1,368 (+1%) | 12mo | $72,000 | $53 | 72 |
| 3730 N Quail Dr | 0.27mi | 3/2.0 | 1,401 (+3%) | 14mo | $240,000 | $171 | 71 |
| 4082 Yeager Rd | 0.25mi | 3/2.0 | 1,514 (+11%) | 1mo | $245,000 | $162 | 69 |
| 4306 Dawning Ln | 0.66mi | 3/2.0 | 1,327 (-2%) | 5mo | $265,000 | $200 | 61 |
| 3855 N Quail Dr | 0.19mi | 3/2.0 | 1,176 (-14%) | 14mo | $231,000 | $196 | 57 |
| 6070 Ridge Way | 0.56mi | 3/2.0 | 1,421 (+4%) | 12mo | $257,870 | $181 | 56 |
| 4195 Yeager Rd | 0.53mi | 3/1.5 | 1,305 (-4%) | 18mo | $201,500 | $154 | 52 |
| 3877 Canterbury Wak | 0.60mi | 3/2.0 | 1,250 (-8%) | 9mo | $253,900 | $203 | 51 |
| 6175 Marilla St | 0.60mi | 3/2.0 | 1,241 (-9%) | 13mo | $270,000 | $218 | 46 |
Match score weights: distance 35% · size 25% · config 20% · recency 20%. Top-matched comps best support the ARV.
Projected returns pro-forma
-3.0% appreciation · 0.08% rent growth · sell at horizon
- IRR
- -19.7%
- Equity multiple
- 0.33×
- Total profit
- $-44,324
- Equity at exit
- $35,188
- IRR
- -19.6%
- Equity multiple
- 0.08×
- Total profit
- $-60,473
- Equity at exit
- $20,405
Cash invested: $66,080 (down + closing). Projections, not guarantees.
Landlord ↔ Tenant lean methodology
- Overall (STATE)
- 90 Strongly Landlord-Friendly
- State Georgia
- 90 Strongly Landlord-Friendly · R+3
- County
- — inherits STATE
- City
- — inherits STATE
ZIP-level market 30135
- Rents YoY
- 0.1%
- Active inventory
- 595
- Price-to-rent
- 10.4×
Monthly cashflow live
- Estimated rent
- $1,885 high interval (Pro) →
- Mortgage (P&I)
- −$1,238
- Tax from tax record
- −$163 /mo · $1,960/yr
- Insurance
- −$98
- HOA
- −$0
- Vacancy / Maint / Mgmt
- −$396
- Net cashflow
- $-10
Break-even live
UW: 25.0% down · 7.5% · 30yr · 1.5% tax · 5.0% vac · 8.0% maint · 8.0% mgmt
Financing live
Cash to close
- Down payment
- $59,000
- Closing costs
- $7,080
- Reserves months
- —
- Total cash needed
- —
Loan-product check · same deal, 3 products live
Conventional
25% down · 7.5% · 30yr
- Down + closing
- —
- Monthly P&I
- —
- Monthly cashflow
- —
- DSCR
- —
- Eligible?
- —
Personal DTI + credit; lowest rate.
DSCR
20% down · 8.5% · 30yr
- Down + closing
- —
- Monthly P&I
- —
- Monthly cashflow
- —
- DSCR
- —
- Eligible?
- —
No personal income docs; deal must DSCR.
Hard money
10% down · 12.0% · 12mo
- Down + closing
- —
- Monthly P&I
- —
- Monthly cashflow
- —
- DSCR
- —
- Eligible?
- —
Short-term bridge; refi at stabilization.
Rent comps 19 comps
| Address | Beds | Baths | Sqft | Rent | $/sqft | DOM | Units | Dist |
|---|---|---|---|---|---|---|---|---|
| 3995 Yeager Rd Douglasville, GA | 3.0 | 2.0 | 1371 | $1,841 | $1.34 | 2d | 1 | 0.13mi |
| 3874 N Quail Dr Douglasville, GA | 3.0 | 2.0 | 1300 | $1,850 | $1.42 | 43d | 1 | 0.22mi |
| 4193 Macduff Dr Douglasville, GA | 3.0 | 2.0 | 1166 | $1,629 | $1.40 | 3d | 1 | 0.22mi |
| 5771 Macedin Dr Douglasville, GA | 3.0 | 2.0 | 1478 | $1,760 | $1.19 | 24d | 1 | 0.31mi |
| 5734 Amalfi Way Douglasville, GA | 3.0 | 1.5 | 1305 | $1,560 | $1.20 | 5d | 1 | 0.43mi |
| 3468 Rocky Creek Dr Douglasville, GA | 3.0 | 2.0 | 1460 | $1,750 | $1.20 | 18d | 1 | 0.47mi |
| 6200 King Arthur Dr Douglasville, GA | 3.0 | 1.0 | 1150 | $1,495 | $1.30 | 5d | 1 | 0.60mi |
| 6165 Marilla St Douglasville, GA | 3.0 | 2.0 | 1305 | $1,665 | $1.28 | 20d | 1 | 0.61mi |
| 3964 Wedgewood Dr Douglasville, GA | 3.0 | 2.0 | 1420 | $1,750 | $1.23 | 43d | 1 | 0.92mi |
| 5346 Orchard Pl Unit 5346 Douglasville, GA | 3.0 | 2.0 | 1525 | $1,700 | $1.11 | 4d | 1 | 1.01mi |
| 4710 Camelot Dr Douglasville, GA | 3.0 | 2.0 | 1554 | $1,100 | $0.71 | 12d | 1 | 1.06mi |
| 3584 Marshall Ct Douglasville, GA | 2.0 | 3.0 | 1851 | $1,905 | $1.03 | 20d | 1 | 1.08mi |
| 3492 Highway 5 Douglasville, GA | 1.0–2.0 | 1.0–2.0 | 887 | $1,399 | $1.58 | 2d | 7 | 1.20mi |
| 22 Fox Hall Dr Unit B Douglasville, GA | 2.0 | 1.0 | 1583 | $1,465 | $0.93 | 43d | 1 | 1.25mi |
| 3971 Highway 5 Douglasville, GA | 3.0 | 2.0 | 1382 | $1,995 | $1.44 | 4d | 1 | 1.27mi |
| 5407 Wilder Dr Douglasville, GA | 3.0 | 2.0 | 1670 | $1,650 | $0.99 | 43d | 1 | 1.28mi |
| 4841 Ventnore Pl Douglasville, GA | 4.0 | 3.0 | 1800 | $2,095 | $1.16 | 4d | 1 | 1.30mi |
| 6237 Dorsett Shoals Rd Unit A Douglasville, GA | 2.0 | 2.0 | 1164 | $1,495 | $1.28 | 5d | 1 | 1.32mi |
| 6190 Knights Ln Douglasville, GA | 4.0 | 2.5 | 1700 | $1,700 | $1.00 | 24d | 1 | 1.37mi |
Listing history 22 events
-
2026-05-02$236,000 New 388-char remark
Show marketing remark (388 chars)
***$5,000 seller credit with approved offer. Cute as a button ranch home in Douglasville. With its basement bonus/flex room and unfinished area, this 3bed/2bath home has tons of storage space. Two years old HVAC. Laminate floors in main living area, tilt sash windows, and vinyl siding exterior make maintenance a breeze. The extended front porch and back deck provide a peaceful setting.
-
2026-05-02$236,000 Active 388-char remark
Show marketing remark (388 chars)
***$5,000 seller credit with approved offer. Cute as a button ranch home in Douglasville. With its basement bonus/flex room and unfinished area, this 3bed/2bath home has tons of storage space. Two years old HVAC. Laminate floors in main living area, tilt sash windows, and vinyl siding exterior make maintenance a breeze. The extended front porch and back deck provide a peaceful setting.
-
2026-05-01historical
-
2026-05-01historical
-
2026-04-23price $236,000
-
2026-04-23price $236,000
-
2026-04-07status Back On Market
-
2026-04-07status Active
-
2026-03-29status Pending
-
2026-03-29status Under Contract
-
2026-03-19price $239,900
-
2026-03-19price $239,900
-
2026-03-01$242,900 Active
-
2026-03-01$242,900 New
-
2026-02-28historical
-
2026-02-12price $242,900
-
2026-01-28$249,900 New
-
2004-02-02soldstatus $112,000
-
1995-12-08soldstatus $67,900
-
1989-01-12soldstatus $56,850
-
1983-05-31soldstatus $51,308
-
1980-09-30soldstatus $46,900
ⓘ Source: listings_history table (triggers on properties + properties_extension) + one-shot
backfill from property_details.listing_events for pre-trigger history.
Tax reassessment forecast GA · Resets to sale price
- Current annual tax
- $1,960 · $163/mo
- Projected year-2 tax
- $2,171 · $181/mo
- Expected delta
- +$211/yr (+$18/mo · 10.8%)
ⓘ Screening estimate from a state-policy table — verify with the county assessor before closing.
Climate risk First Street
- Flood 1/10 Low FEMA zone X (unshaded) · 0% chance over 30 yrs
- Wildfire 2/10 Low
- Heat 5/10 Major 7 d/yr ≥102°F today · 18 d/yr by 30 yrs out
- Wind 5/10 Major 25% chance of damaging wind over 30 yrs
- Air quality 3/10 Moderate 4 unhealthy d/yr today · 4 by 30 yrs out
Nearby sold comps map
Loading sold comps map…
Walkable amenities ~0.75 mi
Loading nearby amenities…
Taxation est. · year 1
- Rental income
- $22,619
- − Mortgage interest
- −$13,220
- − Property taxes
- −$1,960
- − Insurance
- −$1,180
- − Repairs & maintenance
- −$1,810
- − Management
- −$1,810
- − Depreciation
- −$6,865
- Taxable loss
- −$4,225
- Est. tax savings @ 24.0%
- +$1,014
- After-tax cash flow
- $892/yr
For passive investors: Depreciation is non-cash, so a rental often shows a tax loss while cash-flowing — sheltering income. Rental losses are passive: they offset passive income freely, and up to $25,000/yr can offset ordinary (W-2) income if you actively participate and your MAGI is under $100k (phasing out to $0 by $150k); unused losses carry forward. On sale, claimed depreciation is recaptured at up to 25%, and gains may owe capital-gains tax (a 1031 exchange can defer both). Figures are a year-1 estimate at your 24.0% rate — not tax advice; consult a CPA.
Schools (NCES district)
- District
- Douglas County
- NCES district ID
- 1301860
- Math proficiency
- 23% ▼ -16.00%
- Reading proficiency
- 35% ▼ -11.00%
- Median HH income
- $55,335
- Composite
- 25.84/100
- National rank
- #7353
- State rank
- #92 of 174 in GA
Livability — Douglasville
- Score
- 71/100
- State rank
- #82
- US rank
- #6971
Category grades
Schools grade is shown separately in the Schools card above.
Census & demographics
- County
- Douglas County · 141,416 people
- City population
- 114,380
- Metro
- Atlanta-Sandy Springs-Alpharetta, GA
- Population (ZIP)
- 66,800
- Household income
- $94,526
- Rent vs Own
- Severe rent burden
- 890.0
Population outlook (Douglas County) Hauer SSP2
- Today (2025)
- 163,022 people
- By 2030
- 173,956 · +6.7%
- By 2040
- 196,859 · +20.8%
- By 2050
- 220,017 · +35.0%
- By 2075
- 279,831 · +71.7%
- By 2100
- 322,702 · +97.9%
Race, ethnicity, and origin ACS 2023
- Neighborhood character
- Diverse neighborhood (Simpson 0.63)
- Race & ethnicity
- Black 49% White 35% Hispanic / Latino 9% Two or more races 6% Asian 2%
- Hispanic origin (detail)
- Mexican 4% Puerto Rican 2%
- Common ancestry
- Hispanic 2% Slovak 1% Italian 1%
- Foreign-born
- 10% · Canada, Vietnam, Jamaica
- Languages at home
- 88% English-only · Spanish 7% French/Haitian/Cajun 2% Vietnamese 1%
Political lean MEDSL · Douglas
- 2024 margin
- Solid D (+31.4) · D 65.4% · R 33.9%
- 2008→2024 swing
- +29.6pp toward D · 2008: 1.8pp · 2024: 31.4pp
- All cycles
- 2024: D+31.4 2020: D+25.1 2016: D+10.8 2012: D+4.0 2008: D+1.8
Not yet ingested
- Civics
- —
Market trends
- HPI YoY
- ▼ -225.50%
- Current HPI
- 223.9534
- Rent YoY
- ▲ 0.08%
- Metro
- Atlanta-Sandy Springs-Alpharetta, GA
- State GDP YoY
- ▲ 2.66%
- F500 in state
- 28
Industry mix (Fortune 500 HQ in GA)
| Industry | F500 HQs | Revenue |
|---|---|---|
| Paper / Packaging | 2 | $29B |
|
||
| Retail | 1 | $160B |
|
||
| Transportation / Logistics | 1 | $91B |
|
||
| Airlines | 1 | $62B |
|
||
| Consumer Goods | 1 | $47B |
|
||
| Utilities | 1 | $25B |
|
||
Price history
+403.2% since first listed24 events — show timeline
- 2026-05-20 Pending — GAMLS
- 2026-05-20 Pending — FMLS
- 2026-05-02 Listed $236,000 FMLS
- 2026-05-02 Listed $236,000 GAMLS
- 2026-05-01 Listing Removed — FMLS
- 2026-05-01 Listing Removed — GAMLS
- 2026-04-23 Price Changed $236,000 FMLS
- 2026-04-23 Price Changed $236,000 GAMLS
- 2026-04-07 Relisted — GAMLS
- 2026-04-07 Relisted — FMLS
- 2026-03-29 Pending — FMLS
- 2026-03-29 Pending — GAMLS
- 2026-03-19 Price Changed $239,900 FMLS
- 2026-03-19 Price Changed $239,900 GAMLS
- 2026-03-01 Listed $242,900 FMLS
- 2026-03-01 Listed $242,900 GAMLS
- 2026-02-28 Listing Removed — GAMLS
- 2026-02-12 Price Changed $242,900 GAMLS
- 2026-01-28 Listed $249,900 GAMLS
- 2004-02-02 Sold (Public Records) $112,000 Public Records
- 1995-12-08 Sold (Public Records) $67,900 Public Records
- 1989-01-12 Sold (Public Records) $56,850 Public Records
- 1983-05-31 Sold (Public Records) $51,308 Public Records
- 1980-09-30 Sold (Public Records) $46,900 Public Records
Property tax history
+3.2%/yrLatest (2025): $1,960 · +1.8% YoY. Source: county tax records.
Cash-flow waterfall
monthlySold comps — $/sqft
last 12 mo · ≤1 miLoading sold comps…