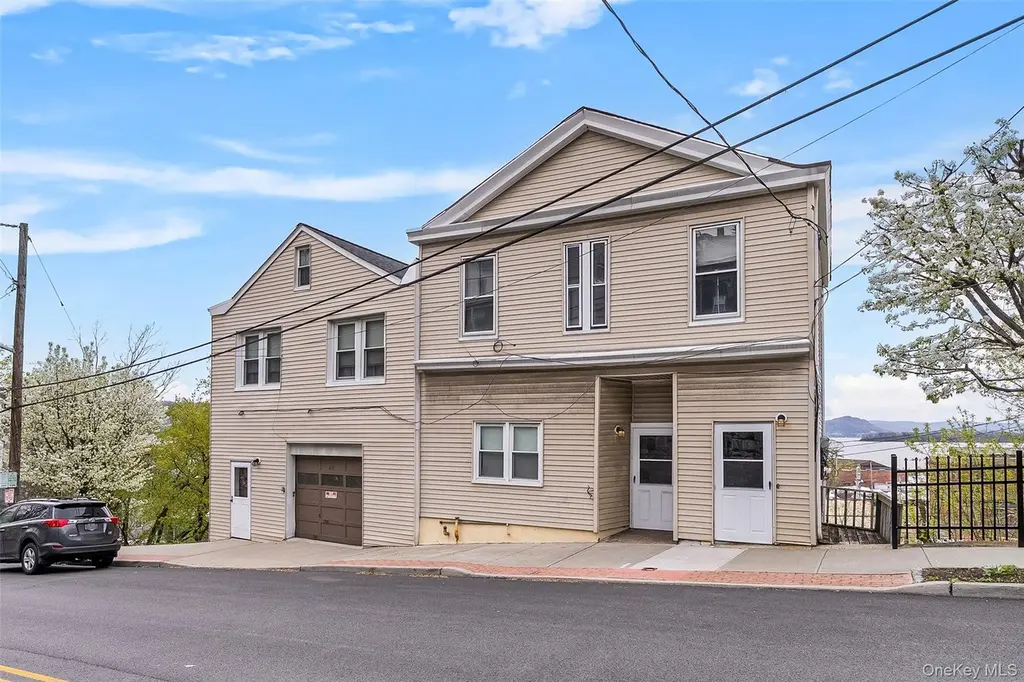
37 Secor Rd · Ossining, NY
Flood risk 1/10 · Minimal
- FEMA flood zone
- X (unshaded)
- Chance of flooding over 30 yrs
- 0.0%
- Est. flood insurance / yr
- $473 – $860
Fire risk 1/10 · Minimal
- Est. fire insurance / yr
- $691 – $1,283
Heat risk 6/10 · Moderate
- Hot days now (above 100°F)
- 7 days/yr
- Hot days in 30 yrs
- 16 days/yr
Wind risk 4/10 · Minor
- Chance of severe wind over 30 yrs
- 23.0%
Air-quality risk 3/10 · Minor
- Unhealthy air days now
- 3 days/yr
- Unhealthy air days in 30 yrs
- 4 days/yr
Risk factors via First Street. Map © Google.
Why this score? — see what drove the B grade
The composite is a weighted blend of 9 inputs, each scored 0–100. Each bar is that input's sub-score; the figure is the points it added to the 100-point composite (weight × sub-score).
- Cash flow +30.0/30.0
- 1% rule +10.0/10.0
- DSCR +10.0/10.0
- ARV discount +7.5/15.0
- Schools +6.4/10.0
- Livability +4.0/5.0
- Rent growth +2.5/5.0
- Condition / age +2.5/5.0
- Appreciation +0.0/10.0
$85,000
🖨 Deal sheet 📄 Offer letter ✓ Due diligence
Listing remarks MLS
Welcome to 37 Secor Road. Being sold strictly as-is and as a buy one get one with 39 Secor Road; You cannot pass on this deal! Get this cozy 2-bedroom, 1-bathroom single family home replete with a garage, unfinished basement and unobstructed windows to the Hudson River. This home is priced to be sold as a package with the adjoining Two family home at 39 Secor Road (MLS # 973596 offered @ $675K). These two homes are on one deed with two separate tax lots, but they are adjoined with ONE furnace and one oil tank. The single-family home is being sold for CASH ONLY while a buyer can obtain financing for the two bedroom over one-bedroom multi-family home. This is an amazing opportunity for a first time or seasoned investor. Both units are being sold strictly AS-IS but boast two new roofs. The unfinished basement extends the length of both homes. Street parking for the multi-family home, but there is a municipal lot located behind the homes. 37/39 is a short distance to the Ossining training station and down-town Ossining alike. Both homes have access to basement that can be closed off by installing a door. Unfinished basements have windows and exterior access if a buyer would like.
Key facts
- Unfinished basement
- Two new roofs
- Garage
Tags
Neighborhood map
What this means for you Summary
Snapshot
- This is a 2-bed/1.0-bath single-family listed at $85k.
Deal economics
- At list price, monthly cash flow is $2k ($23k/yr) — positive.
- The deal already cash-flows at list — no discount required.
- Meets the 1% rule at list price ($3k rent vs $85k).
- Recommended offer: $80k (6.0% below list) — sets the bar for market timing.
- Cap rate 33.0% vs local median 2.9% in Ossining — top-decile yield for the area; either an underpriced asset or a hidden risk that comps aren't pricing in. Stress-test before assuming the spread holds.
Location & tenants
- Location reads 80/100 on livability (#116 in NY, #1,876 nationally) — a professional / high-income tenant draw. Strengths: commute A+, employment A+, health & safety A; Watch: schools D+, cost of living F.
- Ossining Union Free School District (suburban): math 72% / reading 72% proficiency, ranked #104 of 590 in NY (top 18%) — strong family-tenant draw, lease renewals of 3-5y typical.
- Market conditions: 134 active listings in the ZIP; 12 comparable units currently listed for rent nearby; rentals leasing fast (median 5d on market — plan ~1-2 weeks tenant-placement turnaround); high-income renter base; 954 units permitted in Westchester County in 2024 (649 in 5+ unit buildings).
- This rent runs 33% of the median local income ($116k/yr) — at the standard rent-burdened threshold; future hikes will face affordability resistance.
Forward outlook
- Local home prices are declining (-3.0%/yr); year-one equity from $588 of loan paydown is wiped out by about $3k of value loss. Plan a longer hold.
- Westchester County population projected at +10% by 2050 — modest demand growth; plan on rents tracking national, not racing it.
- At projected returns (-3.0% appreciation + 3.0% rent growth), your $24k cash investment doubles in ~2 years — after that, you're playing with house money.
Negotiation context
- It's been on market 63 days — a 6% lower offer ($80k) is reasonable based on typical stale-listing flexibility.
Risks & watch-outs
- Watch-outs: built in 1900 — expect roof / HVAC / electrical / plumbing capex.
- Climate carrying-cost: extreme-heat days projected 7→16/yr by 2055 (HVAC capex compounding) — expect insurance premiums to compound above CPI over the hold.
Questions for the listing agent
- It's been on market 63 days. Have you received any prior offers? Is the seller open to a 6% concession, seller financing, or rate buy-down credit?
- Built in 1900 — when were the roof, HVAC, electrical panel, plumbing, and water heater last replaced?
- Why hasn't it sold? Are there any deal-killer items the seller is aware of (foundation, flood, title, zoning, code violations)?
- Is there a deadline driving the sale (1031 exchange, divorce, estate, relocation)? That informs how much negotiation room exists.
- Schools are D-rated, which usually means shorter tenancies and higher turnover. Who's the typical renter profile here, and what's been the actual vacancy rate?
- What's the average days-on-market for RENTAL listings here right now (not sales)? A rising rental-DOM trend means longer vacancies and softer asking-rent achievability than the comps imply.
- What's the recent tenant-quality profile in this submarket — average credit score on applications, eviction rate, late-payment / NSF rate, and stable-employment percentage? A property-management company in the area should have these aggregated.
- How much new for-sale + rental construction is in the pipeline within 1–3 miles? Heavy new supply typically softens prices + rents 12–24 months out; constrained supply supports both.
Investment metrics
- 1% rule
- 3.69% ✓
- Cap rate
- 33.01%
- Cash-on-cash
- 95.42%
- DSCR
- 5.25
- GRM
- 2.3
CMA / ARV
- ARV (median comp)
- $553,762
- List price
- $85,000
- Delta
- -84.65%
- Verdict
- UNDERPRICED
- Comps
- 20 within 1.0 mi
Show comp detail 8 sales within ~0.75 mi
| Address | Dist | Beds/Ba | Sqft | Sold | Price | $/sf | Match |
|---|---|---|---|---|---|---|---|
| 45 Broadway | 0.26mi | 3/1.0 (+1) | 1,332 (-4%) | 15mo | $585,000 | $439 | 64 |
| 50 Snowden Ave | 0.42mi | 2/2.5 | 1,444 (+5%) | 7mo | $530,000 | $367 | 61 |
| 61 Snowden Ave | 0.46mi | 3/1.0 (+1) | 1,516 (+10%) | 5mo | $515,000 | $340 | 53 |
| 7 Tompkins Ave | 0.64mi | 2/1.5 | 1,376 (-0%) | 18mo | $488,800 | $355 | 52 |
| 4 Prospect Pl | 0.49mi | 3/1.5 (+1) | 1,368 (-1%) | 20mo | $495,000 | $362 | 52 |
| 17 Lafayette Ave | 0.54mi | 2/1.0 | 1,288 (-7%) | 20mo | $462,000 | $359 | 47 |
| 19 Madison Ave | 0.50mi | 2/2.0 | 1,504 (+9%) | 24mo | $550,000 | $366 | 38 |
| 47 Linden Ave | 0.74mi | 3/2.0 (+1) | 1,540 (+12%) | 16mo | $611,800 | $397 | 23 |
Match score weights: distance 35% · size 25% · config 20% · recency 20%. Top-matched comps best support the ARV.
Projected returns pro-forma
-3.0% appreciation · 3.0% rent growth · sell at horizon
- IRR
- 96.3%
- Equity multiple
- 5.49×
- Total profit
- $106,809
- Equity at exit
- $12,674
- IRR
- 99.0%
- Equity multiple
- 11.44×
- Total profit
- $248,409
- Equity at exit
- $7,349
Cash invested: $23,800 (down + closing). Projections, not guarantees.
Landlord ↔ Tenant lean methodology
- Overall (STATE)
- 15 Strongly Tenant-Friendly
- State New York
- 15 Strongly Tenant-Friendly · D+10
- County
- — inherits STATE
- City
- — inherits STATE
ZIP-level market 10562
- Active inventory
- 134
- Price-to-rent
- 2.3×
Monthly cashflow live
- Estimated rent
- $3,139 high interval (Pro) →
- Mortgage (P&I)
- −$446
- Tax est. 1.5%
- −$106 /mo · $1,275/yr
- Insurance
- −$35
- HOA
- −$0
- Vacancy / Maint / Mgmt
- −$659
- Net cashflow
- $1,893
Break-even live
UW: 25.0% down · 7.5% · 30yr · 1.5% tax · 5.0% vac · 8.0% maint · 8.0% mgmt
Financing live
Cash to close
- Down payment
- $21,250
- Closing costs
- $2,550
- Reserves months
- —
- Total cash needed
- —
Loan-product check · same deal, 3 products live
Conventional
25% down · 7.5% · 30yr
- Down + closing
- —
- Monthly P&I
- —
- Monthly cashflow
- —
- DSCR
- —
- Eligible?
- —
Personal DTI + credit; lowest rate.
DSCR
20% down · 8.5% · 30yr
- Down + closing
- —
- Monthly P&I
- —
- Monthly cashflow
- —
- DSCR
- —
- Eligible?
- —
No personal income docs; deal must DSCR.
Hard money
10% down · 12.0% · 12mo
- Down + closing
- —
- Monthly P&I
- —
- Monthly cashflow
- —
- DSCR
- —
- Eligible?
- —
Short-term bridge; refi at stabilization.
Rent comps 12 comps
| Address | Beds | Baths | Sqft | Rent | $/sqft | DOM | Units | Dist |
|---|---|---|---|---|---|---|---|---|
| 1 Harbor Sq Ossining, NY | 1.0–2.0 | 1.0–2.5 | 894 | $5,795 | $6.48 | 1d | 8 | 0.19mi |
| 5 Brandreth St Unit 2B Ossining, NY | 2.0 | 2.0 | 1000 | $3,000 | $3.00 | 44d | 1 | 0.26mi |
| 5 Brandreth St Unit 2A Ossining, NY | 3.0 | 2.0 | 1150 | $3,900 | $3.39 | 4d | 1 | 0.26mi |
| 76 State St Unit 10 Ossining, NY | 3.0 | 1.0 | 1100 | $2,750 | $2.50 | 44d | 1 | 0.31mi |
| 90 S Highland Ave Unit 6 Ossining, NY | 2.0 | 1.5 | 1092 | $3,500 | $3.21 | 5d | 1 | 0.44mi |
| 87 S Highland Ave Apt B27* Ossining, NY | 2.0 | 1.0 | 950 | $2,650 | $2.79 | 4d | 1 | 0.47mi |
| 85 S Highland Ave Ossining, NY | 2.0 | 1.0 | 950 | $2,300 | $2.42 | 44d | 1 | 0.55mi |
| 269 Spring St Unit 2nd Floor Ossining, NY | 1.0 | 1.0 | 900 | $2,500 | $2.78 | 10d | 1 | 0.67mi |
| 8 Davids Ln Ossining, NY | 1.0 | 1.5 | 1452 | $3,700 | $2.55 | 1d | 1 | 0.86mi |
| 217 N Highland Ave Ossining, NY | 1.0–3.0 | 1.0–2.0 | 1075 | $4,057 | $3.77 | 1d | 4 | 1.05mi |
| 48 Ferris Pl Ossining, NY | 3.0 | 1.0 | 1080 | $3,000 | $2.78 | 18d | 1 | 1.07mi |
| 42 Cedar Ln Ossining, NY | 1.0–2.0 | 1.0–1.5 | 975 | $2,995 | $3.07 | 1d | 1 | 1.15mi |
Listing history 14 events
-
2026-06-18days on market $85,000 Active 63 DOM
-
2026-06-17days on market $85,000 Active 62 DOM
-
2026-06-16days on market $85,000 Active 61 DOM
-
2026-06-15days on market $85,000 Active 60 DOM
-
2026-06-13days on market $85,000 Active 58 DOM
-
2026-06-09days on market $85,000 Active 54 DOM
-
2026-06-08days on market $85,000 Active 53 DOM
-
2026-06-07days on market $85,000 Active 52 DOM
-
2026-06-04days on market $85,000 Active 49 DOM
-
2026-06-03days on market $85,000 Active 48 DOM
-
2026-06-02days on market $85,000 Active 47 DOM
-
2026-06-01days on market $85,000 Active 46 DOM
-
2026-05-31days on market $85,000 Active 45 DOM
-
2026-03-18$85,000 Active 1196-char remark
Show marketing remark (1196 chars)
Welcome to 37 Secor Road. Being sold strictly as-is and as a buy one get one with 39 Secor Road; You cannot pass on this deal! Get this cozy 2-bedroom, 1-bathroom single family home replete with a garage, unfinished basement and unobstructed windows to the Hudson River. This home is priced to be sold as a package with the adjoining Two family home at 39 Secor Road (MLS # 973596 offered @ $675K). These two homes are on one deed with two separate tax lots, but they are adjoined with ONE furnace and one oil tank. The single-family home is being sold for CASH ONLY while a buyer can obtain financing for the two bedroom over one-bedroom multi-family home. This is an amazing opportunity for a first time or seasoned investor. Both units are being sold strictly AS-IS but boast two new roofs. The unfinished basement extends the length of both homes. Street parking for the multi-family home, but there is a municipal lot located behind the homes. 37/39 is a short distance to the Ossining training station and down-town Ossining alike. Both homes have access to basement that can be closed off by installing a door. Unfinished basements have windows and exterior access if a buyer would like.
ⓘ Source: listings_history table (triggers on properties + properties_extension) + one-shot
backfill from property_details.listing_events for pre-trigger history.
Climate risk First Street
- Flood 1/10 Low FEMA zone X (unshaded) · 0% chance over 30 yrs
- Wildfire 1/10 Low
- Heat 6/10 Major 7 d/yr ≥100°F today · 16 d/yr by 30 yrs out
- Wind 4/10 Moderate 23% chance of damaging wind over 30 yrs
- Air quality 3/10 Moderate 3 unhealthy d/yr today · 4 by 30 yrs out
Nearby sold comps map
Loading sold comps map…
Walkable amenities ~0.75 mi
Loading nearby amenities…
Taxation est. · year 1
- Rental income
- $37,670
- − Mortgage interest
- −$4,761
- − Property taxes
- −$1,275
- − Insurance
- −$425
- − Repairs & maintenance
- −$3,014
- − Management
- −$3,014
- − Depreciation
- −$2,473
- Taxable income
- $22,709
- Est. tax owed @ 24.0%
- −$5,450
- After-tax cash flow
- $17,260/yr
For passive investors: Depreciation is non-cash, so a rental often shows a tax loss while cash-flowing — sheltering income. Rental losses are passive: they offset passive income freely, and up to $25,000/yr can offset ordinary (W-2) income if you actively participate and your MAGI is under $100k (phasing out to $0 by $150k); unused losses carry forward. On sale, claimed depreciation is recaptured at up to 25%, and gains may owe capital-gains tax (a 1031 exchange can defer both). Figures are a year-1 estimate at your 24.0% rate — not tax advice; consult a CPA.
Schools (NCES district)
- District
- Ossining Union Free School District
- NCES district ID
- 3622020
- Math proficiency
- 72% ▲ 27.00%
- Reading proficiency
- 72% ▲ 25.00%
- Median HH income
- $78,402
- Composite
- 63.75/100
- National rank
- #599
- State rank
- #104 of 590 in NY
Livability — Ossining
- Score
- 80/100
- State rank
- #116
- US rank
- #1876
Category grades
Schools grade is shown separately in the Schools card above.
Census & demographics
- Census place
- Ossining, NY
- County
- Westchester County · 709,332 people
- City population
- 33,793
- Metro
- New York-Newark-Jersey City, NY-NJ-PA
- Population (ZIP)
- 33,793
- Household income
- $115,697
- Rent vs Own
- Severe rent burden
- 1248.0
Population outlook (Westchester County) Hauer SSP2
- Today (2025)
- 1,028,035 people
- By 2030
- 1,051,636 · +2.3%
- By 2040
- 1,098,520 · +6.9%
- By 2050
- 1,136,044 · +10.5%
- By 2075
- 1,196,925 · +16.4%
- By 2100
- 1,175,147 · +14.3%
Race, ethnicity, and origin ACS 2023
- Neighborhood character
- Diverse neighborhood (Simpson 0.63)
- Race & ethnicity
- White 47% Hispanic / Latino 37% Two or more races 11% Black 8% Asian 4%
- Hispanic origin (detail)
- Puerto Rican 6% Cuban 2% Dominican 3%
- Common ancestry
- Romanian 3% Scotch-Irish 3% Italian 2%
- Foreign-born
- 28% · Canada, Jamaica, China
- Languages at home
- 59% English-only · Spanish 31% Other Indo-European 4% Russian/Polish/Slavic 1%
Political lean MEDSL · Westchester
- 2024 margin
- Strong D (+26.3) · D 63.1% · R 36.9%
- 2008→2024 swing
- -1.3pp toward R · 2008: 27.6pp · 2024: 26.3pp
- All cycles
- 2024: D+26.3 2020: D+36.3 2016: D+32.8 2012: D+22.2 2008: D+27.6
Not yet ingested
- Civics
- —
Market trends
- HPI YoY
- ▼ -605.12%
- Current HPI
- 251.6831
- Rent YoY
- —
- Metro
- New York-Newark-Jersey City, NY-NJ-PA
- State GDP YoY
- ▲ 2.60%
- F500 in state
- 92
Industry mix (Fortune 500 HQ in NY)
| Industry | F500 HQs | Revenue |
|---|---|---|
| Financial Services | 10 | $950B |
|
||
| Consumer Goods | 9 | $162B |
|
||
| Insurance | 4 | $225B |
|
||
| Telecommunications | 2 | $144B |
|
||
| Pharmaceuticals | 2 | $112B |
|
||
| Media / Entertainment | 2 | $69B |
|
||
Price history
1 event — show timeline
- 2026-03-18 Listed $85,000 OneKey® MLS as Distributed by MLS Grid
Property tax history
+3.7%/yrLatest (2025): $8,232 · +3.1% YoY. Source: county tax records.
Cash-flow waterfall
monthlySold comps — $/sqft
last 12 mo · ≤1 miLoading sold comps…