409612 E 1115 Rd · Stidham, OK
Flood risk 1/10 · Minimal
- FEMA flood zone
- X (unshaded)
- Chance of flooding over 30 yrs
- 0.0%
- Est. flood insurance / yr
- $507 – $1,088
Fire risk 6/10 · Moderate
- Est. fire insurance / yr
- $2,463 – $4,575
Heat risk 6/10 · Moderate
- Hot days now (above 111°F)
- 7 days/yr
- Hot days in 30 yrs
- 19 days/yr
Wind risk 3/10 · Minor
- Chance of severe wind over 30 yrs
- 5.0%
Air-quality risk 2/10 · Minimal
- Unhealthy air days now
- 1 days/yr
- Unhealthy air days in 30 yrs
- 2 days/yr
Risk factors via First Street. Map © Google.
Why this score? — see what drove the B+ grade
The composite is a weighted blend of 9 inputs, each scored 0–100. Each bar is that input's sub-score; the figure is the points it added to the 100-point composite (weight × sub-score).
- Cash flow +30.0/30.0
- 1% rule +10.0/10.0
- DSCR +10.0/10.0
- Appreciation +10.0/10.0
- ARV discount +7.5/15.0
- Livability +3.1/5.0
- Rent growth +2.5/5.0
- Condition / age +2.5/5.0
- Schools +1.3/10.0
$69,500
🖨 Deal sheet (PDF) 📄 Offer letter ✓ Due diligence
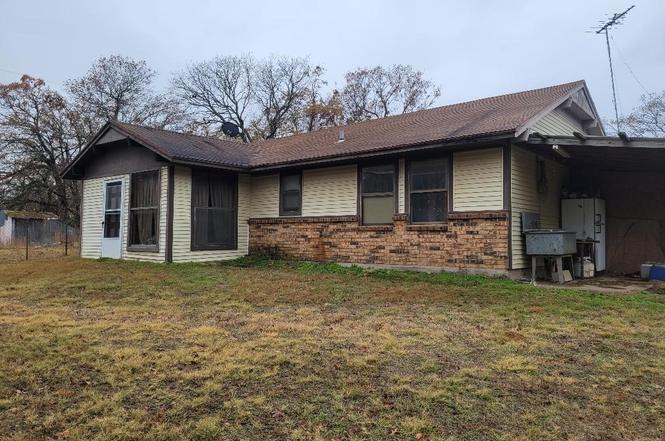
Listing remarks
3BD/1BA home near the river! Home needs some TLC but property offers 3 large lots, guesthouse and boat carport. The property has a carport, 3 water wells, (only 1 is usable at the time), and perimeter of property is completely fenced. Located close to Stidham schools and minutes to Eufaula.
Key facts
- Guesthouse
- Large lots
- Completely fenced
Tags
Property features AI
Exterior
- Parking: 4-car garage; Carport
- Security: Smoke detector(s)
- Utilities: Electricity available; Water available; Well water; Septic tank
- Home design: Single-story; Faces east; Slab foundation
- Construction: Built with brick veneer, vinyl siding, and wood frame; Asphalt/fiberglass roof
- Exterior features: Corner lot; Access to Canadian River; Chain link fencing; Smoke detector(s); No safety shelter
Interior
- Kitchen: Dishwasher; Microwave; Oven; Range; Stove; Refrigerator; Electric water heater
- Flooring: Carpet; Tile
- Bathrooms: 1 full bathroom
- Heating & cooling: Central heating (electric); Central air conditioning
- Interior features: Laminate counters; Ceiling fan(s); Electric oven connection; Electric range connection
- Laundry & utility: Electric dryer hookup
Neighborhood map
What this means for you Summary
Snapshot
- This is a 3-bed/1.0-bath single-family listed at $70k.
Deal economics
- At list price, monthly cash flow is $342 ($4k/yr) — positive.
- The deal already cash-flows at list — no discount required.
- Meets the 1% rule at list price ($1k rent vs $70k).
- Recommended offer: $61k (12.0% below list) — sets the bar for market timing.
Location & tenants
- Location reads 61/100 on livability (#307 in OK) — a middle-class / working-renter tenant base. Strengths: employment A+, cost of living A+, crime A; Watch: schools F, amenities F, commute F.
- Stidham (rural): math 11% / reading 11% proficiency, ranked #491 of 513 in OK (top 96%) — low school quality limits family demand, transient renter base, plan for 1-2y turnover; 68% free/reduced lunch — lower-income household profile, screen leases tightly.
- Market conditions: 403 active listings in the ZIP; 20 units permitted in McIntosh County in 2024 (0 in 5+ unit buildings).
Forward outlook
- In year one you build about $7k of equity ($481 loan paydown + $7k appreciation (10.0% local appreciation)).
- McIntosh County population projected at -17% by 2050 — secular population decline; favor cash flow + early exit over multi-decade hold.
- At projected returns (10.0% appreciation + 3.0% rent growth), your $19k cash investment doubles in ~2 years — after that, you're playing with house money.
- By year 5, paydown + projected appreciation supports a ~$35k cash-out refi (75% LTV) — recoverable capital for the next deal without selling this one.
Negotiation context
- It's been on market 258 days — a 12% lower offer ($61k) is reasonable based on typical stale-listing flexibility.
- 3 sale attempts since 2y ago; this cycle's ask has dropped $16k (18%) from the opening price — seller is motivated, your offer sets the floor, not the list.
Risks & watch-outs
- Climate carrying-cost: major wildfire risk; extreme-heat days projected 7→19/yr by 2055 (HVAC capex compounding) — expect insurance premiums to compound above CPI over the hold.
Questions for the listing agent
- It's been on market 258 days. Have you received any prior offers? Is the seller open to a 12% concession, seller financing, or rate buy-down credit?
- Why hasn't it sold? Are there any deal-killer items the seller is aware of (foundation, flood, title, zoning, code violations)?
- Is there a deadline driving the sale (1031 exchange, divorce, estate, relocation)? That informs how much negotiation room exists.
- Schools are F-rated, which usually means shorter tenancies and higher turnover. Who's the typical renter profile here, and what's been the actual vacancy rate?
- What's the average days-on-market for RENTAL listings here right now (not sales)? A rising rental-DOM trend means longer vacancies and softer asking-rent achievability than the comps imply.
- What's the recent tenant-quality profile in this submarket — average credit score on applications, eviction rate, late-payment / NSF rate, and stable-employment percentage? A property-management company in the area should have these aggregated.
- How much new for-sale + rental construction is in the pipeline within 1–3 miles? Heavy new supply typically softens prices + rents 12–24 months out; constrained supply supports both.
Investment metrics
- 1% rule
- 1.50% ✓
- Cap rate
- 12.21%
- Cash-on-cash
- 21.12%
- DSCR
- 1.94
- GRM
- 5.6
CMA / ARV
No comps found within radius.
Projected returns pro-forma
10.0% appreciation · 3.0% rent growth · sell at horizon
- IRR
- 40.1%
- Equity multiple
- 4.07×
- Total profit
- $59,677
- Equity at exit
- $62,611
- IRR
- 34.5%
- Equity multiple
- 9.15×
- Total profit
- $158,619
- Equity at exit
- $135,023
Cash invested: $19,460 (down + closing). Projections, not guarantees.
Landlord ↔ Tenant lean methodology
- Overall (STATE)
- 83 Strongly Landlord-Friendly
- State Oklahoma
- 83 Strongly Landlord-Friendly · R+20
- County
- — inherits STATE
- City
- — inherits STATE
ZIP-level market 74432
- Home prices YoY
- 27.2%
- Active inventory
- 403
- Price-to-rent
- 5.6×
Monthly cashflow live
- Estimated rent
- $1,041 medium interval (Pro) →
- Mortgage (P&I)
- −$364
- Tax est. 1.5%
- −$87 /mo · $1,042/yr
- Insurance
- −$29
- HOA
- −$0
- Vacancy / Maint / Mgmt
- −$219
- Net cashflow
- $342
Break-even live
Sensitivity live
| Price | -10% $390 | -5% $366 | +0% $342 | +5% $318 | +10% $294 |
|---|---|---|---|---|---|
| Rent | -10% $260 | -5% $301 | +0% $342 | +5% $384 | +10% $425 |
| Rate | -1.0pp $377 | -0.5pp $360 | base $342 | +0.5pp $324 | +1.0pp $306 |
UW: 25.0% down · 7.5% · 30yr · 1.5% tax · 5.0% vac · 8.0% maint · 8.0% mgmt
Financing live
Cash to close
- Down payment
- $17,375
- Closing costs
- $2,085
- Reserves months
- —
- Total cash needed
- —
Loan-product check · same deal, 3 products live
Conventional
25% down · 7.5% · 30yr
- Down + closing
- —
- Monthly P&I
- —
- Monthly cashflow
- —
- DSCR
- —
- Eligible?
- —
Personal DTI + credit; lowest rate.
DSCR
20% down · 8.5% · 30yr
- Down + closing
- —
- Monthly P&I
- —
- Monthly cashflow
- —
- DSCR
- —
- Eligible?
- —
No personal income docs; deal must DSCR.
Hard money
10% down · 12.0% · 12mo
- Down + closing
- —
- Monthly P&I
- —
- Monthly cashflow
- —
- DSCR
- —
- Eligible?
- —
Short-term bridge; refi at stabilization.
Listing history 10 events
-
2026-06-02status $69,500 Pending 258 DOM
-
2026-06-01days on market $69,500 Active 258 DOM
-
2026-05-31days on market $69,500 Active 257 DOM
-
2026-04-03price $69,500
-
2026-01-09status Active
-
2025-09-30status Pending
-
2025-09-03price $75,000
-
2025-06-06$85,000 Active
-
2025-06-06historical
-
2024-12-06$85,000 Active
ⓘ Source: listings_history table (triggers on properties + properties_extension) + one-shot
backfill from property_details.listing_events for pre-trigger history.
Climate risk First Street
- Flood 1/10 Low FEMA zone X (unshaded) · 0% chance over 30 yrs
- Wildfire 6/10 Major
- Heat 6/10 Major 7 d/yr ≥111°F today · 19 d/yr by 30 yrs out
- Wind 3/10 Moderate 5% chance of damaging wind over 30 yrs
- Air quality 2/10 Low 1 unhealthy d/yr today · 2 by 30 yrs out
Nearby sold comps map
Loading sold comps map…
Walkable amenities ~0.75 mi
Loading nearby amenities…
Taxation est. · year 1
- Rental income
- $12,497
- − Mortgage interest
- −$3,893
- − Property taxes
- −$1,042
- − Insurance
- −$348
- − Repairs & maintenance
- −$1,000
- − Management
- −$1,000
- − Depreciation
- −$2,022
- Taxable income
- $3,193
- Est. tax owed @ 24.0%
- −$766
- After-tax cash flow
- $3,343/yr
For passive investors: Depreciation is non-cash, so a rental often shows a tax loss while cash-flowing — sheltering income. Rental losses are passive: they offset passive income freely, and up to $25,000/yr can offset ordinary (W-2) income if you actively participate and your MAGI is under $100k (phasing out to $0 by $150k); unused losses carry forward. On sale, claimed depreciation is recaptured at up to 25%, and gains may owe capital-gains tax (a 1031 exchange can defer both). Figures are a year-1 estimate at your 24.0% rate — not tax advice; consult a CPA.
Schools (NCES district)
- District
- Stidham
- NCES district ID
- 4028620
- Math proficiency
- 11% ▼ -4.00%
- Reading proficiency
- 11% ▼ -4.00%
- Median HH income
- $39,022
- Composite
- 13.02/100
- National rank
- #14524
- State rank
- #491 of 513 in OK
Livability — Stidham
- Score
- 61/100
- State rank
- #307
- US rank
- #17878
Category grades
Schools grade is shown separately in the Schools card above.
Census & demographics
- Population (ZIP)
- 9,793
Population outlook (McIntosh County) Hauer SSP2
- Today (2025)
- 18,935 people
- By 2030
- 18,272 · -3.5%
- By 2040
- 16,905 · -10.7%
- By 2050
- 15,771 · -16.7%
- By 2075
- 14,097 · -25.6%
- By 2100
- 12,572 · -33.6%
Race, ethnicity, and origin ACS 2023
- Neighborhood character
- Predominantly White (77%)
- Race & ethnicity
- White 77% Native American 11% Two or more races 9% Black 2% Hispanic / Latino 1%
- Common ancestry
- Lithuanian 3% Slovak 2% Romanian 1%
- Foreign-born
- 0%
- Languages at home
- 99% English-only · Spanish 1%
Political lean MEDSL · McIntosh
- 2024 margin
- Solid R (+52.7) · D 22.9% · R 75.7% · Other 1.4%
- 2008→2024 swing
- -33.5pp toward R · 2008: -19.3pp · 2024: -52.7pp
- All cycles
- 2024: R+52.7 2020: R+49.7 2016: R+42.5 2012: R+23.8 2008: R+19.3
Not yet ingested
- Civics
- —
Market trends
- HPI YoY
- ▲ 59.21%
- Current HPI
- 276.5449
- Rent YoY
- —
- Metro
- —
- State GDP YoY
- ▲ 1.55%
- F500 in state
- 6
Industry mix (Fortune 500 HQ in OK)
| Industry | F500 HQs | Revenue |
|---|---|---|
| Energy | 3 | $48B |
|
||
Price history
-18.2% since first listed7 events — show timeline
- 2026-04-03 Price Changed $69,500 MLS Technology, Inc.
- 2026-01-09 Relisted — MLS Technology, Inc.
- 2025-09-30 Pending — MLS Technology, Inc.
- 2025-09-03 Price Changed $75,000 MLS Technology, Inc.
- 2025-06-06 Listing Removed — MLS Technology, Inc.
- 2025-06-06 Listed $85,000 MLS Technology, Inc.
- 2024-12-06 Listed $85,000 MLS Technology, Inc.
Cash-flow waterfall
monthlySold comps — $/sqft
last 12 mo · ≤1 miLoading sold comps…