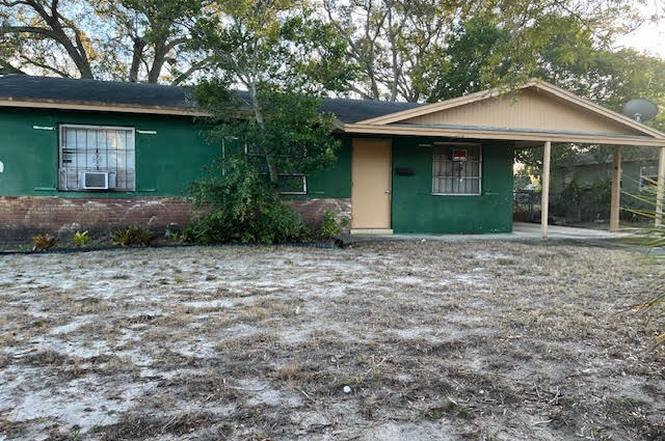
1605 N Patrick Cir · Daytona Beach, FL
Flood risk 1/10 · Minimal
- FEMA flood zone
- X (unshaded)
- Chance of flooding over 30 yrs
- 0.0%
- Est. flood insurance / yr
- $507 – $1,088
Fire risk 4/10 · Minor
- Est. fire insurance / yr
- $947 – $1,759
Heat risk 10/10 · Severe
- Hot days now (above 106°F)
- 7 days/yr
- Hot days in 30 yrs
- 20 days/yr
Wind risk 10/10 · Severe
- Chance of severe wind over 30 yrs
- 99.0%
Air-quality risk 2/10 · Minimal
- Unhealthy air days now
- 1 days/yr
- Unhealthy air days in 30 yrs
- 1 days/yr
Risk factors via First Street. Map © Google.
Why this score? — see what drove the C+ grade
The composite is a weighted blend of 9 inputs, each scored 0–100. Each bar is that input's sub-score; the figure is the points it added to the 100-point composite (weight × sub-score).
- Cash flow +25.5/30.0
- DSCR +8.4/10.0
- ARV discount +7.5/15.0
- 1% rule +7.1/10.0
- Livability +4.2/5.0
- Schools +3.9/10.0
- Rent growth +2.8/5.0
- Condition / age +2.5/5.0
- Appreciation +0.0/10.0
$130,000
🖨 Deal sheet 📄 Offer letter ✓ Due diligence
Listing remarks
Priced to sell FAST!!!! Block Investment property priced at tax value with alot of room for investors to make a profit home owners to make an equity purchase.
Key facts
- 9,583 sq ft lot
- Parking
- Built 1968
Neighborhood map
What this means for you Summary
Snapshot
- This is a 2-bed/1.0-bath single-family listed at $130k.
Deal economics
- At list price, monthly cash flow is $302 ($4k/yr) — positive.
- The deal already cash-flows at list — no discount required.
- Meets the 1% rule at list price ($2k rent vs $130k).
- Recommended offer: $114k (12.0% below list) — sets the bar for market timing.
Location & tenants
- Location reads 83/100 on livability (#46 in FL, #867 nationally) — a professional / high-income tenant draw. Strengths: amenities A+, commute A+, cost of living A+; Watch: schools D+, employment D-.
- Volusia (suburban): math 44% / reading 49% proficiency, ranked #47 of 73 in FL (top 64%) — families likely to look elsewhere, expect single-tenant / working-renter base with shorter leases.
- Market conditions: Rents rising (+1.0%/yr); 332 active listings in the ZIP; 34 comparable units currently listed for rent nearby; rentals at typical pace (median 15d on market — plan ~3-4 weeks tenant-placement turnaround); 3,402 units permitted in Volusia County in 2024 (681 in 5+ unit buildings).
- This rent runs 33% of the median local income ($56k/yr) — at the standard rent-burdened threshold; future hikes will face affordability resistance.
Forward outlook
- Local home prices are declining (-3.0%/yr); year-one equity from $899 of loan paydown is wiped out by about $4k of value loss. Plan a longer hold.
- Volusia County population projected at +19% by 2050 — long-run rental-demand tailwind backs the buy-and-hold thesis.
Negotiation context
- It's been on market 133 days — a 12% lower offer ($114k) is reasonable based on typical stale-listing flexibility.
Risks & watch-outs
- Climate carrying-cost: severe wind risk, 99% chance of damaging wind over 30y; extreme-heat days projected 7→20/yr by 2055 (HVAC capex compounding) — expect insurance premiums to compound above CPI over the hold.
Questions for the listing agent
- It's been on market 133 days. Have you received any prior offers? Is the seller open to a 12% concession, seller financing, or rate buy-down credit?
- Built in 1968 — when were the roof, HVAC, electrical panel, plumbing, and water heater last replaced?
- Why hasn't it sold? Are there any deal-killer items the seller is aware of (foundation, flood, title, zoning, code violations)?
- Is there a deadline driving the sale (1031 exchange, divorce, estate, relocation)? That informs how much negotiation room exists.
- Schools are D-rated, which usually means shorter tenancies and higher turnover. Who's the typical renter profile here, and what's been the actual vacancy rate?
- What's the average days-on-market for RENTAL listings here right now (not sales)? A rising rental-DOM trend means longer vacancies and softer asking-rent achievability than the comps imply.
- What's the recent tenant-quality profile in this submarket — average credit score on applications, eviction rate, late-payment / NSF rate, and stable-employment percentage? A property-management company in the area should have these aggregated.
- How much new for-sale + rental construction is in the pipeline within 1–3 miles? Heavy new supply typically softens prices + rents 12–24 months out; constrained supply supports both.
Investment metrics
- 1% rule
- 1.21% ✓
- Cap rate
- 9.08%
- Cash-on-cash
- 9.96%
- DSCR
- 1.44
- GRM
- 6.9
CMA / ARV
No comps found within radius.
Projected returns pro-forma
-3.0% appreciation · 1.01% rent growth · sell at horizon
- IRR
- -3.6%
- Equity multiple
- 0.87×
- Total profit
- $-4,849
- Equity at exit
- $19,383
- IRR
- 3.6%
- Equity multiple
- 1.24×
- Total profit
- $8,617
- Equity at exit
- $11,240
Cash invested: $36,400 (down + closing). Projections, not guarantees.
Landlord ↔ Tenant lean methodology
- Overall (STATE)
- 87 Strongly Landlord-Friendly
- State Florida
- 87 Strongly Landlord-Friendly · R+3
- County
- — inherits STATE
- City
- — inherits STATE
ZIP-level market 32117
- Home prices YoY
- -8.2%
- Rents YoY
- 1.0%
- Active inventory
- 332
- Price-to-rent
- 6.9×
Monthly cashflow live
- Estimated rent
- $1,568 high interval (Pro) →
- Mortgage (P&I)
- −$682
- Tax from tax record
- −$201 /mo · $2,406/yr
- Insurance
- −$54
- HOA
- −$0
- Vacancy / Maint / Mgmt
- −$329
- Net cashflow
- $302
Break-even live
UW: 25.0% down · 7.5% · 30yr · 1.5% tax · 5.0% vac · 8.0% maint · 8.0% mgmt
Financing live
Cash to close
- Down payment
- $32,500
- Closing costs
- $3,900
- Reserves months
- —
- Total cash needed
- —
Loan-product check · same deal, 3 products live
Conventional
25% down · 7.5% · 30yr
- Down + closing
- —
- Monthly P&I
- —
- Monthly cashflow
- —
- DSCR
- —
- Eligible?
- —
Personal DTI + credit; lowest rate.
DSCR
20% down · 8.5% · 30yr
- Down + closing
- —
- Monthly P&I
- —
- Monthly cashflow
- —
- DSCR
- —
- Eligible?
- —
No personal income docs; deal must DSCR.
Hard money
10% down · 12.0% · 12mo
- Down + closing
- —
- Monthly P&I
- —
- Monthly cashflow
- —
- DSCR
- —
- Eligible?
- —
Short-term bridge; refi at stabilization.
Rent comps 34 comps
| Address | Beds | Baths | Sqft | Rent | $/sqft | DOM | Units | Dist |
|---|---|---|---|---|---|---|---|---|
| 1012 Cadillac Dr Daytona Beach, FL | 3.0 | 2.0 | 1353 | $1,650 | $1.22 | 23d | 1 | 0.24mi |
| 1013 Lewis Dr Daytona Beach, FL | 3.0 | 1.5 | 1475 | $1,850 | $1.25 | 23d | 1 | 0.46mi |
| 922 Lewis Dr Daytona Beach, FL | 3.0 | 1.0 | 1034 | $1,750 | $1.69 | 23d | 1 | 0.47mi |
| 802 Lewis Dr Daytona Beach, FL | 3.0 | 1.0 | 1223 | $1,700 | $1.39 | 23d | 1 | 0.62mi |
| 875 Derbyshire Rd Daytona Beach, FL | 3.0 | 1.0–2.0 | 835 | $1,141 | $1.37 | 11d | 11 | 0.64mi |
| 1262 Essex Rd Daytona Beach, FL | 3.0 | 2.0 | 1500 | $1,900 | $1.27 | 23d | 1 | 0.65mi |
| 736 Kentucky St Unit 3 Daytona Beach, FL | 2.0 | 1.0 | 850 | $1,300 | $1.53 | 14d | 1 | 0.69mi |
| 704 Tennessee St Unit 1 Daytona Beach, FL | 2.0 | 1.0 | 1479 | $1,250 | $0.85 | 23d | 1 | 0.75mi |
| 736 White St Daytona Beach, FL | 3.0 | 2.0 | 1092 | $1,799 | $1.65 | 23d | 1 | 0.84mi |
| 1216 Kennedy Rd Unit 10 Daytona Beach, FL | 2.0 | 1.0 | 900 | $975 | $1.08 | 23d | 1 | 0.96mi |
| 1216 Kennedy Rd Unit 4 Daytona Beach, FL | 2.0 | 1.0 | 900 | $975 | $1.08 | 14d | 1 | 0.96mi |
| 1224 10th St Daytona Beach, FL | 3.0 | 1.0 | 1284 | $1,550 | $1.21 | 14d | 1 | 0.98mi |
| 1217 Kennedy Rd Unit 56 Daytona Beach, FL | 2.0 | 1.0 | 800 | $1,000 | $1.25 | 23d | 1 | 1.00mi |
| 1217 Kennedy Rd Unit 44 Daytona Beach, FL | 1.0 | 1.0 | 800 | $775 | $0.97 | 11d | 1 | 1.00mi |
| 1221 Kennedy Rd Unit 48 Daytona Beach, FL | 1.0 | 1.0 | 800 | $775 | $0.97 | 14d | 1 | 1.00mi |
| 1225 Kennedy Rd Daytona Beach, FL | 2.0 | 1.0 | 800 | $825 | $1.03 | 11d | 1 | 1.00mi |
| 1229 Kennedy Rd Daytona Beach, FL | 2.0 | 1.0 | 800 | $950 | $1.19 | 14d | 1 | 1.00mi |
| 1851 Lpga Blvd Daytona Beach, FL | 1.0–3.0 | 1.0–3.0 | 966 | $1,918 | $1.98 | 11d | 49 | 1.01mi |
| 101 Claysburg LN Holly Hill, FL | 1.0–3.0 | 1.0–2.0 | 1163 | $2,322 | $2.00 | 14d | 25 | 1.02mi |
| 100 Windflower LN Daytona Beach, FL | 1.0–3.0 | 1.0–2.0 | 1021 | $2,014 | $1.97 | 11d | 63 | 1.02mi |
| 1381 N Clyde Morris Blvd Daytona Beach, FL | 1.0–3.0 | 1.0–2.0 | 919 | $1,594 | $1.73 | 11d | 10 | 1.04mi |
| 1600 Lpga Blvd Daytona Beach, FL | 1.0–3.0 | 1.0–2.0 | 1045 | $2,065 | $1.98 | 11d | 21 | 1.10mi |
| 142 White Fawn Dr Daytona Beach, FL | 2.0 | 2.5 | 1140 | $1,495 | $1.31 | 23d | 1 | 1.14mi |
| 165 White Fawn Dr Unit BR2 Daytona Beach, FL | 2.0 | 2.5 | 1278 | $850 | $0.67 | 14d | 1 | 1.15mi |
| 165 White Fawn Dr Unit MB Daytona Beach, FL | 2.0 | 2.5 | 1278 | $895 | $0.70 | 14d | 1 | 1.15mi |
| 155 White Fawn Dr Daytona Beach, FL | 2.0 | 2.5 | 1278 | $1,600 | $1.25 | 23d | 1 | 1.16mi |
| 1500 Alexis AVE Daytona Beach, FL | 1.0–3.0 | 1.0–2.0 | 1003 | $1,807 | $1.80 | 11d | 32 | 1.17mi |
| 519 Colfax Dr Daytona Beach, FL | 3.0 | 1.5 | 1288 | $1,700 | $1.32 | 23d | 1 | 1.19mi |
| 450 Jimmy Ann Dr Daytona Beach, FL | 2.0 | 2.0 | 1170 | $1,632 | $1.39 | 19d | 5 | 1.23mi |
| 100 Alva Cir Daytona Beach, FL | 1.0–3.0 | 1.0–2.0 | 1140 | $1,900 | $1.67 | 11d | 12 | 1.29mi |
| 625 Holmes Ave Daytona Beach, FL | 2.0 | 1.0 | 768 | $995 | $1.30 | 21d | 1 | 1.39mi |
| 520 Zinfandel Dr Unit 1 Daytona Beach, FL | 3.0 | 2.5 | 1463 | $2,500 | $1.71 | 23d | 1 | 1.46mi |
| 1820 Legends Ln Daytona Beach, FL | 1.0–3.0 | 1.0–2.0 | 1076 | $1,905 | $1.77 | 11d | 73 | 1.48mi |
| 1610 N Clyde Morris Blvd Daytona Beach, FL | 1.0–3.0 | 1.0–2.0 | 1020 | $2,128 | $2.09 | 19d | 45 | 1.49mi |
Listing history 3 events
-
2025-05-16status Pending
-
2025-03-12price $130,000
-
2025-01-03$140,000 Active
ⓘ Source: listings_history table (triggers on properties + properties_extension) + one-shot
backfill from property_details.listing_events for pre-trigger history.
Tax reassessment forecast FL · Resets to sale price
- Current annual tax
- $2,406 · $201/mo
- Projected year-2 tax
- $2,406 · $201/mo
- Expected delta
- $0/yr ($0/mo · 0.0%)
ⓘ Screening estimate from a state-policy table — verify with the county assessor before closing.
Climate risk First Street
- Flood 1/10 Low FEMA zone X (unshaded) · 0% chance over 30 yrs
- Wildfire 4/10 Moderate
- Heat 10/10 Extreme 7 d/yr ≥106°F today · 20 d/yr by 30 yrs out
- Wind 10/10 Extreme 99% chance of damaging wind over 30 yrs
- Air quality 2/10 Low 1 unhealthy d/yr today · 1 by 30 yrs out
Nearby sold comps map
Loading sold comps map…
Walkable amenities ~0.75 mi
Loading nearby amenities…
Taxation est. · year 1
- Rental income
- $18,815
- − Mortgage interest
- −$7,282
- − Property taxes
- −$2,406
- − Insurance
- −$650
- − Repairs & maintenance
- −$1,505
- − Management
- −$1,505
- − Depreciation
- −$3,782
- Taxable income
- $1,684
- Est. tax owed @ 24.0%
- −$404
- After-tax cash flow
- $3,222/yr
For passive investors: Depreciation is non-cash, so a rental often shows a tax loss while cash-flowing — sheltering income. Rental losses are passive: they offset passive income freely, and up to $25,000/yr can offset ordinary (W-2) income if you actively participate and your MAGI is under $100k (phasing out to $0 by $150k); unused losses carry forward. On sale, claimed depreciation is recaptured at up to 25%, and gains may owe capital-gains tax (a 1031 exchange can defer both). Figures are a year-1 estimate at your 24.0% rate — not tax advice; consult a CPA.
Schools (NCES district)
- District
- Volusia
- NCES district ID
- 1201920
- Math proficiency
- 44% ▼ -9.00%
- Reading proficiency
- 49% ▼ -3.00%
- Median HH income
- $42,946
- Composite
- 39.2/100
- National rank
- #4019
- State rank
- #47 of 73 in FL
Livability — Daytona Beach
- Score
- 83/100
- State rank
- #46
- US rank
- #867
Category grades
Schools grade is shown separately in the Schools card above.
Census & demographics
- Census place
- Daytona Beach, FL
- County
- Volusia County · 556,871 people
- City population
- 67,539
- Metro
- Deltona-Daytona Beach-Ormond Beach, FL
- Population (ZIP)
- 30,955
- Household income
- $56,419
- Rent vs Own
- Severe rent burden
- 1781.0
Population outlook (Volusia County) Hauer SSP2
- Today (2025)
- 572,749 people
- By 2030
- 598,695 · +4.5%
- By 2040
- 644,880 · +12.6%
- By 2050
- 681,451 · +19.0%
- By 2075
- 759,957 · +32.7%
- By 2100
- 778,902 · +36.0%
Race, ethnicity, and origin ACS 2023
- Neighborhood character
- Diverse neighborhood (Simpson 0.63)
- Race & ethnicity
- White 53% Black 27% Hispanic / Latino 10% Two or more races 9% Asian 3%
- Hispanic origin (detail)
- Mexican 2% Puerto Rican 3%
- Common ancestry
- Romanian 2% Lithuanian 2% Slovak 1%
- Foreign-born
- 8% · Canada, Vietnam, Jamaica
- Languages at home
- 86% English-only · Spanish 8% Vietnamese 1% Other Indo-European 1%
Political lean MEDSL · Volusia
- 2024 margin
- Strong R (+21.8) · D 38.7% · R 60.5%
- 2008→2024 swing
- -27.4pp toward R · 2008: 5.7pp · 2024: -21.8pp
- All cycles
- 2024: R+21.8 2020: R+14.1 2016: R+13.1 2012: R+1.2 2008: D+5.7
Not yet ingested
- Civics
- —
Market trends
- HPI YoY
- ▼ -96.62%
- Current HPI
- 1084.54
- Rent YoY
- ▲ 1.01%
- Metro
- Deltona-Daytona Beach-Ormond Beach, FL
- State GDP YoY
- ▲ 3.28%
- F500 in state
- 36
Industry mix (Fortune 500 HQ in FL)
| Industry | F500 HQs | Revenue |
|---|---|---|
| Industrial Technology | 2 | $29B |
|
||
| Insurance | 2 | $17B |
|
||
| Retail | 1 | $60B |
|
||
| Technology Distribution | 1 | $58B |
|
||
| Homebuilding | 1 | $35B |
|
||
| Technology Manufacturing | 1 | $35B |
|
||
Price history
-7.1% since first listed3 events — show timeline
- 2025-05-16 Pending — realMLS
- 2025-03-12 Price Changed $130,000 realMLS
- 2025-01-03 Listed $140,000 realMLS
Property tax history
+19.4%/yrLatest (2025): $2,406 · -2.8% YoY. Source: county tax records.
Cash-flow waterfall
monthlySold comps — $/sqft
last 12 mo · ≤1 miLoading sold comps…