634 Robin Ct · Grayslake, IL
Flood risk 1/10 · Minimal
- FEMA flood zone
- X (unshaded)
- Chance of flooding over 30 yrs
- 0.0%
- Est. flood insurance / yr
- $473 – $860
Fire risk 2/10 · Minimal
- Est. fire insurance / yr
- $804 – $1,492
Heat risk 2/10 · Minimal
- Hot days now (above 100°F)
- 7 days/yr
- Hot days in 30 yrs
- 14 days/yr
Wind risk 2/10 · Minimal
- Chance of severe wind over 30 yrs
- —
Air-quality risk 3/10 · Minor
- Unhealthy air days now
- 3 days/yr
- Unhealthy air days in 30 yrs
- 3 days/yr
Risk factors via First Street. Map © Google.
Why this score? — see what drove the D+ grade
The composite is a weighted blend of 9 inputs, each scored 0–100. Each bar is that input's sub-score; the figure is the points it added to the 100-point composite (weight × sub-score).
- ARV discount +12.2/15.0
- Cash flow +11.1/30.0
- 1% rule +5.3/10.0
- Livability +4.5/5.0
- Rent growth +4.3/5.0
- Schools +3.9/10.0
- DSCR +3.2/10.0
- Condition / age +2.5/5.0
- Appreciation +0.0/10.0
$250,000
🖨 Deal sheet (PDF) 📄 Offer letter ✓ Due diligence
Listing remarks
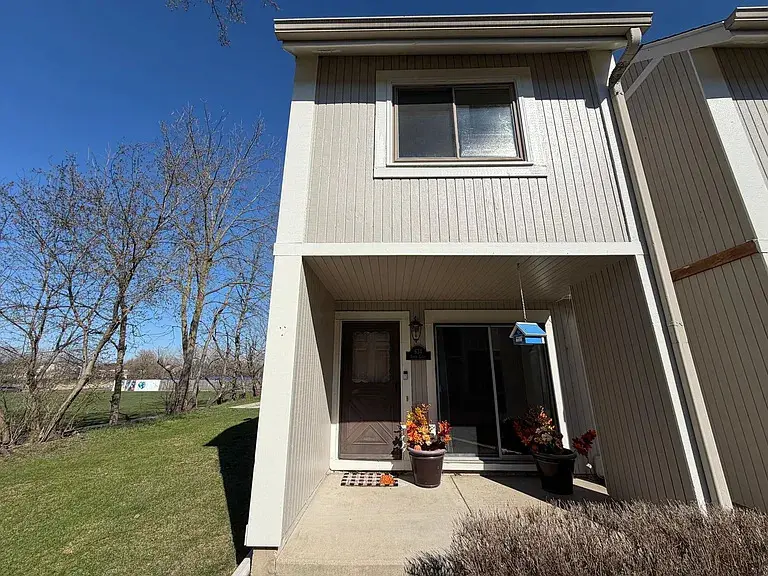
Welcome to this move-in ready townhome in the heart of Grayslake! This well-maintained 3-bedroom, 1.5-bath home offers the perfect blend of comfort and convenience. Enjoy a bright and functional layout with plenty of space for both everyday living and entertaining. Step outside to your private patio with porch-ideal for relaxing mornings or summer evenings. The home also features a full basement, providing extra storage or potential for recreational space, along with an in-unit washer and dryer for added convenience. Parking is a breeze with your own 1-car detached garage. The pet-friendly association makes this a great option for animal lovers, and residents can take advantage of the commu
Key facts
- Community pool
- Private patio
- Full basement
Tags
Property features AI
Finance
- Other: Part of a building with 4 units
- HOA & community: Monthly association fee of $325; Association covers pool, exterior maintenance, lawn care, and snow removal; Community amenities include park, party room, and pool; Pets allowed (cats and dogs)
Exterior
- Parking: Detached garage (garage owned) with garage door opener; 1 garage space, 1 total parking space
- Utilities: Public water; Public sewer
- Home design: Attached single, end-unit townhouse; Two-story layout; Entry level: 1; Fee simple ownership with homeowners association; Rehab completed 2026; Built approximately 51–60 years ago; Listed as built before 1978
- Construction: Cedar exterior; Rehab year 2026
- Exterior features: Deck; Fire pit
Interior
- Kitchen: Range; Microwave; Dishwasher; Refrigerator; Freezer; Countertops 34 inches or lower
- Bedrooms: Master bedroom on second level (16 x 12, carpet); Second bedroom on second level (12 x 16, wood laminate); Third bedroom on second level (9 x 13, wood laminate)
- Flooring: Wood laminate in main living areas and some bedrooms; Carpet in master bedroom; Other flooring in basement rooms
- Bathrooms: 1 full bathroom; 1 half bathroom
- Heating & cooling: Natural gas forced air heating; Central air conditioning
- Interior features: Partially finished full basement; Separate dining room; 7 total rooms; Ceiling fan(s); Sump pump with backup
- Laundry & utility: Laundry in basement (16 x 13); Washer and dryer; Gas dryer hookup
Neighborhood map
What this means for you Summary
Snapshot
- This is a 3-bed/1.5-bath townhouse listed at $250k.
Deal economics
- At list price, monthly cash flow is $-101 ($-1k/yr) — negative.
- To cash-flow at today's rent, offer at most $232k (7.2% below list).
- Meets the 1% rule at list price ($3k rent vs $250k).
- Recommended offer: $232k (7.2% below list) — sets the bar for cash-flow.
- Cap rate 5.8% vs local median 3.0% in Grayslake — top-decile yield for the area; either an underpriced asset or a hidden risk that comps aren't pricing in. Stress-test before assuming the spread holds.
Location & tenants
- Location reads 90/100 on livability (#4 in IL, #85 nationally) — a professional / high-income tenant draw. Strengths: crime A+, commute A+, employment A+.
- Grayslake Chsd 127 (suburban): math 40% / reading 44% proficiency, ranked #95 of 620 in IL (top 15%) — families likely to look elsewhere, expect single-tenant / working-renter base with shorter leases.
- Zoned schools: Woodview School (math 32% / reading 42%, grade F, #457 of 2,056 statewide, top 24%, 459 students, 0% FRL); Grayslake Middle School (math 29% / reading 32%, grade F, #241 of 665 statewide, top 37%, 661 students, 0% FRL); Grayslake Central High School (math 43% / reading 46%, grade F, #62 of 693 statewide, top 10%, 1,419 students, 0% FRL).
- Market conditions: Rents rising fast (+7.1%/yr); 92 active listings in the ZIP; 10 comparable units currently listed for rent nearby; rentals at typical pace (median 15d on market — plan ~3-4 weeks tenant-placement turnaround); solid renter incomes; 948 units permitted in Lake County in 2024 (424 in 5+ unit buildings).
Forward outlook
- Local home prices are declining (-3.0%/yr); year-one equity from $2k of loan paydown is wiped out by about $8k of value loss. Plan a longer hold.
- Lake County population projected to shrink 8% by 2050 — rents likely to lag national; underwrite the cash flow, not the appreciation.
Negotiation context
- It's been on market 47 days — a 3% lower offer ($242k) is reasonable based on typical stale-listing flexibility.
- 5 sale attempts since 2y ago with the ask held roughly flat each time — persistent listings suggest the price (not the market) is what's stuck; bring a comps-based counter.
- Current owner paid $132k; list at $250k implies a 89% gain — meaningful room to come down on a strong offer.
Questions for the listing agent
- What do current leases actually rent for vs. the listed asking? Can we see a recent rent roll and the last 12 months of T-12 income?
- It's been on market 47 days. Have you received any prior offers? Is the seller open to a 7% concession, seller financing, or rate buy-down credit?
- Built in 1973 — when were the roof, HVAC, electrical panel, plumbing, and water heater last replaced?
- What does the HOA fee cover, when was the last increase, and are there any pending special assessments or reserve-fund shortfalls?
- Is there a deadline driving the sale (1031 exchange, divorce, estate, relocation)? That informs how much negotiation room exists.
- Schools are B-rated — typically a magnet for longer-tenancy family renters. What's the average tenant stay here, and is there a school-zone premium baked into asking?
- The area grade is low — what's the realistic commute time and amenity access for the typical tenant pool here? Any planned neighborhood developments (good or bad) we should know about?
- What's the average days-on-market for RENTAL listings here right now (not sales)? A rising rental-DOM trend means longer vacancies and softer asking-rent achievability than the comps imply.
- What's the recent tenant-quality profile in this submarket — average credit score on applications, eviction rate, late-payment / NSF rate, and stable-employment percentage? A property-management company in the area should have these aggregated.
- How much new for-sale + rental construction is in the pipeline within 1–3 miles? Heavy new supply typically softens prices + rents 12–24 months out; constrained supply supports both.
Investment metrics
- 1% rule
- 1.03% ✓
- Cap rate
- 5.81%
- Cash-on-cash
- -1.74%
- DSCR
- 0.92
- GRM
- 8.1
CMA / ARV
- ARV (on-the-fly)
- $279,104
- Comps found
- 12
Show comp detail 12 sales within ~0.75 mi
| Address | Dist | Beds/Ba | Sqft | Sold | Price | $/sf | Match |
|---|---|---|---|---|---|---|---|
| 1165 Blackburn Dr | 0.61mi | 3/1.5 | 1,562 (-0%) | 1mo | $325,000 | $208 | 70 |
| 831 Amelia Ct | 0.40mi | 3/3.0 | 1,600 (+2%) | 2mo | $369,000 | $231 | 70 |
| 563 Quail Creek Dr | 0.10mi | 3/1.5 | 1,394 (-11%) | 8mo | $220,000 | $158 | 70 |
| 529 Pheasant Ct | 0.18mi | 3/2.0 | 1,395 (-11%) | 5mo | $249,000 | $178 | 67 |
| 707 Crossland Dr | 0.51mi | 3/1.5 | 1,608 (+3%) | 7mo | $310,000 | $193 | 66 |
| 1095 Ellsworth Dr | 0.57mi | 3/2.5 | 1,474 (-6%) | 3mo | $295,000 | $200 | 57 |
| 759 Cherry Creek Dr | 0.52mi | 3/2.5 | 1,708 (+9%) | 4mo | $285,000 | $167 | 54 |
| 1186 Blackburn Dr #1186 | 0.58mi | 3/1.5 | 1,750 (+12%) | 4mo | $305,000 | $174 | 50 |
| 1086 Manchester Cir | 0.67mi | 2/1.5 (-1) | 1,652 (+5%) | 7mo | $261,000 | $158 | 49 |
| 1109 Blackburn Dr | 0.64mi | 3/2.5 | 1,672 (+7%) | 8mo | $340,000 | $203 | 48 |
| 764 Cherry Creek Dr | 0.56mi | 2/2.5 (-1) | 1,748 (+12%) | 4mo | $295,000 | $169 | 42 |
| 924 Stratford Ct | 0.51mi | 2/1.5 (-1) | 1,357 (-14%) | 8mo | $220,500 | $162 | 42 |
Match score weights: distance 35% · size 25% · config 20% · recency 20%. Top-matched comps best support the ARV.
Projected returns pro-forma
-3.0% appreciation · 7.08% rent growth · sell at horizon
- IRR
- -13.5%
- Equity multiple
- 0.49×
- Total profit
- $-35,664
- Equity at exit
- $37,276
- IRR
- 1.8%
- Equity multiple
- 1.16×
- Total profit
- $10,984
- Equity at exit
- $21,615
Cash invested: $70,000 (down + closing). Projections, not guarantees.
Landlord ↔ Tenant lean methodology
- Overall (STATE)
- 43 Moderately Tenant-Leaning
- State Illinois
- 43 Moderately Tenant-Leaning · D+7
- County
- — inherits STATE
- City
- — inherits STATE
ZIP-level market 60030
- Rents YoY
- 7.1%
- Active inventory
- 92
- Price-to-rent
- 8.1×
Monthly cashflow live
- Estimated rent
- $2,578 high interval (Pro) →
- Mortgage (P&I)
- −$1,311
- Tax from tax record
- −$398 /mo · $4,772/yr
- Insurance
- −$104
- HOA
- −$325
- Vacancy / Maint / Mgmt
- −$541
- Net cashflow
- $-101
Break-even live
Sensitivity live
| Price | -10% $40 | -5% $-31 | +0% $-101 | +5% $-172 | +10% $-243 |
|---|---|---|---|---|---|
| Rent | -10% $-305 | -5% $-203 | +0% $-101 | +5% $0 | +10% $102 |
| Rate | -1.0pp $24 | -0.5pp $-38 | base $-101 | +0.5pp $-166 | +1.0pp $-232 |
UW: 25.0% down · 7.5% · 30yr · 1.5% tax · 5.0% vac · 8.0% maint · 8.0% mgmt
Financing live
Cash to close
- Down payment
- $62,500
- Closing costs
- $7,500
- Reserves months
- —
- Total cash needed
- —
Loan-product check · same deal, 3 products live
Conventional
25% down · 7.5% · 30yr
- Down + closing
- —
- Monthly P&I
- —
- Monthly cashflow
- —
- DSCR
- —
- Eligible?
- —
Personal DTI + credit; lowest rate.
DSCR
20% down · 8.5% · 30yr
- Down + closing
- —
- Monthly P&I
- —
- Monthly cashflow
- —
- DSCR
- —
- Eligible?
- —
No personal income docs; deal must DSCR.
Hard money
10% down · 12.0% · 12mo
- Down + closing
- —
- Monthly P&I
- —
- Monthly cashflow
- —
- DSCR
- —
- Eligible?
- —
Short-term bridge; refi at stabilization.
Rent comps 10 comps
| Address | Beds | Baths | Sqft | Rent | $/sqft | DOM | Units | Dist |
|---|---|---|---|---|---|---|---|---|
| 659 Ziegler Dr Grayslake, IL | 4.0 | 2.0 | 1850 | $2,625 | $1.42 | 20d | 1 | 0.12mi |
| 653 Ziegler Dr Unit 653 Grayslake, IL | 3.0 | 2.0 | 1852 | $2,300 | $1.24 | 26d | 1 | 0.14mi |
| 749 Dillon Ct Grayslake, IL | 2.0 | 2.5 | 1933 | $2,750 | $1.42 | 14d | 1 | 0.26mi |
| 959 Ellsworth Dr Grayslake, IL | 2.0 | 2.5 | 1588 | $2,499 | $1.57 | 14d | 1 | 0.40mi |
| 840 Amelia Ct Grayslake, IL | 3.0 | 3.5 | 1933 | $2,975 | $1.54 | 9d | 1 | 0.43mi |
| 1089 Ellsworth Dr Grayslake, IL | 3.0 | 2.5 | 1933 | $3,000 | $1.55 | 26d | 1 | 0.56mi |
| 62 Pine St Unit A Grayslake, IL | 3.0 | 2.0 | 1400 | $2,790 | $1.99 | 9d | 1 | 0.67mi |
| 1008 Manchester Cir Grayslake, IL | 2.0 | 2.5 | 1560 | $2,295 | $1.47 | 22d | 1 | 0.69mi |
| 1137 Mount Vernon Dr Grayslake, IL | 2.0 | 2.0 | 1290 | $2,200 | $1.71 | 0d | 1 | 1.34mi |
| 1456 Lancaster Ct Grayslake, IL | 3.0 | 2.5 | 1746 | $2,800 | $1.60 | 0d | 1 | 1.45mi |
HOA detail
- Monthly dues
- $325 · $3,900/yr
Listing history 31 events
-
2026-06-21days on market $250,000 Active 47 DOM
-
2026-06-18days on market $250,000 Active 44 DOM
-
2026-06-17days on market $250,000 Active 43 DOM
-
2026-06-16days on market $250,000 Active 42 DOM
-
2026-06-15days on market $250,000 Active 41 DOM
-
2026-06-13days on market $250,000 Active 39 DOM
-
2026-06-13days on market $250,000 Active 38 DOM
-
2026-06-09days on market $250,000 Active 35 DOM
-
2026-06-08days on market $250,000 Active 34 DOM
-
2026-06-07days on market $250,000 Active 33 DOM
-
2026-06-04days on market $250,000 Active 30 DOM
-
2026-06-03days on market $250,000 Active 29 DOM
-
2026-06-02days on market $250,000 Active 28 DOM
-
2026-06-01days on market $250,000 Active 27 DOM
-
2026-05-31days on market $250,000 Active 26 DOM
-
2026-05-20price $250,000
-
2026-05-05$255,000 Active
-
2026-04-24historical $2,400
-
2026-04-10$2,400
-
2025-11-12historical Contingent - No Showings
-
2025-11-11historical
-
2025-11-06Active
-
2024-08-18historical
-
2024-08-18status Temporarily No Showings
-
2024-07-12historical
-
2024-07-11Active
-
2003-12-17soldstatus $132,000
-
2000-05-22soldstatus $101,000
-
1997-06-23soldstatus $86,000
-
1987-11-01soldstatus $59,000
-
1985-07-01soldstatus $53,000
ⓘ Source: listings_history table (triggers on properties + properties_extension) + one-shot
backfill from property_details.listing_events for pre-trigger history.
Tax reassessment forecast IL · Partial reset (capped growth)
- Current annual tax
- $4,772 · $398/mo
- Projected year-2 tax
- $5,224 · $435/mo
- Expected delta
- +$451/yr (+$38/mo · 9.5%)
ⓘ Screening estimate from a state-policy table — verify with the county assessor before closing.
Climate risk First Street
- Flood 1/10 Low FEMA zone X (unshaded) · 0% chance over 30 yrs
- Wildfire 2/10 Low
- Heat 2/10 Low 7 d/yr ≥100°F today · 14 d/yr by 30 yrs out
- Wind 2/10 Low
- Air quality 3/10 Moderate 3 unhealthy d/yr today · 3 by 30 yrs out
Nearby sold comps map
Loading sold comps map…
Walkable amenities ~0.75 mi
Loading nearby amenities…
Taxation est. · year 1
- Rental income
- $30,933
- − Mortgage interest
- −$14,004
- − Property taxes
- −$4,772
- − Insurance
- −$1,250
- − Repairs & maintenance
- −$2,475
- − Management
- −$2,475
- − HOA
- −$3,900
- − Depreciation
- −$7,273
- Taxable loss
- −$5,215
- Est. tax savings @ 24.0%
- +$1,252
- After-tax cash flow
- $34/yr
For passive investors: Depreciation is non-cash, so a rental often shows a tax loss while cash-flowing — sheltering income. Rental losses are passive: they offset passive income freely, and up to $25,000/yr can offset ordinary (W-2) income if you actively participate and your MAGI is under $100k (phasing out to $0 by $150k); unused losses carry forward. On sale, claimed depreciation is recaptured at up to 25%, and gains may owe capital-gains tax (a 1031 exchange can defer both). Figures are a year-1 estimate at your 24.0% rate — not tax advice; consult a CPA.
Schools (NCES district)
- District
- Grayslake Chsd 127
- NCES district ID
- 1717550
- Math proficiency
- 40% ▼ -7.00%
- Reading proficiency
- 44% ▼ -9.00%
- Median HH income
- $84,295
- Composite
- 39.42/100
- National rank
- #3963
- State rank
- #95 of 620 in IL
Livability — Grayslake
- Score
- 90/100
- State rank
- #4
- US rank
- #85
Category grades
Schools grade is shown separately in the Schools card above.
Census & demographics
- Census place
- Grayslake, IL
- County
- Lake County · 591,991 people
- City population
- 35,792
- Metro
- Chicago-Naperville-Elgin, IL-IN-WI
- Population (ZIP)
- 35,792
- Household income
- $104,795
- Rent vs Own
- Severe rent burden
- 589.0
Population outlook (Lake County) Hauer SSP2
- Today (2025)
- 700,217 people
- By 2030
- 693,290 · -1.0%
- By 2040
- 673,588 · -3.8%
- By 2050
- 643,556 · -8.1%
- By 2075
- 562,792 · -19.6%
- By 2100
- 457,715 · -34.6%
Race, ethnicity, and origin ACS 2023
- Neighborhood character
- Predominantly White (74%)
- Race & ethnicity
- White 74% Hispanic / Latino 11% Two or more races 9% Black 7% Asian 4%
- Hispanic origin (detail)
- Mexican 7% Puerto Rican 2%
- Common ancestry
- Romanian 11% Portuguese 2% Lithuanian 2%
- Foreign-born
- 10% · Canada, China
- Languages at home
- 85% English-only · Spanish 7% Russian/Polish/Slavic 2% Other Indo-European 1%
Political lean MEDSL · Lake
- 2024 margin
- Strong D (+20.8) · D 59.7% · R 38.9% · Other 1.4%
- 2008→2024 swing
- +1.1pp toward D · 2008: 19.6pp · 2024: 20.8pp
- All cycles
- 2024: D+20.8 2020: D+24.1 2016: D+20.3 2012: D+8.1 2008: D+19.6
Not yet ingested
- Civics
- —
Market trends
- HPI YoY
- ▼ -118.09%
- Current HPI
- 200.6576
- Rent YoY
- ▲ 7.08%
- Metro
- Chicago-Naperville-Elgin, IL-IN-WI
- State GDP YoY
- ▲ 1.59%
- F500 in state
- 60
Industry mix (Fortune 500 HQ in IL)
| Industry | F500 HQs | Revenue |
|---|---|---|
| Insurance | 4 | $201B |
|
||
| Consumer Goods | 4 | $87B |
|
||
| Industrial Machinery | 3 | $64B |
|
||
| Healthcare | 2 | $55B |
|
||
| Retail / Pharmacy | 1 | $148B |
|
||
| Agriculture / Food | 1 | $86B |
|
||
Price history
+371.7% since first listed16 events — show timeline
- 2026-05-20 Price Changed $250,000 MRED as Distributed by MLS Grid
- 2026-05-05 Listed $255,000 MRED as Distributed by MLS Grid
- 2026-04-24 Rental Removed $2,400 APPFOLIO
- 2026-04-10 Listed for Rent $2,400 APPFOLIO
- 2025-11-12 Contingent — MRED as Distributed by MLS Grid
- 2025-11-11 Listing Removed — MRED as Distributed by MLS Grid
- 2025-11-06 Listed — MRED as Distributed by MLS Grid
- 2024-08-18 Listing Removed — MRED as Distributed by MLS Grid
- 2024-08-18 Relisted — MRED as Distributed by MLS Grid
- 2024-07-12 Listing Removed — MRED as Distributed by MLS Grid
- 2024-07-11 Listed — MRED as Distributed by MLS Grid
- 2003-12-17 Sold (Public Records) $132,000 Public Records
- 2000-05-22 Sold (Public Records) $101,000 Public Records
- 1997-06-23 Sold (Public Records) $86,000 Public Records
- 1987-11-01 Sold (Public Records) $59,000 Public Records
- 1985-07-01 Sold (Public Records) $53,000 Public Records
Property tax history
+1.8%/yrLatest (2024): $4,772 · +5.8% YoY. Source: county tax records.
Cash-flow waterfall
monthlySold comps — $/sqft
last 12 mo · ≤1 miLoading sold comps…