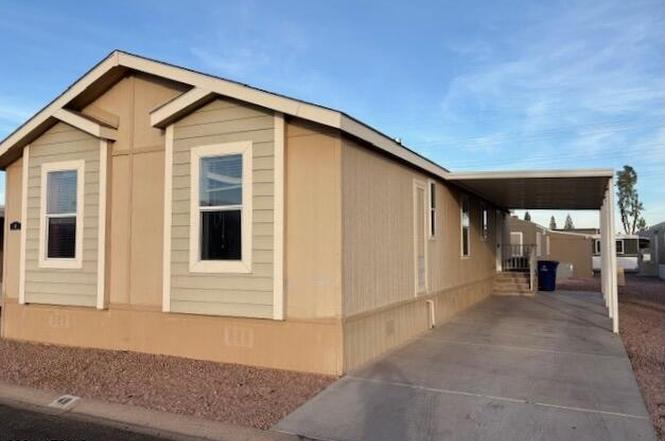
400 W Baseline Rd #48 · Tempe, AZ
Flood risk 1/10 · Minimal
- FEMA flood zone
- X (shaded)
- Chance of flooding over 30 yrs
- 0.0%
- Est. flood insurance / yr
- $507 – $1,088
Fire risk 1/10 · Minimal
- Est. fire insurance / yr
- $610 – $1,132
Heat risk 9/10 · Severe
- Hot days now (above 111°F)
- 6 days/yr
- Hot days in 30 yrs
- 17 days/yr
Wind risk 1/10 · Minimal
- Chance of severe wind over 30 yrs
- —
Air-quality risk 2/10 · Minimal
- Unhealthy air days now
- 1 days/yr
- Unhealthy air days in 30 yrs
- 1 days/yr
Risk factors via First Street. Map © Google.
Why this score? — see what drove the B- grade
The composite is a weighted blend of 9 inputs, each scored 0–100. Each bar is that input's sub-score; the figure is the points it added to the 100-point composite (weight × sub-score).
- Cash flow +30.0/30.0
- 1% rule +10.0/10.0
- DSCR +10.0/10.0
- ARV discount +7.5/15.0
- Livability +3.9/5.0
- Condition / age +2.5/5.0
- Rent growth +2.0/5.0
- Schools +2.0/10.0
- Appreciation +0.0/10.0
$119,900
🖨 Deal sheet 📄 Offer letter ✓ Due diligence
Listing remarks
LENDER OWNED! Clean, modern 3-bedroom, 2-bath 2016 Cavco manufactured home in a desirable Tempe location. Features an open floor plan with vaulted ceilings. ALL AGES WELCOME! Community amenities galore, include a pool, spa, rec center and MORE! LEASED LAND COMMUNITY. Space rent is $809 per month.
Key facts
- Open floor plan
- Rec center
- Community amenities
Tags
Property features AI
Finance
- HOA & community: Land lease: $809 monthly; No association fees included; Community pool; Community spa; Tennis courts; Playground; Near bus stop
Exterior
- Parking: 1 covered parking space; 1 carport space
- Utilities: City water; Public sewer
- Home design: Manufactured/mobile home; Leasehold ownership; Asphalt road access
- Construction: Wood siding and wood frame construction; Painted exterior; Composition roof; Building area reported by owner
- Exterior features: Gravel/stone front yard; Gravel/stone backyard; Private maintained road
Interior
- Kitchen: Pantry; Granite counters; Breakfast bar; Garbage disposal
- Bedrooms: Up to 3 bedrooms
- Flooring: Carpet; Tile
- Bathrooms: 2 full bathrooms
- Heating & cooling: Electric heating; Central air; Ceiling fans
- Interior features: High-speed internet; Granite counters; Double vanity; Breakfast bar; No interior steps; Vaulted ceilings; Pantry; 3/4 bath in primary bedroom; Disposal
- Laundry & utility: Indoor laundry with washer/dryer hookups
Neighborhood map
What this means for you Summary
Snapshot
- This is a 3-bed/2.0-bath manufactured listed at $120k.
Deal economics
- At list price, monthly cash flow is $698 ($8k/yr) — positive.
- The deal already cash-flows at list — no discount required.
- Meets the 1% rule at list price ($2k rent vs $120k).
- Recommended offer: $113k (6.0% below list) — sets the bar for market timing.
- Cap rate 13.3% vs local median 3.4% in Tempe — top-decile yield for the area; either an underpriced asset or a hidden risk that comps aren't pricing in. Stress-test before assuming the spread holds.
Location & tenants
- Location reads 78/100 on livability (#10 in AZ, #2,527 nationally) — a middle-class / working-renter tenant base. Strengths: amenities A+, commute A+, housing A+; Watch: cost of living C-, health & safety D, crime F.
- Tempe School District (4258) (urban): math 17% / reading 29% proficiency, ranked #170 of 249 in AZ (top 68%) — low school quality limits family demand, transient renter base, plan for 1-2y turnover.
- Zoned schools: Aguilar School (math 6% / reading 17%, grade F, #971 of 1,109 statewide, top 88%, 401 students, 64% FRL); Fees College Preparatory Middle School (math 10% / reading 18%, grade F, #164 of 218 statewide, top 76%, 789 students, 64% FRL).
- Market conditions: Rents soft (-1.9%/yr); 141 active listings in the ZIP; 40 comparable units currently listed for rent nearby; rentals leasing fast (median 1d on market — plan ~1-2 weeks tenant-placement turnaround); solid renter incomes; 36,011 units permitted in Maricopa County in 2024 (12,801 in 5+ unit buildings).
Forward outlook
- Local home prices are declining (-3.0%/yr); year-one equity from $829 of loan paydown is wiped out by about $4k of value loss. Plan a longer hold.
- Maricopa County population projected at +38% by 2050 — long-run rental-demand tailwind backs the buy-and-hold thesis.
- At projected returns (-3.0% appreciation + 0.0% rent growth), your $34k cash investment doubles in ~6 years — after that, you're playing with house money.
Negotiation context
- It's been on market 76 days — a 6% lower offer ($113k) is reasonable based on typical stale-listing flexibility.
- 2 sale attempts with the ask held roughly flat each time — persistent listings suggest the price (not the market) is what's stuck; bring a comps-based counter.
Risks & watch-outs
- Climate carrying-cost: extreme-heat days projected 6→17/yr by 2055 (HVAC capex compounding) — expect insurance premiums to compound above CPI over the hold.
Questions for the listing agent
- It's been on market 76 days. Have you received any prior offers? Is the seller open to a 6% concession, seller financing, or rate buy-down credit?
- Why hasn't it sold? Are there any deal-killer items the seller is aware of (foundation, flood, title, zoning, code violations)?
- Is there a deadline driving the sale (1031 exchange, divorce, estate, relocation)? That informs how much negotiation room exists.
- Crime grade is F in this area — have there been break-ins, vandalism, or insurance claims at this property in the last 3 years? What carrier currently insures it and at what premium?
- What's the average days-on-market for RENTAL listings here right now (not sales)? A rising rental-DOM trend means longer vacancies and softer asking-rent achievability than the comps imply.
- What's the recent tenant-quality profile in this submarket — average credit score on applications, eviction rate, late-payment / NSF rate, and stable-employment percentage? A property-management company in the area should have these aggregated.
- How much new for-sale + rental construction is in the pipeline within 1–3 miles? Heavy new supply typically softens prices + rents 12–24 months out; constrained supply supports both.
Investment metrics
- 1% rule
- 1.61% ✓
- Cap rate
- 13.27%
- Cash-on-cash
- 24.93%
- DSCR
- 2.11
- GRM
- 5.2
CMA / ARV
- ARV (on-the-fly)
- $74,880
- Comps found
- 7
Show comp detail 7 sales within ~0.75 mi
| Address | Dist | Beds/Ba | Sqft | Sold | Price | $/sf | Match |
|---|---|---|---|---|---|---|---|
| 400 W Baseline Rd #77 | 0.08mi | 3/2.0 | 1,259 (+1%) | 13mo | $95,000 | $75 | 84 |
| 400 W Baseline Rd #281 | 0.00mi | 4/2.0 (+1) | 1,320 (+6%) | 3mo | $129,900 | $98 | 83 |
| 400 W Baseline Rd #251 | 0.03mi | 3/2.0 | 1,152 (-8%) | 10mo | $52,000 | $45 | 78 |
| 400 W Baseline Rd #72 | 0.08mi | 3/2.0 | 1,200 (-4%) | 17mo | $70,000 | $58 | 76 |
| 400 W Baseline Rd #215 | 0.08mi | 4/2.0 (+1) | 1,320 (+6%) | 11mo | $138,000 | $105 | 73 |
| 400 W Baseline Rd #308 | 0.08mi | 2/2.0 (-1) | 1,152 (-8%) | 14mo | $69,000 | $60 | 67 |
| 400 W Baseline Rd #24 | 0.08mi | 3/1.0 | 1,100 (-12%) | 12mo | $55,000 | $50 | 63 |
Match score weights: distance 35% · size 25% · config 20% · recency 20%. Top-matched comps best support the ARV.
Projected returns pro-forma
-3.0% appreciation · 0.0% rent growth · sell at horizon
- IRR
- 14.9%
- Equity multiple
- 1.58×
- Total profit
- $19,364
- Equity at exit
- $17,877
- IRR
- 21.3%
- Equity multiple
- 2.56×
- Total profit
- $52,306
- Equity at exit
- $10,367
Cash invested: $33,572 (down + closing). Projections, not guarantees.
Landlord ↔ Tenant lean methodology
- Overall (STATE)
- 87 Strongly Landlord-Friendly
- State Arizona
- 87 Strongly Landlord-Friendly · R+3
- County
- — inherits STATE
- City
- — inherits STATE
ZIP-level market 85283
- Rents YoY
- -1.9%
- Active inventory
- 141
- Price-to-rent
- 5.2×
Monthly cashflow live
- Estimated rent
- $1,932 high interval (Pro) →
- Mortgage (P&I)
- −$629
- Tax est. 1.5%
- −$150 /mo · $1,798/yr
- Insurance
- −$50
- HOA
- −$0
- Vacancy / Maint / Mgmt
- −$406
- Net cashflow
- $698
Break-even live
UW: 25.0% down · 7.5% · 30yr · 1.5% tax · 5.0% vac · 8.0% maint · 8.0% mgmt
Financing live
Cash to close
- Down payment
- $29,975
- Closing costs
- $3,597
- Reserves months
- —
- Total cash needed
- —
Loan-product check · same deal, 3 products live
Conventional
25% down · 7.5% · 30yr
- Down + closing
- —
- Monthly P&I
- —
- Monthly cashflow
- —
- DSCR
- —
- Eligible?
- —
Personal DTI + credit; lowest rate.
DSCR
20% down · 8.5% · 30yr
- Down + closing
- —
- Monthly P&I
- —
- Monthly cashflow
- —
- DSCR
- —
- Eligible?
- —
No personal income docs; deal must DSCR.
Hard money
10% down · 12.0% · 12mo
- Down + closing
- —
- Monthly P&I
- —
- Monthly cashflow
- —
- DSCR
- —
- Eligible?
- —
Short-term bridge; refi at stabilization.
Rent comps 40 comps
| Address | Beds | Baths | Sqft | Rent | $/sqft | DOM | Units | Dist |
|---|---|---|---|---|---|---|---|---|
| 4505 S Hardy Dr Tempe, AZ | 1.0–2.0 | 1.0–2.5 | 840 | $1,799 | $2.14 | 1d | 19 | 0.34mi |
| 505 W Baseline Rd Tempe, AZ | 1.0–2.0 | 1.0–2.0 | 863 | $1,525 | $1.77 | 1d | 33 | 0.39mi |
| 30 W Carter Dr Tempe, AZ | 2.0 | 1.0–2.0 | 652 | $1,635 | $2.51 | 1d | 28 | 0.39mi |
| 15 E Carter Dr Tempe, AZ | 2.0 | 1.5 | 1119 | $1,695 | $1.51 | 22d | 1 | 0.41mi |
| 15 E Carter Dr Tempe, AZ | 2.0 | 1.5 | 1088 | $1,695 | $1.56 | 18d | 1 | 0.41mi |
| 5038 S Hardy Dr Tempe, AZ | 1.0–3.0 | 1.0–2.0 | 1082 | $1,959 | $1.81 | 1d | 21 | 0.43mi |
| 4130 S Mill Ave Tempe, AZ | 2.0 | 1.0–2.0 | 675 | $1,399 | $2.07 | 1d | 61 | 0.46mi |
| 517 W Duke Dr Tempe, AZ | 3.0 | 2.0 | 1426 | $2,150 | $1.51 | 1d | 1 | 0.47mi |
| 208 E Baseline Rd Tempe, AZ | 1.0–2.0 | 1.0–2.0 | 800 | $1,399 | $1.75 | 1d | 20 | 0.54mi |
| 530 W La Jolla Dr Tempe, AZ | 2.0 | 1.0 | 881 | $1,650 | $1.87 | 1d | 1 | 0.58mi |
| 528 W La Jolla Dr Tempe, AZ | 3.0 | 2.0 | 1374 | $2,399 | $1.75 | 10d | 1 | 0.59mi |
| 106 E Duke Dr Tempe, AZ | 3.0 | 2.0 | 1478 | $2,150 | $1.45 | 24d | 1 | 0.60mi |
| 422 W Pebble Beach Dr Unit 418 Tempe, AZ | 2.0 | 1.0 | 950 | $1,500 | $1.58 | 1d | 1 | 0.61mi |
| 418 W Pebble Beach Dr Tempe, AZ | 2.0 | 1.0 | 950 | $1,500 | $1.58 | 1d | 1 | 0.61mi |
| 3730 S Mill Ave Tempe, AZ | 2.0 | 1.0–2.0 | 628 | $1,487 | $2.37 | 1d | 28 | 0.62mi |
| 515 W Pebble Beach Dr Unit 513 Tempe, AZ | 4.0 | 2.0 | 1100 | $3,200 | $2.91 | 1d | 1 | 0.62mi |
| 515 W Pebble Beach Dr Unit 515 Tempe, AZ | 2.0 | 1.0 | 800 | $2,000 | $2.50 | 1d | 1 | 0.62mi |
| 951 W La Jolla Dr Tempe, AZ | 3.0 | 2.0 | 1383 | $3,500 | $2.53 | 1d | 1 | 0.63mi |
| 1222 W Baseline Rd #261 Tempe, AZ | 2.0 | 2.0 | 980 | $1,400 | $1.43 | 1d | 1 | 0.67mi |
| 1133 W Baseline Rd Tempe, AZ | 1.0–3.0 | 1.0–2.0 | 957 | $2,100 | $2.19 | 1d | 1 | 0.69mi |
| 633 W Southern Ave #1147 Tempe, AZ | 3.0 | 2.0 | 1000 | $1,550 | $1.55 | 10d | 1 | 0.69mi |
| 524 W Malibu Dr Unit 4 Tempe, AZ | 2.0 | 1.0 | 750 | $1,299 | $1.73 | 1d | 1 | 0.70mi |
| 743 W Fordham Dr Tempe, AZ | 2.0 | 1.0 | 988 | $1,695 | $1.72 | 16d | 1 | 0.71mi |
| 4839 S Darrow Dr Tempe, AZ | 1.0–2.0 | 1.0–2.0 | 712 | $1,695 | $2.38 | 1d | 12 | 0.74mi |
| 1145 W Baseline Rd Tempe, AZ | 2.0 | 1.0–2.0 | 825 | $1,425 | $1.73 | 1d | 10 | 0.75mi |
| 909 W Malibu Dr Tempe, AZ | 3.0 | 2.0 | 1092 | $1,850 | $1.69 | 1d | 1 | 0.75mi |
| 407 E Harvard Dr Tempe, AZ | 3.0 | 2.0 | 1267 | $2,299 | $1.81 | 24d | 1 | 0.79mi |
| 1311 W Baseline Rd Tempe, AZ | 1.0–2.0 | 1.0–2.0 | 695 | $1,519 | $2.19 | 1d | 25 | 0.83mi |
| 1118 W Tulane Dr Tempe, AZ | 3.0 | 2.0 | 1253 | $2,879 | $2.30 | 1d | 1 | 0.84mi |
| 577 E Baseline Rd Tempe, AZ | 1.0–2.0 | 1.0–2.0 | 1033 | $2,159 | $2.09 | 1d | 14 | 0.85mi |
| 515 E Dunbar Dr Apt 10 Tempe, AZ | 2.0 | 1.0 | 820 | $1,550 | $1.89 | 3d | 1 | 0.85mi |
| 515 E Dunbar Dr Tempe, AZ | 2.0 | 1.0 | 820 | $1,695 | $2.07 | 1d | 1 | 0.85mi |
| 5105 S La Rosa Dr Tempe, AZ | 2.0 | 1.0 | 819 | $1,495 | $1.83 | 1d | 1 | 0.90mi |
| 1210 W Tulane Dr Tempe, AZ | 3.0 | 1.0 | 910 | $2,100 | $2.31 | 1d | 1 | 0.93mi |
| 200 E Southern Ave Tempe, AZ | 1.0–2.0 | 1.0–2.0 | 782 | $1,600 | $2.05 | 1d | 4 | 0.96mi |
| 314 E Malibu Dr Tempe, AZ | 3.0 | 2.0 | 1408 | $2,000 | $1.42 | 12d | 1 | 0.97mi |
| 15 W Geneva Dr Tempe, AZ | 4.0 | 2.0 | 1260 | $2,748 | $2.18 | 1d | 1 | 0.97mi |
| 1222 W Auburn Dr Tempe, AZ | 2.0 | 1.0 | 1074 | $2,200 | $2.05 | 10d | 1 | 0.98mi |
| 1040 W Yale Dr Tempe, AZ | 2.0 | 1.0 | 910 | $1,575 | $1.73 | 1d | 1 | 0.98mi |
| 427 E Malibu Dr Tempe, AZ | 3.0 | 2.0 | 1274 | $1,895 | $1.49 | 1d | 1 | 1.01mi |
Listing history 3 events
-
2026-03-11$119,900 Active
-
2025-11-03historical
-
2025-06-13$120,000 Active
ⓘ Source: listings_history table (triggers on properties + properties_extension) + one-shot
backfill from property_details.listing_events for pre-trigger history.
Climate risk First Street
- Flood 1/10 Low FEMA zone X (shaded) · 0% chance over 30 yrs
- Wildfire 1/10 Low
- Heat 9/10 Extreme 6 d/yr ≥111°F today · 17 d/yr by 30 yrs out
- Wind 1/10 Low
- Air quality 2/10 Low 1 unhealthy d/yr today · 1 by 30 yrs out
Nearby sold comps map
Loading sold comps map…
Walkable amenities ~0.75 mi
Loading nearby amenities…
Taxation est. · year 1
- Rental income
- $23,182
- − Mortgage interest
- −$6,716
- − Property taxes
- −$1,798
- − Insurance
- −$600
- − Repairs & maintenance
- −$1,855
- − Management
- −$1,855
- − Depreciation
- −$3,488
- Taxable income
- $6,870
- Est. tax owed @ 24.0%
- −$1,649
- After-tax cash flow
- $6,721/yr
For passive investors: Depreciation is non-cash, so a rental often shows a tax loss while cash-flowing — sheltering income. Rental losses are passive: they offset passive income freely, and up to $25,000/yr can offset ordinary (W-2) income if you actively participate and your MAGI is under $100k (phasing out to $0 by $150k); unused losses carry forward. On sale, claimed depreciation is recaptured at up to 25%, and gains may owe capital-gains tax (a 1031 exchange can defer both). Figures are a year-1 estimate at your 24.0% rate — not tax advice; consult a CPA.
Schools (NCES district)
- District
- Tempe School District (4258)
- NCES district ID
- 0408310
- Math proficiency
- 17% ▼ -19.00%
- Reading proficiency
- 29% ▼ -10.00%
- Median HH income
- $43,112
- Composite
- 19.7/100
- National rank
- #8721
- State rank
- #170 of 249 in AZ
Livability — Tempe
- Score
- 78/100
- State rank
- #10
- US rank
- #2527
Category grades
Schools grade is shown separately in the Schools card above.
Census & demographics
- Census place
- Tempe, AZ
- County
- Maricopa County · 4,537,380 people
- City population
- 193,337
- Metro
- Phoenix-Mesa-Chandler, AZ
- Population (ZIP)
- 47,459
- Household income
- $84,568
- Rent vs Own
- Severe rent burden
- 2128.0
Population outlook (Maricopa County) Hauer SSP2
- Today (2025)
- 4,979,203 people
- By 2030
- 5,378,229 · +8.0%
- By 2040
- 6,156,598 · +23.6%
- By 2050
- 6,872,376 · +38.0%
- By 2075
- 8,401,270 · +68.7%
- By 2100
- 9,247,439 · +85.7%
Race, ethnicity, and origin ACS 2023
- Neighborhood character
- Diverse neighborhood (Simpson 0.69)
- Race & ethnicity
- White 46% Hispanic / Latino 30% Two or more races 15% Asian 8% Black 7% Native American 6%
- Hispanic origin (detail)
- Mexican 26%
- Common ancestry
- Portuguese 2% Romanian 2% Italian 2%
- Foreign-born
- 12% · Canada, China, Vietnam
- Languages at home
- 73% English-only · Spanish 17% Other Asian/Pacific 2% Other Indo-European 2%
Political lean MEDSL · Maricopa
- 2024 margin
- Toss-up / Even · D 47.7% · R 51.2% · Other 1.1%
- 2008→2024 swing
- +7.1pp toward D · 2008: -10.6pp · 2024: -3.5pp
- All cycles
- 2024: R+3.5 2020: D+2.2 2016: R+3.5 2012: R+12.0 2008: R+10.6
Not yet ingested
- Civics
- —
Market trends
- HPI YoY
- ▼ -390.57%
- Current HPI
- 328.638
- Rent YoY
- ▼ -1.95%
- Metro
- Phoenix-Mesa-Chandler, AZ
- State GDP YoY
- ▲ 4.54%
- F500 in state
- 20
Industry mix (Fortune 500 HQ in AZ)
| Industry | F500 HQs | Revenue |
|---|---|---|
| Technology | 2 | $13B |
|
||
| Mining / Metals | 1 | $23B |
|
||
| Environmental Services | 1 | $16B |
|
||
| Metals / Steel | 1 | $14B |
|
||
| Technology Distribution | 1 | $9B |
|
||
| Homebuilding | 1 | $8B |
|
||
Price history
-0.1% since first listed3 events — show timeline
- 2026-03-11 Listed $119,900 ARMLS
- 2025-11-03 Listing Removed — ARMLS
- 2025-06-13 Listed $120,000 ARMLS
Cash-flow waterfall
monthlySold comps — $/sqft
last 12 mo · ≤1 miLoading sold comps…