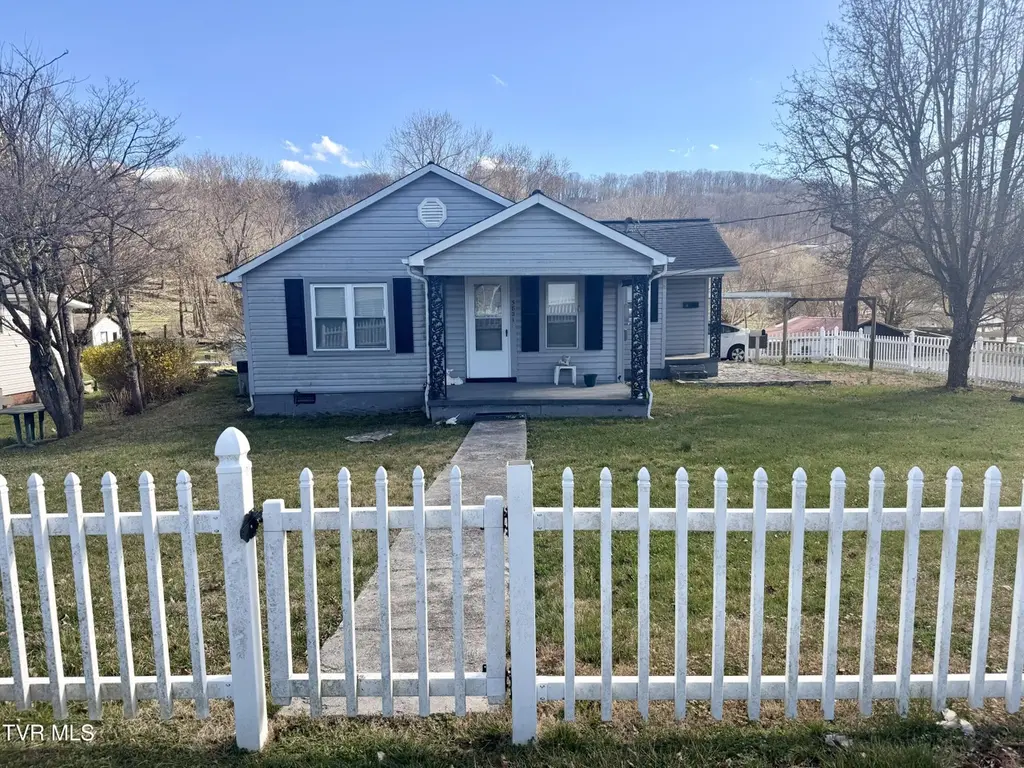
5821 Orebank Rd · Orebank, TN
Flood risk 1/10 · Minimal
- FEMA flood zone
- X (unshaded)
- Chance of flooding over 30 yrs
- 0.0%
- Est. flood insurance / yr
- $507 – $1,088
Fire risk 5/10 · Moderate
- Est. fire insurance / yr
- $949 – $1,763
Heat risk 4/10 · Minor
- Hot days now (above 98°F)
- 7 days/yr
- Hot days in 30 yrs
- 21 days/yr
Wind risk 2/10 · Minimal
- Chance of severe wind over 30 yrs
- —
Air-quality risk 2/10 · Minimal
- Unhealthy air days now
- 0 days/yr
- Unhealthy air days in 30 yrs
- 1 days/yr
Risk factors via First Street. Map © Google.
Why this score? — see what drove the C- grade
The composite is a weighted blend of 9 inputs, each scored 0–100. Each bar is that input's sub-score; the figure is the points it added to the 100-point composite (weight × sub-score).
- Cash flow +26.0/30.0
- DSCR +8.7/10.0
- 1% rule +5.7/10.0
- ARV discount +4.0/15.0
- Rent growth +3.4/5.0
- Livability +2.5/5.0
- Condition / age +2.5/5.0
- Schools +1.8/10.0
- Appreciation +0.0/10.0
$180,000
🖨 Deal sheet (PDF) 📄 Offer letter ✓ Due diligence
Listing remarks MLS
* Seller offering $5,000 toward concessions * Investor opportunity in Kingsport! This 4 bedroom, 1 bathroom home offers plenty of space and potential for the right buyer. Property needs some TLC and updates but could make a great investment, rental, or fixer-upper for someone looking to build equity. Convenient location close to shopping, dining, and local amenities. Home is being sold as-is. Don't miss this opportunity to bring this property back to life!
Key facts
- Close to dining
- Convenient location
- Local amenities
Tags
Neighborhood map
What this means for you Summary
Snapshot
- This is a 4-bed/4.0-bath single-family listed at $180k.
Deal economics
- At list price, monthly cash flow is $447 ($5k/yr) — positive.
- The deal already cash-flows at list — no discount required.
- Meets the 1% rule at list price ($2k rent vs $180k).
- Recommended offer: $164k (9.0% below list) — sets the bar for market timing.
Location & tenants
- Location reads: area grade C — affects rentability + tenant quality, not the cash-flow math above.
- Sullivan County (suburban): math 17% / reading 24% proficiency, ranked #109 of 139 in TN (top 78%) — low school quality limits family demand, transient renter base, plan for 1-2y turnover.
- Zoned schools: Ketron Elementary School (math 16% / reading 19%, grade F, #704 of 952 statewide, top 74%, 563 students, 0% FRL) — zoned schools average 0% FRL vs 45% district-wide (45 pts lower); this property's tenant base skews higher-income than the district average.
- Market conditions: Rents rising (+3.7%/yr); 267 active listings in the ZIP; 4 comparable units currently listed for rent nearby; rentals at typical pace (median 15d on market — plan ~3-4 weeks tenant-placement turnaround); 453 units permitted in Sullivan County in 2024 (6 in 5+ unit buildings).
- This rent runs 36% of the median local income ($64k/yr) — at the standard rent-burdened threshold; future hikes will face affordability resistance.
Forward outlook
- Local home prices are declining (-3.0%/yr); year-one equity from $1k of loan paydown is wiped out by about $5k of value loss. Plan a longer hold.
- Sullivan County population projected to shrink 5% by 2050 — rents likely to lag national; underwrite the cash flow, not the appreciation.
- At projected returns (-3.0% appreciation + 3.7% rent growth), your $50k cash investment doubles in ~10 years — after that, you're playing with house money.
Negotiation context
- It's been on market 105 days — a 9% lower offer ($164k) is reasonable based on typical stale-listing flexibility.
Risks & watch-outs
- Watch-outs: built in 1938 — expect roof / HVAC / electrical / plumbing capex.
- Climate carrying-cost: moderate wildfire risk — expect insurance premiums to compound above CPI over the hold.
Questions for the listing agent
- It's been on market 105 days. Have you received any prior offers? Is the seller open to a 9% concession, seller financing, or rate buy-down credit?
- Built in 1938 — when were the roof, HVAC, electrical panel, plumbing, and water heater last replaced?
- Why hasn't it sold? Are there any deal-killer items the seller is aware of (foundation, flood, title, zoning, code violations)?
- Is there a deadline driving the sale (1031 exchange, divorce, estate, relocation)? That informs how much negotiation room exists.
- What's the average days-on-market for RENTAL listings here right now (not sales)? A rising rental-DOM trend means longer vacancies and softer asking-rent achievability than the comps imply.
- What's the recent tenant-quality profile in this submarket — average credit score on applications, eviction rate, late-payment / NSF rate, and stable-employment percentage? A property-management company in the area should have these aggregated.
- How much new for-sale + rental construction is in the pipeline within 1–3 miles? Heavy new supply typically softens prices + rents 12–24 months out; constrained supply supports both.
Investment metrics
- 1% rule
- 1.07% ✓
- Cap rate
- 9.27%
- Cash-on-cash
- 10.64%
- DSCR
- 1.47
- GRM
- 7.8
CMA / ARV
- ARV (median comp)
- $166,865
- List price
- $180,000
- Delta
- 7.87%
- Verdict
- FAIR
- Comps
- 20 within 1.0 mi
Show comp detail 6 sales within ~0.75 mi
| Address | Dist | Beds/Ba | Sqft | Sold | Price | $/sf | Match |
|---|---|---|---|---|---|---|---|
| 212 Mcfarland Dr | 0.31mi | 3/1.0 (-1) | 1,152 (+1%) | 2mo | $178,000 | $155 | 66 |
| 317 Archcrest St | 0.17mi | 3/2.0 (-1) | 1,036 (-9%) | 5mo | $81,000 | $78 | 60 |
| 417 Archcrest St | 0.20mi | 3/1.5 (-1) | 1,225 (+8%) | 13mo | $214,000 | $175 | 52 |
| 429 Hooven St | 0.26mi | 3/1.0 (-1) | 1,224 (+7%) | 15mo | $175,250 | $143 | 46 |
| 5705 Concord St | 0.28mi | 3/1.0 (-1) | 986 (-14%) | 2mo | $160,000 | $162 | 45 |
| 312 Mcfarland Dr | 0.32mi | 3/2.0 (-1) | 1,280 (+12%) | 20mo | $182,000 | $142 | 35 |
Match score weights: distance 35% · size 25% · config 20% · recency 20%. Top-matched comps best support the ARV.
Projected returns pro-forma
-3.0% appreciation · 3.73% rent growth · sell at horizon
- IRR
- 0.3%
- Equity multiple
- 1.01×
- Total profit
- $652
- Equity at exit
- $26,839
- IRR
- 10.6%
- Equity multiple
- 1.85×
- Total profit
- $42,848
- Equity at exit
- $15,563
Cash invested: $50,400 (down + closing). Projections, not guarantees.
Landlord ↔ Tenant lean methodology
- Overall (STATE)
- 87 Strongly Landlord-Friendly
- State Tennessee
- 87 Strongly Landlord-Friendly · R+13
- County
- — inherits STATE
- City
- — inherits STATE
ZIP-level market 37664
- Home prices YoY
- -24.5%
- Rents YoY
- 3.7%
- Active inventory
- 267
- Price-to-rent
- 7.8×
Monthly cashflow live
- Estimated rent
- $1,923 medium interval (Pro) →
- Mortgage (P&I)
- −$944
- Tax from tax record
- −$53 /mo · $641/yr
- Insurance
- −$75
- HOA
- −$0
- Vacancy / Maint / Mgmt
- −$404
- Net cashflow
- $447
Break-even live
Sensitivity live
| Price | -10% $549 | -5% $498 | +0% $447 | +5% $396 | +10% $345 |
|---|---|---|---|---|---|
| Rent | -10% $295 | -5% $371 | +0% $447 | +5% $523 | +10% $599 |
| Rate | -1.0pp $538 | -0.5pp $493 | base $447 | +0.5pp $400 | +1.0pp $353 |
UW: 25.0% down · 7.5% · 30yr · 1.5% tax · 5.0% vac · 8.0% maint · 8.0% mgmt
Financing live
Cash to close
- Down payment
- $45,000
- Closing costs
- $5,400
- Reserves months
- —
- Total cash needed
- —
Loan-product check · same deal, 3 products live
Conventional
25% down · 7.5% · 30yr
- Down + closing
- —
- Monthly P&I
- —
- Monthly cashflow
- —
- DSCR
- —
- Eligible?
- —
Personal DTI + credit; lowest rate.
DSCR
20% down · 8.5% · 30yr
- Down + closing
- —
- Monthly P&I
- —
- Monthly cashflow
- —
- DSCR
- —
- Eligible?
- —
No personal income docs; deal must DSCR.
Hard money
10% down · 12.0% · 12mo
- Down + closing
- —
- Monthly P&I
- —
- Monthly cashflow
- —
- DSCR
- —
- Eligible?
- —
Short-term bridge; refi at stabilization.
Rent comps 4 comps
| Address | Beds | Baths | Sqft | Rent | $/sqft | DOM | Units | Dist |
|---|---|---|---|---|---|---|---|---|
| 209 McFarland Dr Kingsport, TN | 3.0 | 1.0 | 897 | $1,450 | $1.62 | 45d | 1 | 0.29mi |
| 131 Cooks Valley Rd Kingsport, TN | 3.0 | 1.0 | 1008 | $1,600 | $1.59 | 15d | 1 | 0.82mi |
| 5013 Emerald Dr Kingsport, TN | 3.0 | 2.0 | 1400 | $3,000 | $2.14 | 15d | 1 | 0.98mi |
| 893 New Beason Well Rd Kingsport, TN | 3.0 | 2.0 | 1139 | $1,188 | $1.04 | 15d | 3 | 1.49mi |
Listing history 18 events
-
2026-06-21days on market $180,000 Active 105 DOM
-
2026-06-19days on market $180,000 Active 103 DOM
-
2026-06-18days on market $180,000 Active 102 DOM
-
2026-06-17days on market $180,000 Active 101 DOM
-
2026-06-16days on market $180,000 Active 100 DOM
-
2026-06-15days on market $180,000 Active 99 DOM
-
2026-06-14days on market $180,000 Active 97 DOM
-
2026-06-13days on market $180,000 Active 96 DOM
-
2026-06-10days on market $180,000 Active 94 DOM
-
2026-06-09days on market $180,000 Active 93 DOM
-
2026-06-08days on market $180,000 Active 92 DOM
-
2026-06-07days on market $180,000 Active 91 DOM
-
2026-06-02days on market $180,000 Active 86 DOM
-
2026-06-01days on market $180,000 Active 85 DOM
-
2026-05-31days on market $180,000 Active 84 DOM
-
2026-05-30days on market $180,000 Active 83 DOM
-
2026-04-04price $180,000 465-char remark
Show marketing remark (465 chars)
* Seller offering $5,000 toward concessions * Investor opportunity in Kingsport! This 4 bedroom, 1 bathroom home offers plenty of space and potential for the right buyer. Property needs some TLC and updates but could make a great investment, rental, or fixer-upper for someone looking to build equity. Convenient location close to shopping, dining, and local amenities. Home is being sold as-is. Don't miss this opportunity to bring this property back to life!
-
2026-03-08$182,000 Active 465-char remark
Show marketing remark (465 chars)
* Seller offering $5,000 toward concessions * Investor opportunity in Kingsport! This 4 bedroom, 1 bathroom home offers plenty of space and potential for the right buyer. Property needs some TLC and updates but could make a great investment, rental, or fixer-upper for someone looking to build equity. Convenient location close to shopping, dining, and local amenities. Home is being sold as-is. Don't miss this opportunity to bring this property back to life!
ⓘ Source: listings_history table (triggers on properties + properties_extension) + one-shot
backfill from property_details.listing_events for pre-trigger history.
Tax reassessment forecast TN · Resets to sale price
- Current annual tax
- $641 · $53/mo
- Projected year-2 tax
- $1,278 · $106/mo
- Expected delta
- +$637/yr (+$53/mo · 99.4%)
ⓘ Screening estimate from a state-policy table — verify with the county assessor before closing.
Climate risk First Street
- Flood 1/10 Low FEMA zone X (unshaded) · 0% chance over 30 yrs
- Wildfire 5/10 Major
- Heat 4/10 Moderate 7 d/yr ≥98°F today · 21 d/yr by 30 yrs out
- Wind 2/10 Low
- Air quality 2/10 Low 0 unhealthy d/yr today · 1 by 30 yrs out
Nearby sold comps map
Loading sold comps map…
Walkable amenities ~0.75 mi
Loading nearby amenities…
Taxation est. · year 1
- Rental income
- $23,080
- − Mortgage interest
- −$10,083
- − Property taxes
- −$641
- − Insurance
- −$900
- − Repairs & maintenance
- −$1,846
- − Management
- −$1,846
- − Depreciation
- −$5,236
- Taxable income
- $2,527
- Est. tax owed @ 24.0%
- −$606
- After-tax cash flow
- $4,758/yr
For passive investors: Depreciation is non-cash, so a rental often shows a tax loss while cash-flowing — sheltering income. Rental losses are passive: they offset passive income freely, and up to $25,000/yr can offset ordinary (W-2) income if you actively participate and your MAGI is under $100k (phasing out to $0 by $150k); unused losses carry forward. On sale, claimed depreciation is recaptured at up to 25%, and gains may owe capital-gains tax (a 1031 exchange can defer both). Figures are a year-1 estimate at your 24.0% rate — not tax advice; consult a CPA.
Schools (NCES district)
- District
- Sullivan County
- NCES district ID
- 4703990
- Math proficiency
- 17% ▼ -15.00%
- Reading proficiency
- 24% ▼ -10.00%
- Median HH income
- $43,263
- Composite
- 17.66/100
- National rank
- #9030
- State rank
- #109 of 139 in TN
Livability — Orebank
No livability data for this city. (Only ~50 U.S. cities are tracked.)
Census & demographics
- Census place
- Orebank, TN
- County
- Sullivan County · 121,987 people
- Metro
- Kingsport-Bristol, TN-VA
- Population (ZIP)
- 28,267
- Household income
- $63,653
- Rent vs Own
- Severe rent burden
- 739.0
Population outlook (Sullivan County) Hauer SSP2
- Today (2025)
- 157,030 people
- By 2030
- 156,415 · -0.4%
- By 2040
- 153,778 · -2.1%
- By 2050
- 149,018 · -5.1%
- By 2075
- 138,068 · -12.1%
- By 2100
- 119,927 · -23.6%
Race, ethnicity, and origin ACS 2023
- Neighborhood character
- Predominantly White (94%)
- Race & ethnicity
- White 94% Two or more races 3% Hispanic / Latino 2% Black 1%
- Common ancestry
- Serbian 4% Slovak 3% Italian 1%
- Foreign-born
- 2% · Canada, China
- Languages at home
- 98% English-only · Spanish 1% Chinese 1%
Political lean MEDSL · Sullivan
- 2024 margin
- Solid R (+55.0) · D 22.0% · R 77.0% · Other 1.0%
- 2008→2024 swing
- -13.6pp toward R · 2008: -41.3pp · 2024: -55.0pp
- All cycles
- 2024: R+55.0 2020: R+51.9 2016: R+56.2 2012: R+47.2 2008: R+41.3
Not yet ingested
- Civics
- —
Market trends
- HPI YoY
- ▼ -85.12%
- Current HPI
- 261.7474
- Rent YoY
- ▲ 3.73%
- Metro
- Kingsport-Bristol, TN-VA
- State GDP YoY
- ▲ 2.78%
- F500 in state
- 22
Industry mix (Fortune 500 HQ in TN)
| Industry | F500 HQs | Revenue |
|---|---|---|
| Healthcare | 3 | $91B |
|
||
| Retail | 3 | $72B |
|
||
| Transportation / Logistics | 1 | $88B |
|
||
| Paper / Packaging | 1 | $19B |
|
||
| Insurance | 1 | $13B |
|
||
| Energy | 1 | $12B |
|
||
Price history
-1.1% since first listed2 events — show timeline
- 2026-04-04 Price Changed $180,000 TVRMLS
- 2026-03-08 Listed $182,000 TVRMLS
Property tax history
+6.0%/yrLatest (2025): $641 · +25.2% YoY. Source: county tax records.
Cash-flow waterfall
monthlySold comps — $/sqft
last 12 mo · ≤1 miLoading sold comps…