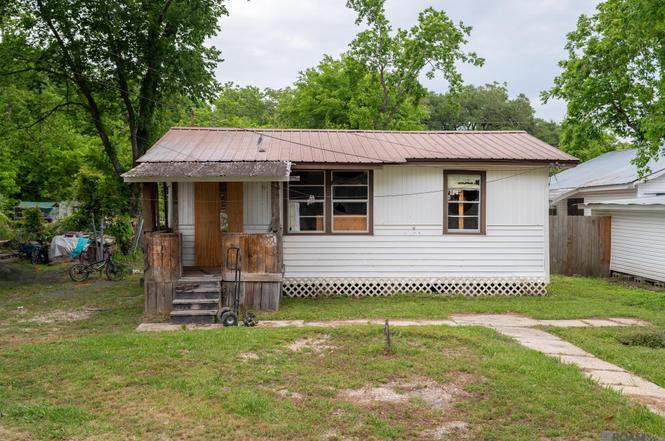
326 W Caroline St · Gonzales, LA
Flood risk 6/10 · Moderate
- FEMA flood zone
- AE
- Chance of flooding over 30 yrs
- 0.75%
- Est. flood insurance / yr
- $1,737 – $8,500
Fire risk 1/10 · Minimal
- Est. fire insurance / yr
- $1,269 – $2,357
Heat risk 8/10 · Major
- Hot days now (above 108°F)
- 7 days/yr
- Hot days in 30 yrs
- 21 days/yr
Wind risk 9/10 · Severe
- Chance of severe wind over 30 yrs
- 99.0%
Air-quality risk 2/10 · Minimal
- Unhealthy air days now
- 2 days/yr
- Unhealthy air days in 30 yrs
- 2 days/yr
Risk factors via First Street. Map © Google.
Why this score? — see what drove the B grade
The composite is a weighted blend of 9 inputs, each scored 0–100. Each bar is that input's sub-score; the figure is the points it added to the 100-point composite (weight × sub-score).
- Cash flow +30.0/30.0
- 1% rule +10.0/10.0
- DSCR +10.0/10.0
- ARV discount +7.5/15.0
- Schools +4.7/10.0
- Rent growth +3.3/5.0
- Livability +3.2/5.0
- Condition / age +2.5/5.0
- Appreciation +0.0/10.0
$30,000
🖨 Deal sheet (PDF) 📄 Offer letter ✓ Due diligence
Listing remarks
This is for the price of the land. The house needs to be raised 16-24" according to the town of Gonzalez. Property is conveniently located in an area that offers all middle of town accommodations.
Key facts
- 5,227 sq ft lot
- Built 1975
- Listed 6 days
Property features AI
Finance
- Other: Located in the Picard Addition subdivision; Directions: from I-10 Exit 179, go 3.4 miles North on Burnside (Hwy 44), Left at W New River St, Right on N Coolidge and Left on W Caroline. House on the right.
Exterior
- Parking: Open parking
- Utilities: Public water; Public sewer
- Home design: Detached single-family residence; Residential property
- Construction: Vinyl siding and frame construction; Pillar/post/pier foundation; Built on pier foundation
- Exterior features: Metal roof
Interior
- Bathrooms: 1 full bathroom
- Heating & cooling: Heating present (type: Other); Cooling present (type: Other)
- Interior features: Cooling and heating present (system type listed as 'Other')
Neighborhood map
What this means for you Summary
Snapshot
- This is a 1-bed/1.0-bath single-family listed at $30k.
Deal economics
- At list price, monthly cash flow is $263 ($3k/yr) — positive.
- The deal already cash-flows at list — no discount required.
- Meets the 1% rule at list price ($1k rent vs $30k).
- Cap rate 33.9% vs local median 4.5% in Gonzales — top-decile yield for the area; either an underpriced asset or a hidden risk that comps aren't pricing in. Stress-test before assuming the spread holds.
Location & tenants
- Location reads 65/100 on livability (#135 in LA) — a middle-class / working-renter tenant base. Strengths: cost of living A+, housing A+; Watch: employment D, crime F, amenities F.
- Ascension Parish (suburban): math 48% / reading 58% proficiency, ranked #7 of 98 in LA (top 7%) — acceptable for families but not a draw, mixed tenant base, ~2y average lease.
- Zoned schools: G. W. Carver Primary School (math 26% / reading 32%, grade F, #348 of 646 statewide, top 54%, 678 students, 65% FRL); Gonzales Middle School (math 18% / reading 33%, grade F, #139 of 218 statewide, top 64%, 781 students, 69% FRL); East Ascension High School (math 47% / reading 49%, grade D, #43 of 265 statewide, top 16%, 2,098 students, 55% FRL) — zoned schools average 63% FRL vs 44% district-wide (19 pts higher); higher-poverty schools than district average — tighter screening recommended.
- Zoned-school proficiency averages 34% at this address vs 53% district-wide (-19 pts) — the specific schools serving this property underperform the Ascension Parish average; the district grade overstates school quality for this exact location.
- Market conditions: Rents rising (+3.3%/yr); 571 active listings in the ZIP; 1 comparable units currently listed for rent nearby; solid renter incomes; 579 units permitted in Ascension Parish in 2024 (0 in 5+ unit buildings).
- This rent is only 17% of the median local income ($83k/yr) — well below the 30% rent-burden line; pricing power to push rent on renewal without tenant pushback.
Forward outlook
- Local home prices are declining (-3.0%/yr); year-one equity from $207 of loan paydown is wiped out by about $900 of value loss. Plan a longer hold.
- Ascension County population projected at +43% by 2050 — long-run rental-demand tailwind backs the buy-and-hold thesis.
- At projected returns (-3.0% appreciation + 3.3% rent growth), your $8k cash investment doubles in ~4 years — after that, you're playing with house money.
Negotiation context
- Only 6 days on market — expect competitive offers; lowballing is unlikely to land.
Risks & watch-outs
- Watch-outs: flood insurance adds $427/mo.
- Climate carrying-cost: in FEMA flood zone AE (mandatory federal flood insurance); severe wind risk, 99% chance of damaging wind over 30y; extreme-heat days projected 7→21/yr by 2055 (HVAC capex compounding) — expect insurance premiums to compound above CPI over the hold.
Questions for the listing agent
- Built in 1975 — when were the roof, HVAC, electrical panel, plumbing, and water heater last replaced?
- What's the actual annual flood-insurance premium (NFIP or private), and is the property in a SFHA with mandatory coverage?
- Is there a deadline driving the sale (1031 exchange, divorce, estate, relocation)? That informs how much negotiation room exists.
- Schools are B-rated — typically a magnet for longer-tenancy family renters. What's the average tenant stay here, and is there a school-zone premium baked into asking?
- Crime grade is F in this area — have there been break-ins, vandalism, or insurance claims at this property in the last 3 years? What carrier currently insures it and at what premium?
- What's the average days-on-market for RENTAL listings here right now (not sales)? A rising rental-DOM trend means longer vacancies and softer asking-rent achievability than the comps imply.
- What's the recent tenant-quality profile in this submarket — average credit score on applications, eviction rate, late-payment / NSF rate, and stable-employment percentage? A property-management company in the area should have these aggregated.
- How much new for-sale + rental construction is in the pipeline within 1–3 miles? Heavy new supply typically softens prices + rents 12–24 months out; constrained supply supports both.
Investment metrics
- 1% rule
- 3.79% ✓
- Cap rate
- 33.86%
- Cash-on-cash
- 98.45%
- DSCR
- 5.38
- GRM
- 2.2
CMA / ARV
No comps found within radius.
Projected returns pro-forma
-3.0% appreciation · 3.26% rent growth · sell at horizon
- IRR
- 34.6%
- Equity multiple
- 2.48×
- Total profit
- $12,443
- Equity at exit
- $4,473
- IRR
- 41.9%
- Equity multiple
- 5.14×
- Total profit
- $34,741
- Equity at exit
- $2,594
Cash invested: $8,400 (down + closing). Projections, not guarantees.
Landlord ↔ Tenant lean methodology
- Overall (STATE)
- 90 Strongly Landlord-Friendly
- State Louisiana
- 90 Strongly Landlord-Friendly · R+12
- County
- — inherits STATE
- City
- — inherits STATE
ZIP-level market 70737
- Rents YoY
- 3.3%
- Active inventory
- 571
- Price-to-rent
- 2.2×
Monthly cashflow live
- Estimated rent
- $1,137 medium interval (Pro) →
- Mortgage (P&I)
- −$157
- Tax from tax record
- −$39 /mo · $468/yr
- Insurance
- −$12
- Flood insurance flood zone
- −$427 /mo · $5,118/yr
- HOA
- −$0
- Vacancy / Maint / Mgmt
- −$239
- Net cashflow
- $263
Break-even live
Sensitivity live
| Price | -10% $280 | -5% $271 | +0% $263 | +5% $254 | +10% $246 |
|---|---|---|---|---|---|
| Rent | -10% $173 | -5% $218 | +0% $263 | +5% $308 | +10% $352 |
| Rate | -1.0pp $278 | -0.5pp $270 | base $263 | +0.5pp $255 | +1.0pp $247 |
UW: 25.0% down · 7.5% · 30yr · 1.5% tax · 5.0% vac · 8.0% maint · 8.0% mgmt
Financing live
Cash to close
- Down payment
- $7,500
- Closing costs
- $900
- Reserves months
- —
- Total cash needed
- —
Loan-product check · same deal, 3 products live
Conventional
25% down · 7.5% · 30yr
- Down + closing
- —
- Monthly P&I
- —
- Monthly cashflow
- —
- DSCR
- —
- Eligible?
- —
Personal DTI + credit; lowest rate.
DSCR
20% down · 8.5% · 30yr
- Down + closing
- —
- Monthly P&I
- —
- Monthly cashflow
- —
- DSCR
- —
- Eligible?
- —
No personal income docs; deal must DSCR.
Hard money
10% down · 12.0% · 12mo
- Down + closing
- —
- Monthly P&I
- —
- Monthly cashflow
- —
- DSCR
- —
- Eligible?
- —
Short-term bridge; refi at stabilization.
Rent comps 1 comps
| Address | Beds | Baths | Sqft | Rent | $/sqft | DOM | Units | Dist |
|---|---|---|---|---|---|---|---|---|
| 39503 LA-74 Unit 18 Gonzales, LA | 2.0 | 1.0 | 700 | $900 | $1.29 | 16d | 1 | 1.27mi |
Listing history 5 events
-
2026-06-21days on market $30,000 Active 6 DOM
-
2026-06-18days on market $30,000 Active 3 DOM
-
2026-06-17days on market $30,000 Active 2 DOM
-
2026-06-15remarks 196-char remark
-
2026-06-15$30,000 Active 1 DOM
ⓘ Source: listings_history table (triggers on properties + properties_extension) + one-shot
backfill from property_details.listing_events for pre-trigger history.
Tax reassessment forecast LA · Resets to sale price
- Current annual tax
- $468 · $39/mo
- Projected year-2 tax
- $468 · $39/mo
- Expected delta
- $0/yr ($0/mo · 0.0%)
ⓘ Screening estimate from a state-policy table — verify with the county assessor before closing.
Climate risk First Street
- Flood 6/10 Major FEMA zone AE · 75% chance over 30 yrs
- Wildfire 1/10 Low
- Heat 8/10 Severe 7 d/yr ≥108°F today · 21 d/yr by 30 yrs out
- Wind 9/10 Extreme 99% chance of damaging wind over 30 yrs
- Air quality 2/10 Low 2 unhealthy d/yr today · 2 by 30 yrs out
Nearby sold comps map
Loading sold comps map…
Walkable amenities ~0.75 mi
Loading nearby amenities…
Taxation est. · year 1
- Rental income
- $13,640
- − Mortgage interest
- −$1,680
- − Property taxes
- −$468
- − Insurance
- −$5,268
- − Repairs & maintenance
- −$1,091
- − Management
- −$1,091
- − Depreciation
- −$873
- Taxable income
- $3,168
- Est. tax owed @ 24.0%
- −$760
- After-tax cash flow
- $2,391/yr
For passive investors: Depreciation is non-cash, so a rental often shows a tax loss while cash-flowing — sheltering income. Rental losses are passive: they offset passive income freely, and up to $25,000/yr can offset ordinary (W-2) income if you actively participate and your MAGI is under $100k (phasing out to $0 by $150k); unused losses carry forward. On sale, claimed depreciation is recaptured at up to 25%, and gains may owe capital-gains tax (a 1031 exchange can defer both). Figures are a year-1 estimate at your 24.0% rate — not tax advice; consult a CPA.
Schools (NCES district)
- District
- Ascension Parish
- NCES district ID
- 2200090
- Math proficiency
- 48% ▼ -31.00%
- Reading proficiency
- 58% ▼ -25.00%
- Median HH income
- $68,423
- Composite
- 47.0/100
- National rank
- #2347
- State rank
- #7 of 98 in LA
Livability — Gonzales
- Score
- 65/100
- State rank
- #135
- US rank
- #12429
Category grades
Schools grade is shown separately in the Schools card above.
Census & demographics
- Census place
- Gonzales, LA
- County
- Ascension Parish · 98,362 people
- City population
- 49,084
- Metro
- Baton Rouge, LA
- Population (ZIP)
- 49,084
- Household income
- $82,521
- Rent vs Own
- Severe rent burden
- 863.0
Population outlook (Ascension County) Hauer SSP2
- Today (2025)
- 145,480 people
- By 2030
- 158,329 · +8.8%
- By 2040
- 183,741 · +26.3%
- By 2050
- 207,615 · +42.7%
- By 2075
- 260,244 · +78.9%
- By 2100
- 289,576 · +99.0%
Race, ethnicity, and origin ACS 2023
- Neighborhood character
- Diverse neighborhood (Simpson 0.57)
- Race & ethnicity
- White 59% Black 26% Hispanic / Latino 10% Two or more races 7%
- Hispanic origin (detail)
- Mexican 6%
- Common ancestry
- Lithuanian 15% Serbian 1% Slovak 1%
- Foreign-born
- 7% · Canada
- Languages at home
- 89% English-only · Spanish 9% French/Haitian/Cajun 1% Other Indo-European 1%
Political lean MEDSL · Ascension
- 2024 margin
- Solid R (+34.0) · D 32.2% · R 66.1% · Other 1.7%
- 2008→2024 swing
- +1.7pp toward D · 2008: -35.7pp · 2024: -34.0pp
- All cycles
- 2024: R+34.0 2020: R+32.5 2016: R+36.0 2012: R+34.3 2008: R+35.7
Not yet ingested
- Civics
- —
Market trends
- HPI YoY
- ▼ -89.49%
- Current HPI
- 145.3384
- Rent YoY
- ▲ 3.26%
- Metro
- Baton Rouge, LA
- State GDP YoY
- ▲ 3.29%
- F500 in state
- 10
Industry mix (Fortune 500 HQ in LA)
| Industry | F500 HQs | Revenue |
|---|---|---|
| Telecommunications | 2 | $23B |
|
||
| Utilities | 1 | $12B |
|
||
| Wholesale / Distribution | 1 | $5B |
|
||
| Advertising | 1 | $2B |
|
||
Price history
+50.0% since first listed3 events — show timeline
- 2026-05-24 Listed $30,000 GBRMLS
- 2009-12-08 Sold (Public Records) $30,000 Public Records
- 2004-06-25 Sold (Public Records) $20,000 Public Records
Property tax history
+13.3%/yrLatest (2025): $468 · +293.5% YoY. Source: county tax records.
Cash-flow waterfall
monthlySold comps — $/sqft
last 12 mo · ≤1 miLoading sold comps…