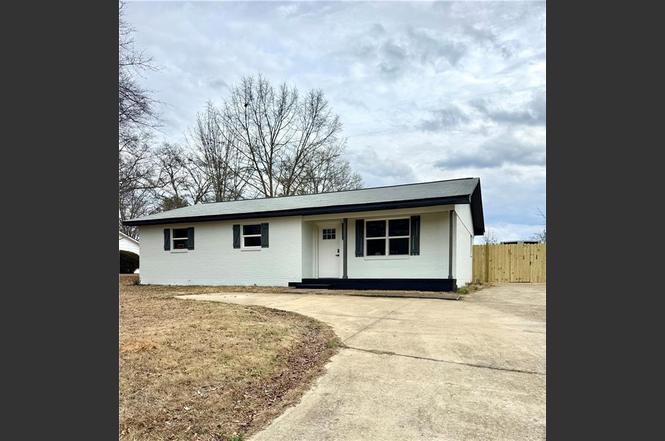
823 S 10th St · Lanett, AL
Flood risk 1/10 · Minimal
- FEMA flood zone
- X (unshaded)
- Chance of flooding over 30 yrs
- 0.0%
- Est. flood insurance / yr
- $507 – $1,088
Fire risk 3/10 · Minor
- Est. fire insurance / yr
- $916 – $1,700
Heat risk 6/10 · Moderate
- Hot days now (above 106°F)
- 7 days/yr
- Hot days in 30 yrs
- 20 days/yr
Wind risk 6/10 · Moderate
- Chance of severe wind over 30 yrs
- 65.0%
Air-quality risk 3/10 · Minor
- Unhealthy air days now
- 3 days/yr
- Unhealthy air days in 30 yrs
- 4 days/yr
Risk factors via First Street. Map © Google.
Why this score? — see what drove the D grade
The composite is a weighted blend of 9 inputs, each scored 0–100. Each bar is that input's sub-score; the figure is the points it added to the 100-point composite (weight × sub-score).
- Cash flow +16.8/30.0
- ARV discount +7.5/15.0
- DSCR +5.2/10.0
- 1% rule +3.4/10.0
- Livability +3.0/5.0
- Rent growth +2.5/5.0
- Condition / age +2.5/5.0
- Schools +0.9/10.0
- Appreciation +0.0/10.0
$159,900
🖨 Deal sheet 📄 Offer letter ✓ Due diligence
Listing remarks
A new chapter is beginning at 823 S 10th Street in Lanett, Alabama. For years, this home quietly served as a rental… but now the owner has completely refreshed it and it’s finally ready for someone new to call it their own. From the moment you pull up, you’ll notice the new privacy gate welcoming you in. Step inside and you’ll see a home that has been thoughtfully updated from top to bottom. The bathroom has been fully remodeled with beautiful tile, giving it a modern, clean feel. The kitchen now features new cabinetry and brand-new appliances, making it both functional and stylish. Throughout the home you’ll find durable luxury vinyl plank flooring, fresh pai
Key facts
- 1,307 sq ft lot
- Built 1967
- Listed 52 days
Property features AI
Finance
- Financial info: Annual tax recorded
- HOA & community: No community features listed
Exterior
- Parking: Driveway
- Utilities: Public water; Public sewer; Electricity available
- Home design: Single-family residence; One story
- Construction: Wood siding construction
- Exterior features: Deck; Patio; Fenced yard; Shingle roof; Has a view; Cleared lot; Concrete road access
Interior
- Kitchen: Dishwasher; Refrigerator
- Bedrooms: 3 bedrooms on the main level
- Flooring: Other flooring
- Bathrooms: 1 full bathroom (main level)
- Heating & cooling: Heat pump heating; Heat pump cooling
- Interior features: Other interior features; One fireplace
- Laundry & utility: Laundry features: Other
Neighborhood map
What this means for you Summary
Snapshot
- This is a 3-bed/1.0-bath single-family listed at $160k.
Deal economics
- At list price, monthly cash flow is $102 ($1k/yr) — positive.
- The deal already cash-flows at list — no discount required.
- To meet the 1% rule (rent ≥ 1% of price), the offer needs to be $135k (15.9% below list).
- Recommended offer: $135k (15.9% below list) — sets the bar for 1% rule.
- Cap rate 7.1% vs local median 5.8% in Lanett — meaningfully above typical; check what's discounted (condition, days-on-market, listing class) to confirm the premium yield is real.
Location & tenants
- Location reads 60/100 on livability (#301 in AL) — a middle-class / working-renter tenant base. Strengths: cost of living A+, housing A+; Watch: schools F, crime F, amenities F.
- Lanett City (town): math 5% / reading 19% proficiency, ranked #117 of 129 in AL (top 91%) — low school quality limits family demand, transient renter base, plan for 1-2y turnover; 87% free/reduced lunch — lower-income household profile, screen leases tightly.
- Market conditions: 95 active listings in the ZIP; 2 comparable units currently listed for rent nearby; 43 units permitted in Chambers County in 2024 (0 in 5+ unit buildings).
Forward outlook
- Local home prices are declining (-3.0%/yr); year-one equity from $1k of loan paydown is wiped out by about $5k of value loss. Plan a longer hold.
- Chambers County population projected to shrink 7% by 2050 — rents likely to lag national; underwrite the cash flow, not the appreciation.
Negotiation context
- It's been on market 52 days — a 3% lower offer ($155k) is reasonable based on typical stale-listing flexibility.
Risks & watch-outs
- Climate carrying-cost: major wind risk, 65% chance of damaging wind over 30y; extreme-heat days projected 7→20/yr by 2055 (HVAC capex compounding) — expect insurance premiums to compound above CPI over the hold.
Questions for the listing agent
- It's been on market 52 days. Have you received any prior offers? Is the seller open to a 16% concession, seller financing, or rate buy-down credit?
- Built in 1967 — when were the roof, HVAC, electrical panel, plumbing, and water heater last replaced?
- Is there a deadline driving the sale (1031 exchange, divorce, estate, relocation)? That informs how much negotiation room exists.
- Schools are F-rated, which usually means shorter tenancies and higher turnover. Who's the typical renter profile here, and what's been the actual vacancy rate?
- Crime grade is F in this area — have there been break-ins, vandalism, or insurance claims at this property in the last 3 years? What carrier currently insures it and at what premium?
- The area grade is low — what's the realistic commute time and amenity access for the typical tenant pool here? Any planned neighborhood developments (good or bad) we should know about?
- What's the average days-on-market for RENTAL listings here right now (not sales)? A rising rental-DOM trend means longer vacancies and softer asking-rent achievability than the comps imply.
- What's the recent tenant-quality profile in this submarket — average credit score on applications, eviction rate, late-payment / NSF rate, and stable-employment percentage? A property-management company in the area should have these aggregated.
- How much new for-sale + rental construction is in the pipeline within 1–3 miles? Heavy new supply typically softens prices + rents 12–24 months out; constrained supply supports both.
Investment metrics
- 1% rule
- 0.84% ✗
- Cap rate
- 7.06%
- Cash-on-cash
- 2.73%
- DSCR
- 1.12
- GRM
- 9.9
CMA / ARV
- ARV (on-the-fly)
- $83,226
- Comps found
- 12
Show comp detail 12 sales within ~0.75 mi
| Address | Dist | Beds/Ba | Sqft | Sold | Price | $/sf | Match |
|---|---|---|---|---|---|---|---|
| 902 S Jennings | 0.30mi | 2/1.0 (-1) | 1,204 (-4%) | 6mo | $21,000 | $17 | 68 |
| 609 S 11th Ave | 0.25mi | 2/1.0 (-1) | 1,352 (+7%) | 6mo | $50,000 | $37 | 66 |
| 911 South 8th St | 0.22mi | 2/2.0 (-1) | 1,344 (+7%) | 5mo | $42,500 | $32 | 65 |
| 318 S 16th Ave | 0.45mi | 3/1.0 | 1,292 (+2%) | 14mo | $166,000 | $128 | 63 |
| 1207 S 9th St | 0.08mi | 3/2.0 | 1,428 (+13%) | 9mo | $208,300 | $146 | 63 |
| 1412 S 7th St | 0.28mi | 3/1.0 | 1,144 (-9%) | 12mo | $32,000 | $28 | 62 |
| 307 S 11th St | 0.42mi | 2/1.0 (-1) | 1,216 (-4%) | 12mo | $31,000 | $25 | 60 |
| 1501 1st Street St | 0.57mi | 3/2.0 | 1,294 (+3%) | 7mo | $84,900 | $66 | 59 |
| 503 S 6th | 0.52mi | 3/1.0 | 1,168 (-7%) | 11mo | $70,000 | $60 | 54 |
| 106 S 14th Ave | 0.52mi | 3/1.0 | 1,218 (-3%) | 22mo | $102,000 | $84 | 52 |
| 106 N 14th Ave | 0.59mi | 3/2.0 | 1,350 (+7%) | 19mo | $214,000 | $159 | 41 |
| 305 South 17th Ave | 0.51mi | 4/1.0 (+1) | 1,404 (+11%) | 14mo | $176,500 | $126 | 41 |
Match score weights: distance 35% · size 25% · config 20% · recency 20%. Top-matched comps best support the ARV.
Projected returns pro-forma
-3.0% appreciation · 3.0% rent growth · sell at horizon
- IRR
- -12.0%
- Equity multiple
- 0.56×
- Total profit
- $-19,495
- Equity at exit
- $23,842
- IRR
- -3.0%
- Equity multiple
- 0.80×
- Total profit
- $-8,904
- Equity at exit
- $13,825
Cash invested: $44,772 (down + closing). Projections, not guarantees.
Landlord ↔ Tenant lean methodology
- Overall (STATE)
- 90 Strongly Landlord-Friendly
- State Alabama
- 90 Strongly Landlord-Friendly · R+15
- County
- — inherits STATE
- City
- — inherits STATE
ZIP-level market 36863
- Home prices YoY
- -29.1%
- Active inventory
- 95
- Price-to-rent
- 9.9×
Monthly cashflow live
- Estimated rent
- $1,345 medium interval (Pro) →
- Mortgage (P&I)
- −$839
- Tax from tax record
- −$56 /mo · $669/yr
- Insurance
- −$67
- HOA
- −$0
- Vacancy / Maint / Mgmt
- −$282
- Net cashflow
- $102
Break-even live
UW: 25.0% down · 7.5% · 30yr · 1.5% tax · 5.0% vac · 8.0% maint · 8.0% mgmt
Financing live
Cash to close
- Down payment
- $39,975
- Closing costs
- $4,797
- Reserves months
- —
- Total cash needed
- —
Loan-product check · same deal, 3 products live
Conventional
25% down · 7.5% · 30yr
- Down + closing
- —
- Monthly P&I
- —
- Monthly cashflow
- —
- DSCR
- —
- Eligible?
- —
Personal DTI + credit; lowest rate.
DSCR
20% down · 8.5% · 30yr
- Down + closing
- —
- Monthly P&I
- —
- Monthly cashflow
- —
- DSCR
- —
- Eligible?
- —
No personal income docs; deal must DSCR.
Hard money
10% down · 12.0% · 12mo
- Down + closing
- —
- Monthly P&I
- —
- Monthly cashflow
- —
- DSCR
- —
- Eligible?
- —
Short-term bridge; refi at stabilization.
Rent comps 2 comps
| Address | Beds | Baths | Sqft | Rent | $/sqft | DOM | Units | Dist |
|---|---|---|---|---|---|---|---|---|
| 808 S 10th St Lanett, AL | 3.0 | 2.0 | 1340 | $1,350 | $1.01 | 13d | 1 | 0.14mi |
| 1905 28th St Valley, AL | 3.0 | 1.0 | 1400 | $1,295 | $0.93 | 44d | 1 | 1.39mi |
Listing history 3 events
-
2026-04-26status Pending
-
2026-03-05$159,900 Active
-
2026-03-04historical $159,900
ⓘ Source: listings_history table (triggers on properties + properties_extension) + one-shot
backfill from property_details.listing_events for pre-trigger history.
Tax reassessment forecast AL · Resets to sale price
- Current annual tax
- $669 · $56/mo
- Projected year-2 tax
- $669 · $56/mo
- Expected delta
- $0/yr ($0/mo · 0.0%)
ⓘ Screening estimate from a state-policy table — verify with the county assessor before closing.
Climate risk First Street
- Flood 1/10 Low FEMA zone X (unshaded) · 0% chance over 30 yrs
- Wildfire 3/10 Moderate
- Heat 6/10 Major 7 d/yr ≥106°F today · 20 d/yr by 30 yrs out
- Wind 6/10 Major 65% chance of damaging wind over 30 yrs
- Air quality 3/10 Moderate 3 unhealthy d/yr today · 4 by 30 yrs out
Nearby sold comps map
Loading sold comps map…
Walkable amenities ~0.75 mi
Loading nearby amenities…
Taxation est. · year 1
- Rental income
- $16,142
- − Mortgage interest
- −$8,957
- − Property taxes
- −$669
- − Insurance
- −$800
- − Repairs & maintenance
- −$1,291
- − Management
- −$1,291
- − Depreciation
- −$4,652
- Taxable loss
- −$1,517
- Est. tax savings @ 24.0%
- +$364
- After-tax cash flow
- $1,586/yr
For passive investors: Depreciation is non-cash, so a rental often shows a tax loss while cash-flowing — sheltering income. Rental losses are passive: they offset passive income freely, and up to $25,000/yr can offset ordinary (W-2) income if you actively participate and your MAGI is under $100k (phasing out to $0 by $150k); unused losses carry forward. On sale, claimed depreciation is recaptured at up to 25%, and gains may owe capital-gains tax (a 1031 exchange can defer both). Figures are a year-1 estimate at your 24.0% rate — not tax advice; consult a CPA.
Schools (NCES district)
- District
- Lanett City
- NCES district ID
- 0101980
- Math proficiency
- 5% ▼ -19.00%
- Reading proficiency
- 19% ▼ -4.00%
- Median HH income
- $27,834
- Composite
- 9.11/100
- National rank
- #9866
- State rank
- #117 of 129 in AL
Livability — Lanett
- Score
- 60/100
- State rank
- #301
- US rank
- #19159
Category grades
Schools grade is shown separately in the Schools card above.
Census & demographics
- Census place
- Lanett, AL
- Population (ZIP)
- 12,335
Population outlook (Chambers County) Hauer SSP2
- Today (2025)
- 33,868 people
- By 2030
- 33,504 · -1.1%
- By 2040
- 32,594 · -3.8%
- By 2050
- 31,422 · -7.2%
- By 2075
- 29,054 · -14.2%
- By 2100
- 25,431 · -24.9%
Race, ethnicity, and origin ACS 2023
- Neighborhood character
- Diverse neighborhood (Simpson 0.58)
- Race & ethnicity
- White 46% Black 45% Hispanic / Latino 6% Two or more races 3%
- Hispanic origin (detail)
- Mexican 3%
- Common ancestry
- Serbian 1%
- Foreign-born
- 5% · Canada, South Korea
- Languages at home
- 95% English-only · Spanish 4% Other Indo-European 1%
Political lean MEDSL · Chambers
- 2024 margin
- Strong R (+23.2) · D 38.0% · R 61.2%
- 2008→2024 swing
- -14.8pp toward R · 2008: -8.5pp · 2024: -23.2pp
- All cycles
- 2024: R+23.2 2020: R+15.6 2016: R+14.8 2012: R+5.1 2008: R+8.5
Not yet ingested
- Civics
- —
Market trends
- HPI YoY
- ▼ -63.32%
- Current HPI
- 154.4174
- Rent YoY
- —
- Metro
- —
- State GDP YoY
- ▲ 2.94%
- F500 in state
- 4
Industry mix (Fortune 500 HQ in AL)
| Industry | F500 HQs | Revenue |
|---|---|---|
| Financial Services | 1 | $8B |
|
||
| Healthcare | 1 | $5B |
|
||
Price history
+0.0% since first listed3 events — show timeline
- 2026-04-26 Pending — EABOR
- 2026-03-05 Listed $159,900 EABOR
- 2026-03-04 Coming Soon $159,900 EABOR
Property tax history
+2.2%/yrLatest (2025): $669 · +0.6% YoY. Source: county tax records.
Cash-flow waterfall
monthlySold comps — $/sqft
last 12 mo · ≤1 miLoading sold comps…