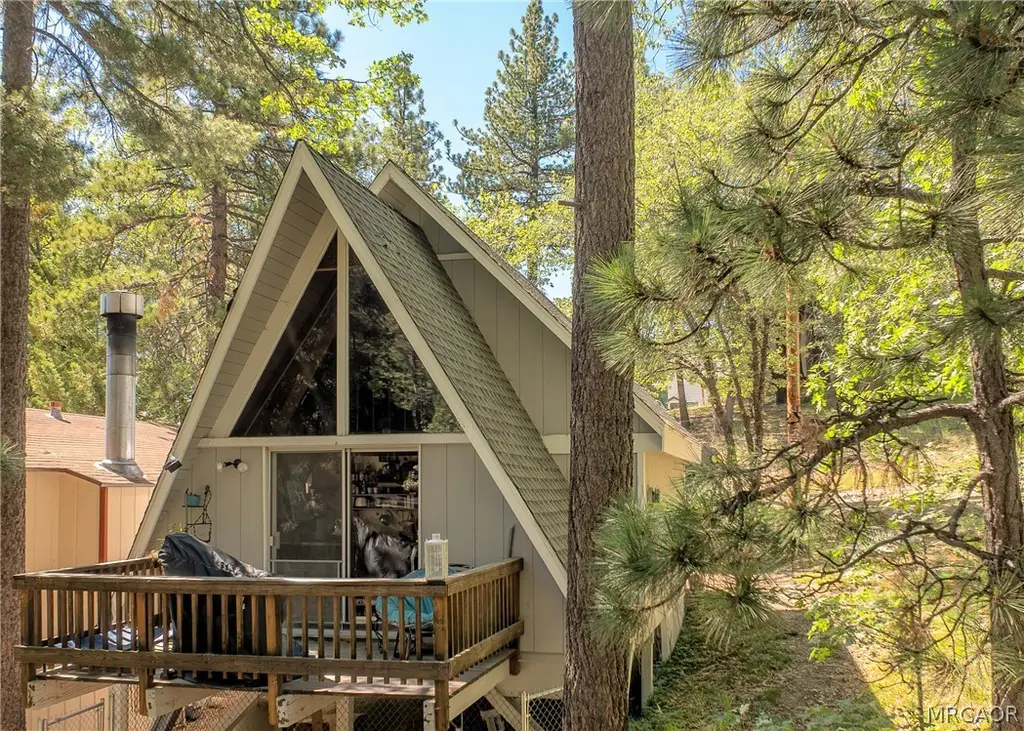
33075 Blue Bird Ln · Running Springs, CA
Flood risk 1/10 · Minimal
- FEMA flood zone
- D
- Chance of flooding over 30 yrs
- 0.0%
- Est. flood insurance / yr
- $544 – $1,084
Fire risk 6/10 · Moderate
- Est. fire insurance / yr
- $659 – $1,223
Heat risk 2/10 · Minimal
- Hot days now (above threshold)
- —
- Hot days in 30 yrs
- —
Wind risk 1/10 · Minimal
- Chance of severe wind over 30 yrs
- —
Air-quality risk 10/10 · Severe
- Unhealthy air days now
- 35 days/yr
- Unhealthy air days in 30 yrs
- 45 days/yr
Risk factors via First Street. Map © Google.
Why this score? — see what drove the D+ grade
The composite is a weighted blend of 9 inputs, each scored 0–100. Each bar is that input's sub-score; the figure is the points it added to the 100-point composite (weight × sub-score).
- Cash flow +15.4/30.0
- ARV discount +15.0/15.0
- DSCR +4.7/10.0
- Livability +3.3/5.0
- 1% rule +3.0/10.0
- Rent growth +2.5/5.0
- Condition / age +2.5/5.0
- Schools +2.1/10.0
- Appreciation +0.0/10.0
$225,000
🖨 Deal sheet (PDF) 📄 Offer letter ✓ Due diligence
Listing remarks MLS
Welcome to your mountain escape! Tucked away in the serene pines of the Arrowbear Lake community near Running Springs, 33075 Blue Bird Lane is the perfect cabin for anyone looking to break into mountain property ownership. This cabin sits on a double lot. Built in 1968, this charming 2-bedroom, 1-bath treehouse-style retreat packs incredible cozy appeal into an efficient 712-square-foot footprint. Large windows fill the intimate living space with natural sunlight and beautiful territorial views, making it an ideal, low-maintenance weekend getaway. This home is waiting for your personal touches. Location is outstanding, and this cabin hits the sweet spot. Situated perfectly between Lake Arrowhead and Big Bear, you are just minutes from Snow Valley Mountain Resort for skiing, hiking, and biking. If you’ve been dreaming of owning a piece of the San Bernardino Mountains without the stress of a massive estate, this affordable, classic sanctuary is ready to welcome you home to the mountain life.
Key facts
- Outstanding location
- Natural sunlight
- Skiing hiking biking
Tags
Property features AI
Finance
- Other: Single-unit property; No common walls
- Financial info: Subject to special assessments
- HOA & community: Mountainous community
Exterior
- Utilities: Public sewer; District/public water
- Home design: House; 2 total stories; No accessory dwelling unit
- Construction: Composition roof; Year built from assessor
- Exterior features: Porch; Patio; Lot is level/flat
Interior
- Bedrooms: Main floor bedroom
- Bathrooms: 1 full bathroom
- Interior features: Two levels; Main floor entry; Main level bedroom and bathroom; Has a view
- Laundry & utility: Laundry in closet
Neighborhood map
What this means for you Summary
Snapshot
- This is a 2-bed/1.0-bath single-family listed at $225k.
Deal economics
- At list price, monthly cash flow is $87 ($1k/yr) — positive.
- The deal already cash-flows at list — no discount required.
- To meet the 1% rule (rent ≥ 1% of price), the offer needs to be $180k (20.2% below list).
- Recommended offer: $180k (20.2% below list) — sets the bar for 1% rule.
- Cap rate 6.8% vs local median 3.9% in Running Springs — top-decile yield for the area; either an underpriced asset or a hidden risk that comps aren't pricing in. Stress-test before assuming the spread holds.
Location & tenants
- Location reads 66/100 on livability (#333 in CA) — a middle-class / working-renter tenant base. Strengths: housing A+, employment A-; Watch: crime C-, amenities F, cost of living F.
- Rim Of The World Unified (town): math 13% / reading 34% proficiency, ranked #415 of 517 in CA (top 80%) — low school quality limits family demand, transient renter base, plan for 1-2y turnover.
- Zoned schools: Charles Hoffman Elementary (295 students, 54% FRL); Mary P. Henck Intermediate (math 13% / reading 36%, grade F, #277 of 498 statewide, top 73%, 585 students, 61% FRL); Rim of The World Senior High (math 12% / reading 32%, grade F, #950 of 1,170 statewide, top 82%, 917 students, 52% FRL).
- Market conditions: 182 active listings in the ZIP; 5 comparable units currently listed for rent nearby; rentals lingering (median 45d on market — plan ~5-8 weeks vacancy on turnover, expect pricing pressure); 60% of comp listings sitting > 30 days — soft ceiling on asking rent; solid renter incomes; 5,458 units permitted in San Bernardino County in 2024 (1,500 in 5+ unit buildings).
Forward outlook
- Local home prices are declining (-3.0%/yr); year-one equity from $2k of loan paydown is wiped out by about $7k of value loss. Plan a longer hold.
- San Bernardino County population projected at +15% by 2050 — modest demand growth; plan on rents tracking national, not racing it.
Negotiation context
- It's been on market 17 days — a 2% lower offer ($222k) is reasonable based on typical stale-listing flexibility.
- 2 sale attempts with the ask held roughly flat each time — persistent listings suggest the price (not the market) is what's stuck; bring a comps-based counter.
- Current owner paid $89k; list at $225k implies a 153% gain — meaningful room to come down on a strong offer.
Risks & watch-outs
- Climate carrying-cost: major wildfire risk — expect insurance premiums to compound above CPI over the hold.
Questions for the listing agent
- Built in 1968 — when were the roof, HVAC, electrical panel, plumbing, and water heater last replaced?
- Is there a deadline driving the sale (1031 exchange, divorce, estate, relocation)? That informs how much negotiation room exists.
- Schools are D-rated, which usually means shorter tenancies and higher turnover. Who's the typical renter profile here, and what's been the actual vacancy rate?
- The area grade is low — what's the realistic commute time and amenity access for the typical tenant pool here? Any planned neighborhood developments (good or bad) we should know about?
- What's the average days-on-market for RENTAL listings here right now (not sales)? A rising rental-DOM trend means longer vacancies and softer asking-rent achievability than the comps imply.
- What's the recent tenant-quality profile in this submarket — average credit score on applications, eviction rate, late-payment / NSF rate, and stable-employment percentage? A property-management company in the area should have these aggregated.
- How much new for-sale + rental construction is in the pipeline within 1–3 miles? Heavy new supply typically softens prices + rents 12–24 months out; constrained supply supports both.
Investment metrics
- 1% rule
- 0.80% ✗
- Cap rate
- 6.75%
- Cash-on-cash
- 1.65%
- DSCR
- 1.07
- GRM
- 10.4
CMA / ARV
- ARV (on-the-fly)
- $283,376
- Comps found
- 12
Show comp detail 12 sales within ~0.75 mi
| Address | Dist | Beds/Ba | Sqft | Sold | Price | $/sf | Match |
|---|---|---|---|---|---|---|---|
| 33070 Falcon Ln | 0.02mi | 2/1.0 | 736 (+3%) | 8mo | $309,000 | $420 | 86 |
| 2313 Birch Dr | 0.16mi | 2/1.0 | 720 (+1%) | 6mo | $590,000 | $819 | 86 |
| 2412 Ridge Dr | 0.05mi | 2/1.0 | 736 (+3%) | 8mo | $245,000 | $333 | 86 |
| 32961 Squirrel | 0.23mi | 2/1.0 | 732 (+3%) | 3mo | $305,000 | $417 | 82 |
| 32703 Tulip Ln | 0.46mi | 2/1.0 | 704 (-1%) | 2mo | $285,000 | $405 | 75 |
| 32773 Evergreen | 0.37mi | 2/1.0 | 700 (-2%) | 6mo | $255,500 | $365 | 75 |
| 2474-2474 Fir | 0.20mi | 1/1.0 (-1) | 750 (+5%) | 3mo | $250,000 | $333 | 74 |
| 32871 Cougar Ln | 0.27mi | 2/1.0 | 660 (-7%) | 7mo | $246,900 | $374 | 69 |
| 32876 Lone Pine Dr | 0.28mi | 2/1.0 | 768 (+8%) | 8mo | $284,000 | $370 | 67 |
| 32905 Chipmunk Ln | 0.27mi | 2/1.0 | 608 (-15%) | 3mo | $242,000 | $398 | 61 |
| 32810 Deer Lick | 0.38mi | 1/1.5 (-1) | 658 (-8%) | 6mo | $295,000 | $448 | 58 |
| 33355 Carlock Dr | 0.44mi | 2/1.5 | 816 (+15%) | 9mo | $245,000 | $300 | 45 |
Match score weights: distance 35% · size 25% · config 20% · recency 20%. Top-matched comps best support the ARV.
Projected returns pro-forma
-3.0% appreciation · 3.0% rent growth · sell at horizon
- IRR
- -13.7%
- Equity multiple
- 0.51×
- Total profit
- $-31,052
- Equity at exit
- $33,548
- IRR
- -5.0%
- Equity multiple
- 0.68×
- Total profit
- $-20,382
- Equity at exit
- $19,454
Cash invested: $63,000 (down + closing). Projections, not guarantees.
Landlord ↔ Tenant lean methodology
- Overall (STATE)
- 18 Strongly Tenant-Friendly
- State California
- 18 Strongly Tenant-Friendly · D+13
- County
- — inherits STATE
- City
- — inherits STATE
ZIP-level market 92382
- Active inventory
- 182
- Price-to-rent
- 10.4×
Monthly cashflow live
- Estimated rent
- $1,796 high interval (Pro) →
- Mortgage (P&I)
- −$1,180
- Tax from tax record
- −$58 /mo · $702/yr
- Insurance
- −$94
- HOA
- −$0
- Vacancy / Maint / Mgmt
- −$377
- Net cashflow
- $87
Break-even live
Sensitivity live
| Price | -10% $214 | -5% $150 | +0% $87 | +5% $23 | +10% $-41 |
|---|---|---|---|---|---|
| Rent | -10% $-55 | -5% $16 | +0% $87 | +5% $158 | +10% $229 |
| Rate | -1.0pp $200 | -0.5pp $144 | base $87 | +0.5pp $28 | +1.0pp $-31 |
UW: 25.0% down · 7.5% · 30yr · 1.5% tax · 5.0% vac · 8.0% maint · 8.0% mgmt
Financing live
Cash to close
- Down payment
- $56,250
- Closing costs
- $6,750
- Reserves months
- —
- Total cash needed
- —
Loan-product check · same deal, 3 products live
Conventional
25% down · 7.5% · 30yr
- Down + closing
- —
- Monthly P&I
- —
- Monthly cashflow
- —
- DSCR
- —
- Eligible?
- —
Personal DTI + credit; lowest rate.
DSCR
20% down · 8.5% · 30yr
- Down + closing
- —
- Monthly P&I
- —
- Monthly cashflow
- —
- DSCR
- —
- Eligible?
- —
No personal income docs; deal must DSCR.
Hard money
10% down · 12.0% · 12mo
- Down + closing
- —
- Monthly P&I
- —
- Monthly cashflow
- —
- DSCR
- —
- Eligible?
- —
Short-term bridge; refi at stabilization.
Rent comps 5 comps
| Address | Beds | Baths | Sqft | Rent | $/sqft | DOM | Units | Dist |
|---|---|---|---|---|---|---|---|---|
| 2418 Fir Dr Running Springs, CA | 2.0 | 1.0 | 620 | $1,650 | $2.66 | 0d | 1 | 0.21mi |
| 2490 Fern Dr Running Springs, CA | 1.0 | 1.0 | 700 | $1,849 | $2.64 | 45d | 1 | 0.21mi |
| 32868 Deer Ln Running Springs, CA | 2.0 | 2.0 | 650 | $1,650 | $2.54 | 25d | 1 | 0.33mi |
| 2620 Dade Dr Unit 2 Running Springs, CA | 1.0 | 1.0 | 500 | $1,400 | $2.80 | 45d | 1 | 1.13mi |
| 32132 West Dr Running Springs, CA | 1.0 | 1.0 | 700 | $1,400 | $2.00 | 45d | 1 | 1.17mi |
Listing history 11 events
-
2026-06-21days on market $225,000 Active 17 DOM
-
2026-06-18days on market $225,000 Active 14 DOM
-
2026-06-17days on market $225,000 Active 13 DOM
-
2026-06-16days on market $225,000 Active 12 DOM
-
2026-06-15days on market $225,000 Active 11 DOM
-
2026-06-13days on market $225,000 Active 9 DOM
-
2026-06-13days on market $225,000 Active 8 DOM
-
2026-06-09days on market $225,000 Active 5 DOM
-
2026-06-08days on market $225,000 Active 4 DOM
-
2026-06-07remarks 699-char remark
-
2026-06-07$225,000 Active 3 DOM
ⓘ Source: listings_history table (triggers on properties + properties_extension) + one-shot
backfill from property_details.listing_events for pre-trigger history.
Tax reassessment forecast CA · Resets to sale price
- Current annual tax
- $702 · $58/mo
- Projected year-2 tax
- $1,710 · $142/mo
- Expected delta
- +$1,008/yr (+$84/mo · 143.7%)
ⓘ Screening estimate from a state-policy table — verify with the county assessor before closing.
Climate risk First Street
- Flood 1/10 Low FEMA zone D · 0% chance over 30 yrs
- Wildfire 6/10 Major
- Heat 2/10 Low
- Wind 1/10 Low
- Air quality 10/10 Extreme 35 unhealthy d/yr today · 45 by 30 yrs out
Nearby sold comps map
Loading sold comps map…
Walkable amenities ~0.75 mi
Loading nearby amenities…
Taxation est. · year 1
- Rental income
- $21,551
- − Mortgage interest
- −$12,603
- − Property taxes
- −$702
- − Insurance
- −$1,125
- − Repairs & maintenance
- −$1,724
- − Management
- −$1,724
- − Depreciation
- −$6,545
- Taxable loss
- −$2,873
- Est. tax savings @ 24.0%
- +$689
- After-tax cash flow
- $1,729/yr
For passive investors: Depreciation is non-cash, so a rental often shows a tax loss while cash-flowing — sheltering income. Rental losses are passive: they offset passive income freely, and up to $25,000/yr can offset ordinary (W-2) income if you actively participate and your MAGI is under $100k (phasing out to $0 by $150k); unused losses carry forward. On sale, claimed depreciation is recaptured at up to 25%, and gains may owe capital-gains tax (a 1031 exchange can defer both). Figures are a year-1 estimate at your 24.0% rate — not tax advice; consult a CPA.
Schools (NCES district)
- District
- Rim Of The World Unified
- NCES district ID
- 0632610
- Math proficiency
- 13% ▼ -10.00%
- Reading proficiency
- 34% ▼ -7.00%
- Median HH income
- $55,860
- Composite
- 21.29/100
- National rank
- #8389
- State rank
- #415 of 517 in CA
Livability — Running Springs
- Score
- 66/100
- State rank
- #333
- US rank
- #11396
Category grades
Schools grade is shown separately in the Schools card above.
Census & demographics
- Census place
- Running Springs, CA
- County
- San Bernardino County · 2,030,291 people
- City population
- 5,215
- Metro
- Riverside-San Bernardino-Ontario, CA
- Population (ZIP)
- 5,215
- Household income
- $81,493
- Rent vs Own
- Severe rent burden
- 255.0
Population outlook (San Bernardino County) Hauer SSP2
- Today (2025)
- 2,300,329 people
- By 2030
- 2,378,907 · +3.4%
- By 2040
- 2,523,137 · +9.7%
- By 2050
- 2,642,388 · +14.9%
- By 2075
- 2,880,769 · +25.2%
- By 2100
- 2,909,436 · +26.5%
Race, ethnicity, and origin ACS 2023
- Neighborhood character
- Predominantly White (70%)
- Race & ethnicity
- White 70% Hispanic / Latino 21% Two or more races 17% Asian 3% Native American 1%
- Hispanic origin (detail)
- Mexican 18%
- Common ancestry
- Iranian 2% Slovak 2% Scotch-Irish 2%
- Foreign-born
- 5% · Canada, South Korea
- Languages at home
- 90% English-only · Spanish 6% Tagalog/Filipino 3% French/Haitian/Cajun 1%
Political lean MEDSL · San Bernardino
- 2024 margin
- Toss-up / Even · D 47.5% · R 49.7% · Other 2.8%
- 2008→2024 swing
- -8.5pp toward R · 2008: 6.3pp · 2024: -2.1pp
- All cycles
- 2024: R+2.1 2020: D+10.7 2016: D+9.8 2012: D+5.4 2008: D+6.3
Not yet ingested
- Civics
- —
Market trends
- HPI YoY
- ▼ -263.08%
- Current HPI
- 341.4318
- Rent YoY
- —
- Metro
- Riverside-San Bernardino-Ontario, CA
- State GDP YoY
- ▲ 3.21%
- F500 in state
- 116
Industry mix (Fortune 500 HQ in CA)
| Industry | F500 HQs | Revenue |
|---|---|---|
| Technology | 27 | $1,492B |
|
||
| Financial Services | 3 | $174B |
|
||
| Retail | 3 | $44B |
|
||
| Insurance | 3 | $26B |
|
||
| Media / Entertainment | 2 | $115B |
|
||
| Pharmaceuticals / Biotech | 2 | $62B |
|
||
Price history
+152.8% since first listed3 events — show timeline
- 2026-06-04 Listed $225,000 CRMLS
- 2026-06-04 Listed $225,000 MRCAOR
- 2014-09-16 Sold (Public Records) $89,000 Public Records
Property tax history
+1.5%/yrLatest (2025): $702 · +2.5% YoY. Source: county tax records.
Cash-flow waterfall
monthlySold comps — $/sqft
last 12 mo · ≤1 miLoading sold comps…