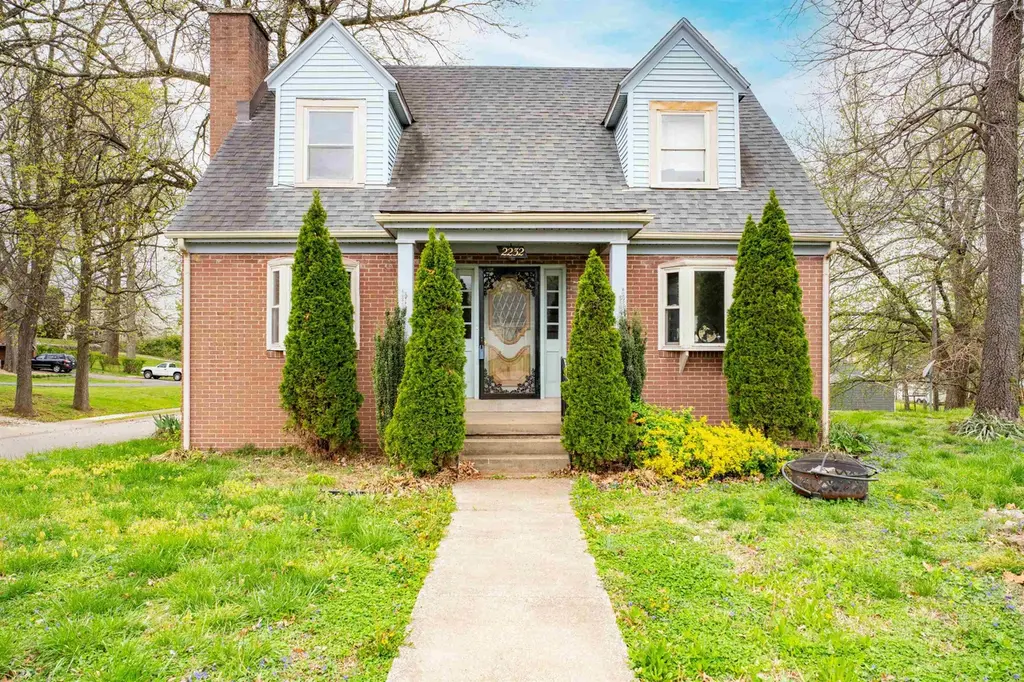
2232 Mcconnell Ave · Owensboro, KY
Flood risk 1/10 · Minimal
- FEMA flood zone
- X (unshaded)
- Chance of flooding over 30 yrs
- 0.0%
- Est. flood insurance / yr
- $473 – $860
Fire risk 1/10 · Minimal
- Est. fire insurance / yr
- $839 – $1,559
Heat risk 5/10 · Moderate
- Hot days now (above 108°F)
- 7 days/yr
- Hot days in 30 yrs
- 19 days/yr
Wind risk 2/10 · Minimal
- Chance of severe wind over 30 yrs
- 4.0%
Air-quality risk 3/10 · Minor
- Unhealthy air days now
- 2 days/yr
- Unhealthy air days in 30 yrs
- 3 days/yr
Risk factors via First Street. Map © Google.
Why this score? — see what drove the F grade
The composite is a weighted blend of 9 inputs, each scored 0–100. Each bar is that input's sub-score; the figure is the points it added to the 100-point composite (weight × sub-score).
- Cash flow +13.8/30.0
- DSCR +4.2/10.0
- Livability +3.6/5.0
- 1% rule +2.6/10.0
- Schools +2.6/10.0
- Rent growth +2.5/5.0
- Condition / age +2.5/5.0
- ARV discount +2.0/15.0
- Appreciation +0.0/10.0
$189,900
🖨 Deal sheet (PDF) 📄 Offer letter ✓ Due diligence
Listing remarks MLS
Quality Built in 1940, this 4-bedroom 1.5-bath home with basement offers an enchanting English cottage-inspired exterior. But inside modern amenities merge effortlessly with the home's original craftsmanship. Fireplace in family room. Formal dining room flows into the updated Kitchen. with New granite countertops, new tile backsplash, refinished cabinets , new undermount sink, all appliances included. Main floor offers a 1st floor bedroom, with 3 more bedrooms upstairs. Unfinished Basement with storage galore, plus garage. Nestled on a corner lot near quiet dead-end streets. .. Tall trees define the area: Hidden and quiet, this home is simply beautiful. Live happily ever after and have peace of mind regarding the exceptional value!
Key facts
- Arched walkways
- Updated kitchen
- Sparkling windows
Tags
Neighborhood map
What this means for you Summary
Snapshot
- This is a 3-bed/1.0-bath single-family listed at $190k.
Deal economics
- At list price, monthly cash flow is $16 ($198/yr) — positive.
- The deal already cash-flows at list — no discount required.
- To meet the 1% rule (rent ≥ 1% of price), the offer needs to be $144k (24.0% below list).
- Recommended offer: $144k (24.0% below list) — sets the bar for 1% rule.
- Cap rate 6.4% vs local median 3.1% in Owensboro — top-decile yield for the area; either an underpriced asset or a hidden risk that comps aren't pricing in. Stress-test before assuming the spread holds.
Location & tenants
- Location reads 71/100 on livability (#148 in KY) — a middle-class / working-renter tenant base. Strengths: cost of living A+, housing A+, health & safety B; Watch: employment D+, crime D-, amenities F.
- Owensboro Independent (urban): math 27% / reading 36% proficiency, ranked #100 of 165 in KY (top 61%) — families likely to look elsewhere, expect single-tenant / working-renter base with shorter leases; 63% free/reduced lunch — lower-income household profile, screen leases tightly.
- Market conditions: 360 active listings in the ZIP; 2 comparable units currently listed for rent nearby; 226 units permitted in Daviess County in 2024 (6 in 5+ unit buildings).
Forward outlook
- Local home prices are declining (-3.0%/yr); year-one equity from $1k of loan paydown is wiped out by about $6k of value loss. Plan a longer hold.
- Daviess County population projected at +6% by 2050 — modest demand growth; plan on rents tracking national, not racing it.
Negotiation context
- It's been on market 68 days — a 6% lower offer ($179k) is reasonable based on typical stale-listing flexibility.
- 3 sale attempts since 2y ago with the ask held roughly flat each time — persistent listings suggest the price (not the market) is what's stuck; bring a comps-based counter.
Risks & watch-outs
- Watch-outs: built in 1940 — expect roof / HVAC / electrical / plumbing capex.
- Climate carrying-cost: extreme-heat days projected 7→19/yr by 2055 (HVAC capex compounding) — expect insurance premiums to compound above CPI over the hold.
Questions for the listing agent
- It's been on market 68 days. Have you received any prior offers? Is the seller open to a 24% concession, seller financing, or rate buy-down credit?
- Built in 1940 — when were the roof, HVAC, electrical panel, plumbing, and water heater last replaced?
- Why hasn't it sold? Are there any deal-killer items the seller is aware of (foundation, flood, title, zoning, code violations)?
- Is there a deadline driving the sale (1031 exchange, divorce, estate, relocation)? That informs how much negotiation room exists.
- Crime grade is D in this area — have there been break-ins, vandalism, or insurance claims at this property in the last 3 years? What carrier currently insures it and at what premium?
- The area grade is low — what's the realistic commute time and amenity access for the typical tenant pool here? Any planned neighborhood developments (good or bad) we should know about?
- What's the average days-on-market for RENTAL listings here right now (not sales)? A rising rental-DOM trend means longer vacancies and softer asking-rent achievability than the comps imply.
- What's the recent tenant-quality profile in this submarket — average credit score on applications, eviction rate, late-payment / NSF rate, and stable-employment percentage? A property-management company in the area should have these aggregated.
- How much new for-sale + rental construction is in the pipeline within 1–3 miles? Heavy new supply typically softens prices + rents 12–24 months out; constrained supply supports both.
Investment metrics
- 1% rule
- 0.76% ✗
- Cap rate
- 6.40%
- Cash-on-cash
- 0.37%
- DSCR
- 1.02
- GRM
- 11.0
CMA / ARV
- ARV (median comp)
- $169,374
- List price
- $189,900
- Delta
- 12.12%
- Verdict
- OVERPRICED
- Comps
- 20 within 1.0 mi
Show comp detail 12 sales within ~0.75 mi
| Address | Dist | Beds/Ba | Sqft | Sold | Price | $/sf | Match |
|---|---|---|---|---|---|---|---|
| 2100 Prince Ave | 0.16mi | 2/1.0 (-1) | 1,296 (-7%) | 2mo | $159,900 | $123 | 74 |
| 2541 Strawbridge Pl | 0.23mi | 3/2.0 | 1,301 (-6%) | 2mo | $86,000 | $66 | 72 |
| 1901 Prince Ave | 0.29mi | 3/2.0 | 1,464 (+5%) | 4mo | $115,000 | $79 | 71 |
| 1331 Gilbert Ln | 0.54mi | 3/2.0 | 1,409 (+1%) | 1mo | $190,000 | $135 | 68 |
| 725 E 21st St | 0.64mi | 3/2.0 | 1,411 (+1%) | 0mo | $135,000 | $96 | 64 |
| 2000 Meadow Grass Crk | 0.59mi | 3/2.0 | 1,380 (-1%) | 5mo | $245,000 | $178 | 63 |
| 2636 Landing Terrace (heartlands) Ter | 0.34mi | 3/2.0 | 1,244 (-11%) | 2mo | $245,000 | $197 | 61 |
| 2838 Strawbridge Pl | 0.56mi | 3/1.5 | 1,488 (+7%) | 5mo | $199,900 | $134 | 56 |
| 1704 Mcconnell Ave | 0.38mi | 2/1.0 (-1) | 1,229 (-12%) | 4mo | $79,900 | $65 | 54 |
| 2613 Central Park Ct | 0.30mi | 2/2.0 (-1) | 1,210 (-13%) | 1mo | $225,000 | $186 | 54 |
| 2608 Central Park Ct | 0.31mi | 2/2.0 (-1) | 1,205 (-13%) | 3mo | $220,000 | $183 | 52 |
| 2650 Wisteria Gdns | 0.46mi | 2/2.0 (-1) | 1,197 (-14%) | 2mo | $225,000 | $188 | 44 |
Match score weights: distance 35% · size 25% · config 20% · recency 20%. Top-matched comps best support the ARV.
Projected returns pro-forma
-3.0% appreciation · 3.0% rent growth · sell at horizon
- IRR
- -15.8%
- Equity multiple
- 0.44×
- Total profit
- $-29,818
- Equity at exit
- $28,315
- IRR
- -7.4%
- Equity multiple
- 0.53×
- Total profit
- $-24,997
- Equity at exit
- $16,419
Cash invested: $53,172 (down + closing). Projections, not guarantees.
Landlord ↔ Tenant lean methodology
- Overall (STATE)
- 83 Strongly Landlord-Friendly
- State Kentucky
- 83 Strongly Landlord-Friendly · R+16
- County
- — inherits STATE
- City
- — inherits STATE
ZIP-level market 42303
- Home prices YoY
- -29.1%
- Active inventory
- 360
- Price-to-rent
- 11.0×
Monthly cashflow live
- Estimated rent
- $1,443 medium interval (Pro) →
- Mortgage (P&I)
- −$996
- Tax from tax record
- −$49 /mo · $584/yr
- Insurance
- −$79
- HOA
- −$0
- Vacancy / Maint / Mgmt
- −$303
- Net cashflow
- $16
Break-even live
Sensitivity live
| Price | -10% $124 | -5% $70 | +0% $16 | +5% $-37 | +10% $-91 |
|---|---|---|---|---|---|
| Rent | -10% $-98 | -5% $-41 | +0% $16 | +5% $73 | +10% $130 |
| Rate | -1.0pp $112 | -0.5pp $65 | base $16 | +0.5pp $-33 | +1.0pp $-83 |
UW: 25.0% down · 7.5% · 30yr · 1.5% tax · 5.0% vac · 8.0% maint · 8.0% mgmt
Financing live
Cash to close
- Down payment
- $47,475
- Closing costs
- $5,697
- Reserves months
- —
- Total cash needed
- —
Loan-product check · same deal, 3 products live
Conventional
25% down · 7.5% · 30yr
- Down + closing
- —
- Monthly P&I
- —
- Monthly cashflow
- —
- DSCR
- —
- Eligible?
- —
Personal DTI + credit; lowest rate.
DSCR
20% down · 8.5% · 30yr
- Down + closing
- —
- Monthly P&I
- —
- Monthly cashflow
- —
- DSCR
- —
- Eligible?
- —
No personal income docs; deal must DSCR.
Hard money
10% down · 12.0% · 12mo
- Down + closing
- —
- Monthly P&I
- —
- Monthly cashflow
- —
- DSCR
- —
- Eligible?
- —
Short-term bridge; refi at stabilization.
Rent comps 2 comps
| Address | Beds | Baths | Sqft | Rent | $/sqft | DOM | Units | Dist |
|---|---|---|---|---|---|---|---|---|
| 636 W Highland Ave Owensboro, KY | 2.0 | 1.0 | 920 | $1,250 | $1.36 | 22d | 1 | 1.14mi |
| 1302 Daviess St Owensboro, KY | 3.0 | 1.0 | 1008 | $1,200 | $1.19 | 22d | 1 | 1.19mi |
Listing history 8 events
-
2026-04-23price $189,900 741-char remark
Show marketing remark (741 chars)
Quality Built in 1940, this 4-bedroom 1.5-bath home with basement offers an enchanting English cottage-inspired exterior. But inside modern amenities merge effortlessly with the home's original craftsmanship. Fireplace in family room. Formal dining room flows into the updated Kitchen. with New granite countertops, new tile backsplash, refinished cabinets , new undermount sink, all appliances included. Main floor offers a 1st floor bedroom, with 3 more bedrooms upstairs. Unfinished Basement with storage galore, plus garage. Nestled on a corner lot near quiet dead-end streets. .. Tall trees define the area: Hidden and quiet, this home is simply beautiful. Live happily ever after and have peace of mind regarding the exceptional value!
-
2026-03-19$194,000 Active 741-char remark
Show marketing remark (741 chars)
Quality Built in 1940, this 4-bedroom 1.5-bath home with basement offers an enchanting English cottage-inspired exterior. But inside modern amenities merge effortlessly with the home's original craftsmanship. Fireplace in family room. Formal dining room flows into the updated Kitchen. with New granite countertops, new tile backsplash, refinished cabinets , new undermount sink, all appliances included. Main floor offers a 1st floor bedroom, with 3 more bedrooms upstairs. Unfinished Basement with storage galore, plus garage. Nestled on a corner lot near quiet dead-end streets. .. Tall trees define the area: Hidden and quiet, this home is simply beautiful. Live happily ever after and have peace of mind regarding the exceptional value!
-
2025-10-20$189,900 Active
-
2024-03-04soldstatus $179,000
-
2024-02-29soldstatus $179,000 Closed
-
2024-01-17status Pending
-
2024-01-04$179,000 Active
-
2023-10-04soldstatus $92,000
ⓘ Source: listings_history table (triggers on properties + properties_extension) + one-shot
backfill from property_details.listing_events for pre-trigger history.
Tax reassessment forecast KY · Resets to sale price
- Current annual tax
- $584 · $49/mo
- Projected year-2 tax
- $1,633 · $136/mo
- Expected delta
- +$1,050/yr (+$87/mo · 179.8%)
ⓘ Screening estimate from a state-policy table — verify with the county assessor before closing.
Climate risk First Street
- Flood 1/10 Low FEMA zone X (unshaded) · 0% chance over 30 yrs
- Wildfire 1/10 Low
- Heat 5/10 Major 7 d/yr ≥108°F today · 19 d/yr by 30 yrs out
- Wind 2/10 Low 4% chance of damaging wind over 30 yrs
- Air quality 3/10 Moderate 2 unhealthy d/yr today · 3 by 30 yrs out
Nearby sold comps map
Loading sold comps map…
Walkable amenities ~0.75 mi
Loading nearby amenities…
Taxation est. · year 1
- Rental income
- $17,318
- − Mortgage interest
- −$10,637
- − Property taxes
- −$584
- − Insurance
- −$950
- − Repairs & maintenance
- −$1,385
- − Management
- −$1,385
- − Depreciation
- −$5,524
- Taxable loss
- −$3,148
- Est. tax savings @ 24.0%
- +$756
- After-tax cash flow
- $953/yr
For passive investors: Depreciation is non-cash, so a rental often shows a tax loss while cash-flowing — sheltering income. Rental losses are passive: they offset passive income freely, and up to $25,000/yr can offset ordinary (W-2) income if you actively participate and your MAGI is under $100k (phasing out to $0 by $150k); unused losses carry forward. On sale, claimed depreciation is recaptured at up to 25%, and gains may owe capital-gains tax (a 1031 exchange can defer both). Figures are a year-1 estimate at your 24.0% rate — not tax advice; consult a CPA.
Schools (NCES district)
- District
- Owensboro Independent
- NCES district ID
- 2104590
- Math proficiency
- 27% ▼ -16.00%
- Reading proficiency
- 36% ▼ -14.00%
- Median HH income
- $33,020
- Composite
- 25.79/100
- National rank
- #7364
- State rank
- #100 of 165 in KY
Livability — Owensboro
- Score
- 71/100
- State rank
- #148
- US rank
- #7153
Category grades
Schools grade is shown separately in the Schools card above.
Census & demographics
- Census place
- Owensboro, KY
- County
- Daviess County · 87,564 people
- City population
- 87,564
- Metro
- Owensboro, KY
- Population (ZIP)
- 42,119
- Household income
- $64,773
- Rent vs Own
- Severe rent burden
- 983.0
Population outlook (Daviess County) Hauer SSP2
- Today (2025)
- 103,810 people
- By 2030
- 105,722 · +1.8%
- By 2040
- 108,731 · +4.7%
- By 2050
- 110,295 · +6.2%
- By 2075
- 113,056 · +8.9%
- By 2100
- 106,257 · +2.4%
Race, ethnicity, and origin ACS 2023
- Neighborhood character
- Predominantly White (85%)
- Race & ethnicity
- White 85% Hispanic / Latino 5% Two or more races 5% Black 3% Asian 2%
- Common ancestry
- Italian 2% Slovak 1% Lithuanian 1%
- Foreign-born
- 4% · Canada, Philippines
- Languages at home
- 94% English-only · Spanish 3% Other Indo-European 1% Other Asian/Pacific 1%
Political lean MEDSL · Daviess
- 2024 margin
- Solid R (+31.9) · D 33.3% · R 65.2% · Other 1.5%
- 2008→2024 swing
- -21.8pp toward R · 2008: -10.1pp · 2024: -31.9pp
- All cycles
- 2024: R+31.9 2020: R+27.9 2016: R+32.2 2012: R+21.1 2008: R+10.1
Not yet ingested
- Civics
- —
Market trends
- HPI YoY
- ▼ -89.55%
- Current HPI
- 217.7128
- Rent YoY
- —
- Metro
- Owensboro, KY
- State GDP YoY
- ▲ 1.81%
- F500 in state
- 4
Industry mix (Fortune 500 HQ in KY)
| Industry | F500 HQs | Revenue |
|---|---|---|
| Healthcare | 1 | $118B |
|
||
| Food / Beverage | 1 | $7B |
|
||
Price history
+106.4% since first listed8 events — show timeline
- 2026-04-23 Price Changed $189,900 GORAMLS
- 2026-03-19 Listed $194,000 GORAMLS
- 2025-10-20 Listed $189,900 GORAMLS
- 2024-03-04 Sold (Public Records) $179,000 Public Records
- 2024-02-29 Sold (MLS) $179,000 HKARMLS
- 2024-01-17 Pending — HKARMLS
- 2024-01-04 Listed $179,000 HKARMLS
- 2023-10-04 Sold (Public Records) $92,000 Public Records
Property tax history
+16.3%/yrLatest (2025): $584 · +88.2% YoY. Source: county tax records.
Cash-flow waterfall
monthlySold comps — $/sqft
last 12 mo · ≤1 miLoading sold comps…