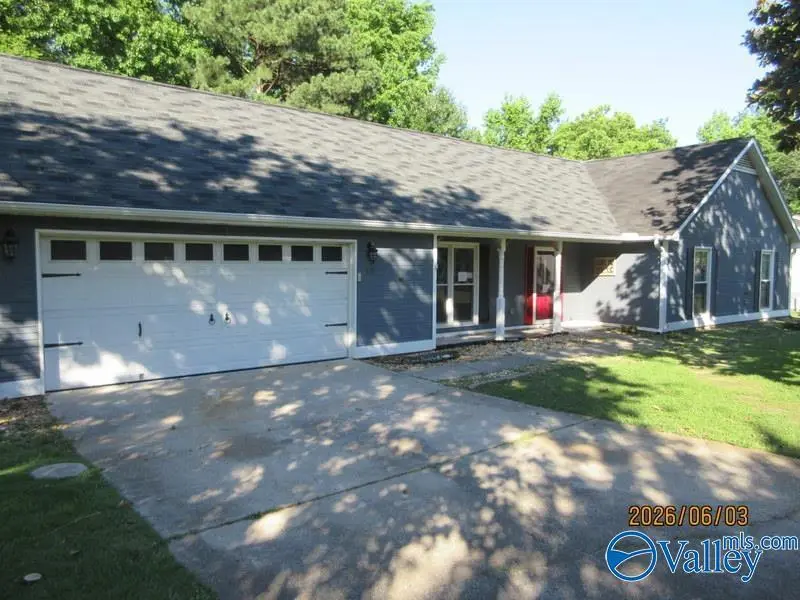
119 Shoalford Dr · Huntsville, AL
Flood risk 6/10 · Moderate
- FEMA flood zone
- X (unshaded)
- Chance of flooding over 30 yrs
- 0.7%
- Est. flood insurance / yr
- $507 – $1,088
Fire risk 2/10 · Minimal
- Est. fire insurance / yr
- $916 – $1,700
Heat risk 5/10 · Moderate
- Hot days now (above 104°F)
- 7 days/yr
- Hot days in 30 yrs
- 19 days/yr
Wind risk 4/10 · Minor
- Chance of severe wind over 30 yrs
- 17.0%
Air-quality risk 2/10 · Minimal
- Unhealthy air days now
- 0 days/yr
- Unhealthy air days in 30 yrs
- 1 days/yr
Risk factors via First Street. Map © Google.
Why this score? — see what drove the C grade
The composite is a weighted blend of 9 inputs, each scored 0–100. Each bar is that input's sub-score; the figure is the points it added to the 100-point composite (weight × sub-score).
- ARV discount +15.0/15.0
- Cash flow +13.6/30.0
- Appreciation +10.0/10.0
- DSCR +4.1/10.0
- Livability +4.1/5.0
- Schools +3.7/10.0
- Rent growth +3.1/5.0
- 1% rule +2.6/10.0
- Condition / age +2.5/5.0
$253,000
🖨 Deal sheet 📄 Offer letter ✓ Due diligence
Listing remarks MLS
Better than new home in one of Huntsville's most convenient neighborhoods! This 3 bedroom 2 bath rancher is on a quiet street and has been thoughtfully updated over the past few years. The large master suite has an office space (perfect for working from home!), oversized bathroom, walk-in closet and sliding glass door that leads to the patio. The quaint bonus room upstairs is a perfect place for a second private office, 4th bedroom, media room, play room or artist studio. The true beauty of this home is when you step into the park like backyard! New HVAC & exterior paint, hot water heater 5 years old, windows and roof 8-10 years. Welcome Home!
Key facts
- Office space
- Oversized deck
- Fenced yard
Tags
Property features AI
Finance
- Other: Subdivision: Stix
- HOA & community: No homeowners association
Exterior
- Parking: Attached two-car garage facing front
- Utilities: Septic tank sewer
- Home design: Single-family residence; One story; Built in 1989; Not new construction
- Construction: Slab foundation
- Exterior features: Treed lot; Detached building; Deck; Front porch; Public water
Interior
- Kitchen: Range; Dishwasher
- Bathrooms: 2 full bathrooms
- Heating & cooling: Central heating; Central cooling; Window cooling
- Interior features: 7 total rooms; Fireplace (see remarks)
Neighborhood map
What this means for you Summary
Snapshot
- This is a 3-bed/1.0-bath single-family listed at $253k.
Deal economics
- At list price, monthly cash flow is $15 ($181/yr) — positive.
- The deal already cash-flows at list — no discount required.
- To meet the 1% rule (rent ≥ 1% of price), the offer needs to be $192k (24.0% below list).
- Recommended offer: $192k (24.0% below list) — sets the bar for 1% rule.
- Cap rate 6.4% vs local median 3.8% in Huntsville — top-decile yield for the area; either an underpriced asset or a hidden risk that comps aren't pricing in. Stress-test before assuming the spread holds.
Location & tenants
- Location reads 82/100 on livability (#3 in AL, #1,082 nationally) — a professional / high-income tenant draw. Strengths: commute A+, cost of living A+, housing A+; Watch: crime F.
- Madison County (rural): math 27% / reading 56% proficiency, ranked #19 of 129 in AL (top 15%) — families likely to look elsewhere, expect single-tenant / working-renter base with shorter leases.
- Zoned schools: Legacy Elementary School (math 27% / reading 62%, grade F, #171 of 627 statewide, top 31%, 631 students, 29% FRL); Monrovia Middle School (math 29% / reading 66%, grade C-, #32 of 257 statewide, top 12%, 1,003 students, 31% FRL); Sparkman High School (math 28% / reading 37%, grade F, #58 of 305 statewide, top 19%, 1,738 students, 37% FRL) — zoned schools at 32% FRL track the district average.
- Market conditions: Rents rising (+2.6%/yr); 213 active listings in the ZIP; 7 comparable units currently listed for rent nearby; rentals lingering (median 44d on market — plan ~5-8 weeks vacancy on turnover, expect pricing pressure); 71% of comp listings sitting > 30 days — soft ceiling on asking rent; solid renter incomes; 4,709 units permitted in Madison County in 2024 (1,186 in 5+ unit buildings).
Forward outlook
- In year one you build about $27k of equity ($2k loan paydown + $25k appreciation (10.0% local appreciation)).
- Madison County population projected at +18% by 2050 — long-run rental-demand tailwind backs the buy-and-hold thesis.
- At projected returns (10.0% appreciation + 2.6% rent growth), your $71k cash investment doubles in ~3 years — after that, you're playing with house money.
- By year 2, paydown + projected appreciation supports a ~$43k cash-out refi (75% LTV) — recoverable capital for the next deal without selling this one.
Negotiation context
- It's been on market 15 days — a 2% lower offer ($249k) is reasonable based on typical stale-listing flexibility.
- 2 sale attempts since 6y ago with the ask held roughly flat each time — persistent listings suggest the price (not the market) is what's stuck; bring a comps-based counter.
Risks & watch-outs
- Climate carrying-cost: major flood risk; extreme-heat days projected 7→19/yr by 2055 (HVAC capex compounding) — expect insurance premiums to compound above CPI over the hold.
Questions for the listing agent
- Is there a deadline driving the sale (1031 exchange, divorce, estate, relocation)? That informs how much negotiation room exists.
- Crime grade is F in this area — have there been break-ins, vandalism, or insurance claims at this property in the last 3 years? What carrier currently insures it and at what premium?
- What's the average days-on-market for RENTAL listings here right now (not sales)? A rising rental-DOM trend means longer vacancies and softer asking-rent achievability than the comps imply.
- What's the recent tenant-quality profile in this submarket — average credit score on applications, eviction rate, late-payment / NSF rate, and stable-employment percentage? A property-management company in the area should have these aggregated.
- How much new for-sale + rental construction is in the pipeline within 1–3 miles? Heavy new supply typically softens prices + rents 12–24 months out; constrained supply supports both.
Investment metrics
- 1% rule
- 0.76% ✗
- Cap rate
- 6.36%
- Cash-on-cash
- 0.26%
- DSCR
- 1.01
- GRM
- 11.0
CMA / ARV
- ARV (on-the-fly)
- $352,656
- Comps found
- 12
Show comp detail 12 sales within ~0.75 mi
| Address | Dist | Beds/Ba | Sqft | Sold | Price | $/sf | Match |
|---|---|---|---|---|---|---|---|
| 204 Legacy Park Dr | 0.28mi | 4/2.0 (+1) | 2,078 (-7%) | 0mo | $400,000 | $192 | 66 |
| 117 Huston Ct | 0.37mi | 3/2.5 | 2,395 (+7%) | 17mo | $354,000 | $148 | 50 |
| 107 Legacy Pointe Cir | 0.65mi | 3/2.0 | 2,210 (-1%) | 19mo | $330,000 | $149 | 48 |
| 360 Jasmine Dr | 0.48mi | 3/2.5 | 2,416 (+8%) | 11mo | $292,000 | $121 | 48 |
| 136 Tindall Dr | 0.33mi | 4/2.5 (+1) | 2,398 (+7%) | 17mo | $349,900 | $146 | 47 |
| 103 Kinsman Cir | 0.44mi | 4/2.0 (+1) | 2,546 (+14%) | 1mo | $437,500 | $172 | 47 |
| 113 Crown Oak Ln NW | 0.64mi | 4/2.0 (+1) | 2,203 (-1%) | 15mo | $347,900 | $158 | 46 |
| 101 Angela Rd | 0.71mi | 3/4.0 | 2,277 (+2%) | 11mo | $335,000 | $147 | 42 |
| 259 Mount Zion Rd | 0.45mi | 3/2.0 | 1,960 (-12%) | 18mo | $305,000 | $156 | 40 |
| 2014 Blake Bottom Rd | 0.59mi | 3/2.5 | 2,444 (+10%) | 17mo | $400,000 | $164 | 37 |
| 204 Pearle Wood Ct | 0.57mi | 4/2.5 (+1) | 2,477 (+11%) | 20mo | $412,000 | $166 | 27 |
| 110 Misty Hollow Way | 0.63mi | 4/2.5 (+1) | 2,564 (+15%) | 16mo | $465,000 | $181 | 22 |
Match score weights: distance 35% · size 25% · config 20% · recency 20%. Top-matched comps best support the ARV.
Projected returns pro-forma
10.0% appreciation · 2.57% rent growth · sell at horizon
- IRR
- 24.3%
- Equity multiple
- 2.95×
- Total profit
- $137,802
- Equity at exit
- $227,922
- IRR
- 21.4%
- Equity multiple
- 6.69×
- Total profit
- $403,156
- Equity at exit
- $491,523
Cash invested: $70,840 (down + closing). Projections, not guarantees.
Landlord ↔ Tenant lean methodology
- Overall (STATE)
- 90 Strongly Landlord-Friendly
- State Alabama
- 90 Strongly Landlord-Friendly · R+15
- County
- — inherits STATE
- City
- — inherits STATE
ZIP-level market 35806
- Home prices YoY
- 20.0%
- Rents YoY
- 2.6%
- Active inventory
- 213
- Price-to-rent
- 11.0×
Monthly cashflow live
- Estimated rent
- $1,923 high interval (Pro) →
- Mortgage (P&I)
- −$1,327
- Tax from tax record
- −$72 /mo · $858/yr
- Insurance
- −$105
- HOA
- −$0
- Vacancy / Maint / Mgmt
- −$404
- Net cashflow
- $15
Break-even live
UW: 25.0% down · 7.5% · 30yr · 1.5% tax · 5.0% vac · 8.0% maint · 8.0% mgmt
Financing live
Cash to close
- Down payment
- $63,250
- Closing costs
- $7,590
- Reserves months
- —
- Total cash needed
- —
Loan-product check · same deal, 3 products live
Conventional
25% down · 7.5% · 30yr
- Down + closing
- —
- Monthly P&I
- —
- Monthly cashflow
- —
- DSCR
- —
- Eligible?
- —
Personal DTI + credit; lowest rate.
DSCR
20% down · 8.5% · 30yr
- Down + closing
- —
- Monthly P&I
- —
- Monthly cashflow
- —
- DSCR
- —
- Eligible?
- —
No personal income docs; deal must DSCR.
Hard money
10% down · 12.0% · 12mo
- Down + closing
- —
- Monthly P&I
- —
- Monthly cashflow
- —
- DSCR
- —
- Eligible?
- —
Short-term bridge; refi at stabilization.
Rent comps 7 comps
| Address | Beds | Baths | Sqft | Rent | $/sqft | DOM | Units | Dist |
|---|---|---|---|---|---|---|---|---|
| 228 Pumprock Dr Huntsville, AL | 3.0 | 2.0 | 1917 | $2,175 | $1.13 | 44d | 1 | 0.20mi |
| 351 Lofton Rd NW Huntsville, AL | 4.0 | 2.5 | 2186 | $2,315 | $1.06 | 14d | 1 | 1.08mi |
| 177 Sagebrook Dr Madison, AL | 3.0 | 3.0 | 1826 | $1,695 | $0.93 | 44d | 1 | 1.20mi |
| 202 Sagebrook Dr Madison, AL | 4.0 | 2.0 | 2099 | $1,750 | $0.83 | 44d | 1 | 1.26mi |
| 182 Forestbrook Dr Madison, AL | 3.0 | 2.5 | 2316 | $1,800 | $0.78 | 23d | 1 | 1.26mi |
| 409 Summer Cove Cir NW Madison, AL | 3.0 | 2.0 | 1500 | $1,795 | $1.20 | 44d | 1 | 1.31mi |
| 106 Crab Orchard Dr Madison, AL | 4.0 | 2.0 | 1675 | $1,750 | $1.04 | 44d | 1 | 1.43mi |
Listing history 10 events
-
2026-06-18days on market $253,000 Active 15 DOM
-
2026-06-17days on market $253,000 Active 14 DOM
-
2026-06-16days on market $253,000 Active 13 DOM
-
2026-06-15days on market $253,000 Active 12 DOM
-
2026-06-14days on market $253,000 Active 10 DOM
-
2026-06-10days on market $253,000 Active 7 DOM
-
2026-06-09days on market $253,000 Active 6 DOM
-
2026-06-08days on market $253,000 Active 5 DOM
-
2026-06-07remarks 602-char remark
-
2026-06-07$253,000 Active 4 DOM
ⓘ Source: listings_history table (triggers on properties + properties_extension) + one-shot
backfill from property_details.listing_events for pre-trigger history.
Tax reassessment forecast AL · Resets to sale price
- Current annual tax
- $858 · $72/mo
- Projected year-2 tax
- $1,037 · $86/mo
- Expected delta
- +$179/yr (+$15/mo · 20.9%)
ⓘ Screening estimate from a state-policy table — verify with the county assessor before closing.
Climate risk First Street
- Flood 6/10 Major FEMA zone X (unshaded) · 70% chance over 30 yrs
- Wildfire 2/10 Low
- Heat 5/10 Major 7 d/yr ≥104°F today · 19 d/yr by 30 yrs out
- Wind 4/10 Moderate 17% chance of damaging wind over 30 yrs
- Air quality 2/10 Low 0 unhealthy d/yr today · 1 by 30 yrs out
Nearby sold comps map
Loading sold comps map…
Walkable amenities ~0.75 mi
Loading nearby amenities…
Taxation est. · year 1
- Rental income
- $23,070
- − Mortgage interest
- −$14,172
- − Property taxes
- −$858
- − Insurance
- −$1,265
- − Repairs & maintenance
- −$1,846
- − Management
- −$1,846
- − Depreciation
- −$7,360
- Taxable loss
- −$4,276
- Est. tax savings @ 24.0%
- +$1,026
- After-tax cash flow
- $1,207/yr
For passive investors: Depreciation is non-cash, so a rental often shows a tax loss while cash-flowing — sheltering income. Rental losses are passive: they offset passive income freely, and up to $25,000/yr can offset ordinary (W-2) income if you actively participate and your MAGI is under $100k (phasing out to $0 by $150k); unused losses carry forward. On sale, claimed depreciation is recaptured at up to 25%, and gains may owe capital-gains tax (a 1031 exchange can defer both). Figures are a year-1 estimate at your 24.0% rate — not tax advice; consult a CPA.
Schools (NCES district)
- District
- Madison County
- NCES district ID
- 0102220
- Math proficiency
- 27% ▼ -32.00%
- Reading proficiency
- 56% ▼ -1.00%
- Median HH income
- $66,058
- Composite
- 37.15/100
- National rank
- #4483
- State rank
- #19 of 129 in AL
Livability — Huntsville
- Score
- 82/100
- State rank
- #3
- US rank
- #1082
Category grades
Schools grade is shown separately in the Schools card above.
Census & demographics
- County
- Madison County · 380,832 people
- City population
- 220,435
- Metro
- Huntsville, AL
- Population (ZIP)
- 29,161
- Household income
- $86,768
- Rent vs Own
- Severe rent burden
- 1249.0
Population outlook (Madison County) Hauer SSP2
- Today (2025)
- 392,086 people
- By 2030
- 409,788 · +4.5%
- By 2040
- 440,557 · +12.4%
- By 2050
- 460,990 · +17.6%
- By 2075
- 502,872 · +28.3%
- By 2100
- 513,623 · +31.0%
Race, ethnicity, and origin ACS 2023
- Neighborhood character
- Diverse neighborhood (Simpson 0.57)
- Race & ethnicity
- White 58% Black 30% Hispanic / Latino 5% Two or more races 5% Asian 4%
- Hispanic origin (detail)
- Mexican 2% Puerto Rican 2%
- Common ancestry
- Slovak 2% Italian 2% Serbian 2%
- Foreign-born
- 7% · Canada, Vietnam, China
- Languages at home
- 93% English-only · Spanish 2% Other Indo-European 1% Other Asian/Pacific 1%
Political lean MEDSL · Madison
- 2024 margin
- Lean R (+9.0) · D 44.7% · R 53.7% · Other 1.6%
- 2008→2024 swing
- +6.0pp toward D · 2008: -14.9pp · 2024: -9.0pp
- All cycles
- 2024: R+9.0 2020: R+8.0 2016: R+16.8 2012: R+18.7 2008: R+14.9
Not yet ingested
- Civics
- —
Market trends
- HPI YoY
- ▲ 71.67%
- Current HPI
- 430.5866
- Rent YoY
- ▲ 2.57%
- Metro
- Huntsville, AL
- State GDP YoY
- ▲ 2.94%
- F500 in state
- 4
Industry mix (Fortune 500 HQ in AL)
| Industry | F500 HQs | Revenue |
|---|---|---|
| Financial Services | 1 | $8B |
|
||
| Healthcare | 1 | $5B |
|
||
Price history
+1.2% since first listed6 events — show timeline
- 2026-06-03 Listed $253,000 VMLS
- 2021-02-11 Sold (Public Records) $255,000 Public Records
- 2021-02-05 Sold (MLS) $255,000 VMLS
- 2020-12-14 Price Changed $255,000 VMLS
- 2020-12-14 Contingent — VMLS
- 2020-11-16 Listed $250,000 VMLS
Property tax history
+8.0%/yrLatest (2024): $858 · +3.8% YoY. Source: county tax records.
Cash-flow waterfall
monthlySold comps — $/sqft
last 12 mo · ≤1 miLoading sold comps…