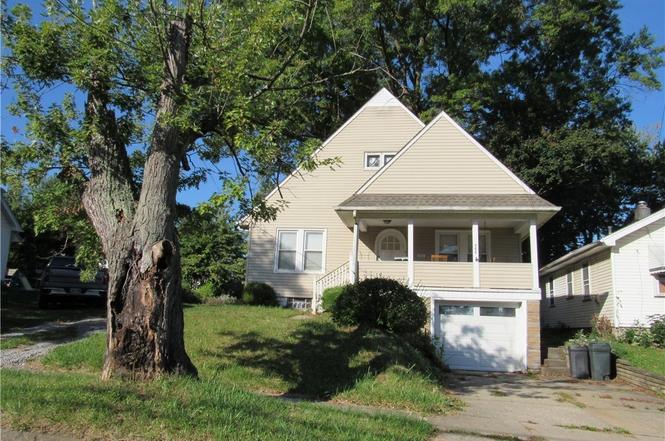
466 N Hazelwood Ave · Youngstown, OH
Flood risk 1/10 · Minimal
- FEMA flood zone
- X (unshaded)
- Chance of flooding over 30 yrs
- 0.0%
- Est. flood insurance / yr
- $473 – $860
Fire risk 1/10 · Minimal
- Est. fire insurance / yr
- $713 – $1,323
Heat risk 3/10 · Minor
- Hot days now (above 97°F)
- 7 days/yr
- Hot days in 30 yrs
- 17 days/yr
Wind risk 1/10 · Minimal
- Chance of severe wind over 30 yrs
- —
Air-quality risk 2/10 · Minimal
- Unhealthy air days now
- 1 days/yr
- Unhealthy air days in 30 yrs
- 2 days/yr
Risk factors via First Street. Map © Google.
Why this score? — see what drove the B grade
The composite is a weighted blend of 9 inputs, each scored 0–100. Each bar is that input's sub-score; the figure is the points it added to the 100-point composite (weight × sub-score).
- Cash flow +30.0/30.0
- ARV discount +15.0/15.0
- 1% rule +10.0/10.0
- DSCR +10.0/10.0
- Livability +4.0/5.0
- Rent growth +2.5/5.0
- Condition / age +2.5/5.0
- Schools +0.9/10.0
- Appreciation +0.0/10.0
$63,500
🖨 Deal sheet (PDF) 📄 Offer letter ✓ Due diligence
Listing remarks MLS
Have it your way!! What a deal. 3 bedrooms, dining room, 1 car attached garage.
Key facts
- Quiet street
- Partial basement
- Alum vinyl sided
Tags
Neighborhood map
What this means for you Summary
Snapshot
- This is a 3-bed/1.0-bath single-family listed at $64k.
Deal economics
- At list price, monthly cash flow is $342 ($4k/yr) — positive.
- The deal already cash-flows at list — no discount required.
- Meets the 1% rule at list price ($989 rent vs $64k).
- Recommended offer: $60k (6.0% below list) — sets the bar for market timing.
- Cap rate 12.8% vs local median 7.0% in Youngstown — top-decile yield for the area; either an underpriced asset or a hidden risk that comps aren't pricing in. Stress-test before assuming the spread holds.
Location & tenants
- Location reads 81/100 on livability (#99 in OH, #1,506 nationally) — a professional / high-income tenant draw. Strengths: amenities A+, commute A+, cost of living A+; Watch: crime F, employment F.
- Youngstown City (urban): math 8% / reading 17% proficiency, ranked #649 of 656 in OH (top 99%) — low school quality limits family demand, transient renter base, plan for 1-2y turnover; 88% free/reduced lunch — lower-income household profile, screen leases tightly.
- Market conditions: 66 active listings in the ZIP; 4 comparable units currently listed for rent nearby; rentals at typical pace (median 22d on market — plan ~3-4 weeks tenant-placement turnaround); lower-income renter base — watch delinquency; 147 units permitted in Mahoning County in 2024 (0 in 5+ unit buildings).
- This rent runs 33% of the median local income ($36k/yr) — at the standard rent-burdened threshold; future hikes will face affordability resistance.
Forward outlook
- Local home prices are declining (-3.0%/yr); year-one equity from $439 of loan paydown is wiped out by about $2k of value loss. Plan a longer hold.
- Mahoning County population projected at -14% by 2050 — secular population decline; favor cash flow + early exit over multi-decade hold.
- At projected returns (-3.0% appreciation + 3.0% rent growth), your $18k cash investment doubles in ~6 years — after that, you're playing with house money.
Negotiation context
- It's been on market 75 days — a 6% lower offer ($60k) is reasonable based on typical stale-listing flexibility.
- 8 sale attempts since 33y ago; this cycle's ask has dropped $6k (8%) from the opening price — seller is motivated, your offer sets the floor, not the list.
- Current owner paid $8k; list at $64k implies a 683% gain — meaningful room to come down on a strong offer.
Risks & watch-outs
- Watch-outs: built in 1926 — expect roof / HVAC / electrical / plumbing capex.
Questions for the listing agent
- It's been on market 75 days. Have you received any prior offers? Is the seller open to a 6% concession, seller financing, or rate buy-down credit?
- Built in 1926 — when were the roof, HVAC, electrical panel, plumbing, and water heater last replaced?
- Why hasn't it sold? Are there any deal-killer items the seller is aware of (foundation, flood, title, zoning, code violations)?
- Is there a deadline driving the sale (1031 exchange, divorce, estate, relocation)? That informs how much negotiation room exists.
- Crime grade is F in this area — have there been break-ins, vandalism, or insurance claims at this property in the last 3 years? What carrier currently insures it and at what premium?
- What's the average days-on-market for RENTAL listings here right now (not sales)? A rising rental-DOM trend means longer vacancies and softer asking-rent achievability than the comps imply.
- What's the recent tenant-quality profile in this submarket — average credit score on applications, eviction rate, late-payment / NSF rate, and stable-employment percentage? A property-management company in the area should have these aggregated.
- How much new for-sale + rental construction is in the pipeline within 1–3 miles? Heavy new supply typically softens prices + rents 12–24 months out; constrained supply supports both.
Investment metrics
- 1% rule
- 1.56% ✓
- Cap rate
- 12.75%
- Cash-on-cash
- 23.07%
- DSCR
- 2.03
- GRM
- 5.4
CMA / ARV
- ARV (on-the-fly)
- $90,090
- Comps found
- 12
Show comp detail 12 sales within ~0.75 mi
| Address | Dist | Beds/Ba | Sqft | Sold | Price | $/sf | Match |
|---|---|---|---|---|---|---|---|
| 466 N Hazelwood Ave | 0.00mi | 3/1.0 | 1,287 (0%) | 0mo | $48,000 | $37 | 100 |
| 459 N Schenley Ave | 0.09mi | 3/2.0 | 1,316 (+2%) | 2mo | $155,000 | $118 | 86 |
| 102 Rhoda Ave | 0.38mi | 3/2.0 | 1,270 (-1%) | 2mo | $119,500 | $94 | 75 |
| 43 N Schenley Ave | 0.35mi | 4/1.0 (+1) | 1,312 (+2%) | 2mo | $73,000 | $56 | 74 |
| 551 Moherman Ave | 0.53mi | 3/1.0 | 1,264 (-2%) | 2mo | $90,000 | $71 | 70 |
| 1220 N Schenley Ave | 0.48mi | 3/1.0 | 1,218 (-5%) | 1mo | $83,000 | $68 | 68 |
| 130 N Portland Ave | 0.68mi | 3/1.0 | 1,285 (-0%) | 3mo | $90,000 | $70 | 66 |
| 26 Bouquet Ave | 0.53mi | 3/1.5 | 1,200 (-7%) | 1mo | $92,000 | $77 | 61 |
| 208 N Maryland Ave N | 0.58mi | 3/1.0 | 1,200 (-7%) | 3mo | $28,000 | $23 | 59 |
| 125 N Belle Vis | 0.59mi | 4/1.0 (+1) | 1,368 (+6%) | 3mo | $49,000 | $36 | 55 |
| 70 S Glenellen Ave | 0.59mi | 3/1.0 | 1,144 (-11%) | 1mo | $92,500 | $81 | 53 |
| 38 S Hartford Ave | 0.53mi | 3/1.5 | 1,100 (-14%) | 4mo | $50,000 | $45 | 46 |
Match score weights: distance 35% · size 25% · config 20% · recency 20%. Top-matched comps best support the ARV.
Projected returns pro-forma
-3.0% appreciation · 3.0% rent growth · sell at horizon
- IRR
- 16.1%
- Equity multiple
- 1.65×
- Total profit
- $11,493
- Equity at exit
- $9,468
- IRR
- 24.7%
- Equity multiple
- 3.14×
- Total profit
- $38,098
- Equity at exit
- $5,490
Cash invested: $17,780 (down + closing). Projections, not guarantees.
Landlord ↔ Tenant lean methodology
- Overall (STATE)
- 73 Landlord-Friendly
- State Ohio
- 73 Landlord-Friendly · R+6
- County
- — inherits STATE
- City
- — inherits STATE
ZIP-level market 44509
- Home prices YoY
- -9.3%
- Active inventory
- 66
- Price-to-rent
- 5.4×
Monthly cashflow live
- Estimated rent
- $989 medium interval (Pro) →
- Mortgage (P&I)
- −$333
- Tax from tax record
- −$80 /mo · $957/yr
- Insurance
- −$26
- HOA
- −$0
- Vacancy / Maint / Mgmt
- −$208
- Net cashflow
- $342
Break-even live
Sensitivity live
| Price | -10% $378 | -5% $360 | +0% $342 | +5% $324 | +10% $306 |
|---|---|---|---|---|---|
| Rent | -10% $264 | -5% $303 | +0% $342 | +5% $381 | +10% $420 |
| Rate | -1.0pp $374 | -0.5pp $358 | base $342 | +0.5pp $325 | +1.0pp $309 |
UW: 25.0% down · 7.5% · 30yr · 1.5% tax · 5.0% vac · 8.0% maint · 8.0% mgmt
Financing live
Cash to close
- Down payment
- $15,875
- Closing costs
- $1,905
- Reserves months
- —
- Total cash needed
- —
Loan-product check · same deal, 3 products live
Conventional
25% down · 7.5% · 30yr
- Down + closing
- —
- Monthly P&I
- —
- Monthly cashflow
- —
- DSCR
- —
- Eligible?
- —
Personal DTI + credit; lowest rate.
DSCR
20% down · 8.5% · 30yr
- Down + closing
- —
- Monthly P&I
- —
- Monthly cashflow
- —
- DSCR
- —
- Eligible?
- —
No personal income docs; deal must DSCR.
Hard money
10% down · 12.0% · 12mo
- Down + closing
- —
- Monthly P&I
- —
- Monthly cashflow
- —
- DSCR
- —
- Eligible?
- —
Short-term bridge; refi at stabilization.
Rent comps 4 comps
| Address | Beds | Baths | Sqft | Rent | $/sqft | DOM | Units | Dist |
|---|---|---|---|---|---|---|---|---|
| 2624 Oakwood Ave Unit 2632 Youngstown, OH | 3.0 | 1.0 | 1064 | $850 | $0.80 | 22d | 1 | 0.27mi |
| 2929 Roy St Youngstown, OH | 3.0 | 1.0 | 988 | $1,100 | $1.11 | 14d | 1 | 0.57mi |
| 35 Whitney Ave N Youngstown, OH | 3.0 | 1.0 | 1144 | $1,050 | $0.92 | 22d | 1 | 1.14mi |
| 131 N Edgehill Ave Youngstown, OH | 3.0 | 1.0 | 1200 | $1,350 | $1.12 | 22d | 1 | 1.46mi |
Listing history 22 events
-
2026-04-14status Pending
-
2026-03-19historical Contingent
-
2026-03-01price $63,500
-
2026-02-17price $68,500
-
2026-01-28$69,000 Active
-
2012-01-20soldstatus $8,111 79-char remark
Show marketing remark (79 chars)
Have it your way!! What a deal. 3 bedrooms, dining room, 1 car attached garage.
-
2011-11-30$5,000 79-char remark
Show marketing remark (79 chars)
Have it your way!! What a deal. 3 bedrooms, dining room, 1 car attached garage.
-
2006-08-25soldstatus $68,000
-
2006-03-29soldstatus $30,000 80-char remark
Show marketing remark (80 chars)
Starter home at an affordable price. Property can be bid on @ WWW. REALTYBID.com
-
2006-02-28historical 80-char remark
Show marketing remark (80 chars)
Starter home at an affordable price. Property can be bid on @ WWW. REALTYBID.com
-
2005-12-20$32,900 80-char remark
Show marketing remark (80 chars)
Starter home at an affordable price. Property can be bid on @ WWW. REALTYBID.com
-
2005-11-23historical
-
2005-08-25$34,900
-
2002-12-20soldstatus $42,000
-
2002-12-19soldstatus $42,000
-
2002-11-01$45,000
-
1996-09-28historical
-
1996-07-28$49,900
-
1993-11-18historical
-
1993-10-15soldstatus $40,000
-
1993-07-18$41,900
-
1993-07-18$41,900
ⓘ Source: listings_history table (triggers on properties + properties_extension) + one-shot
backfill from property_details.listing_events for pre-trigger history.
Tax reassessment forecast OH · Partial reset (capped growth)
- Current annual tax
- $957 · $80/mo
- Projected year-2 tax
- $974 · $81/mo
- Expected delta
- +$17/yr (+$1/mo · 1.8%)
ⓘ Screening estimate from a state-policy table — verify with the county assessor before closing.
Climate risk First Street
- Flood 1/10 Low FEMA zone X (unshaded) · 0% chance over 30 yrs
- Wildfire 1/10 Low
- Heat 3/10 Moderate 7 d/yr ≥97°F today · 17 d/yr by 30 yrs out
- Wind 1/10 Low
- Air quality 2/10 Low 1 unhealthy d/yr today · 2 by 30 yrs out
Nearby sold comps map
Loading sold comps map…
Walkable amenities ~0.75 mi
Loading nearby amenities…
Taxation est. · year 1
- Rental income
- $11,862
- − Mortgage interest
- −$3,557
- − Property taxes
- −$957
- − Insurance
- −$318
- − Repairs & maintenance
- −$949
- − Management
- −$949
- − Depreciation
- −$1,847
- Taxable income
- $3,286
- Est. tax owed @ 24.0%
- −$789
- After-tax cash flow
- $3,313/yr
For passive investors: Depreciation is non-cash, so a rental often shows a tax loss while cash-flowing — sheltering income. Rental losses are passive: they offset passive income freely, and up to $25,000/yr can offset ordinary (W-2) income if you actively participate and your MAGI is under $100k (phasing out to $0 by $150k); unused losses carry forward. On sale, claimed depreciation is recaptured at up to 25%, and gains may owe capital-gains tax (a 1031 exchange can defer both). Figures are a year-1 estimate at your 24.0% rate — not tax advice; consult a CPA.
Schools (NCES district)
- District
- Youngstown City
- NCES district ID
- 3904516
- Math proficiency
- 8% ▼ -15.00%
- Reading proficiency
- 17% ▼ -10.00%
- Median HH income
- $25,257
- Composite
- 9.29/100
- National rank
- #9858
- State rank
- #649 of 656 in OH
Livability — Youngstown
- Score
- 81/100
- State rank
- #99
- US rank
- #1506
Category grades
Schools grade is shown separately in the Schools card above.
Census & demographics
- Census place
- Youngstown, OH
- County
- Mahoning · 224,175 people
- City population
- 28,503
- Metro
- Youngstown-Warren, OH
- Population (ZIP)
- 10,775
- Household income
- $36,472
- Rent vs Own
- Severe rent burden
- 10.4
Population outlook (Mahoning County) Hauer SSP2
- Today (2025)
- 223,932 people
- By 2030
- 218,387 · -2.5%
- By 2040
- 205,367 · -8.3%
- By 2050
- 193,606 · -13.5%
- By 2075
- 173,694 · -22.4%
- By 2100
- 151,147 · -32.5%
Race, ethnicity, and origin ACS 2023
- Neighborhood character
- Diverse neighborhood (Simpson 0.58)
- Race & ethnicity
- White 58% Black 27% Hispanic / Latino 9% Two or more races 8%
- Hispanic origin (detail)
- Puerto Rican 4%
- Common ancestry
- Slovak 2% Subsaharan African 2% Romanian 2%
- Foreign-born
- 3% · Canada
- Languages at home
- 93% English-only · Spanish 5%
Political lean MEDSL · Mahoning
- 2024 margin
- Lean R (+9.4) · D 44.9% · R 54.4%
- 2008→2024 swing
- -36.1pp toward R · 2008: 26.6pp · 2024: -9.4pp
- All cycles
- 2024: R+9.4 2020: R+1.9 2016: D+3.0 2012: D+27.7 2008: D+26.6
Not yet ingested
- Civics
- —
Market trends
- HPI YoY
- ▼ -22.34%
- Current HPI
- 217.0797
- Rent YoY
- —
- Metro
- —
- State GDP YoY
- ▲ 1.98%
- F500 in state
- 48
Industry mix (Fortune 500 HQ in OH)
| Industry | F500 HQs | Revenue |
|---|---|---|
| Insurance | 3 | $145B |
|
||
| Industrial Machinery | 3 | $49B |
|
||
| Financial Services | 3 | $24B |
|
||
| Consumer Goods | 2 | $93B |
|
||
| Aerospace / Defense | 2 | $47B |
|
||
| Utilities | 2 | $33B |
|
||
Price history
+51.6% since first listed22 events — show timeline
- 2026-04-14 Pending — MLSNOW
- 2026-03-19 Contingent — MLSNOW
- 2026-03-01 Price Changed $63,500 MLSNOW
- 2026-02-17 Price Changed $68,500 MLSNOW
- 2026-01-28 Listed $69,000 MLSNOW
- 2012-01-20 Sold (MLS) $8,111 MLSNOW
- 2011-11-30 Listed $5,000 MLSNOW
- 2006-08-25 Sold (Public Records) $68,000 Public Records
- 2006-03-29 Sold (MLS) $30,000 MLSNOW
- 2006-02-28 Listing Removed — MLSNOW
- 2005-12-20 Listed $32,900 MLSNOW
- 2005-11-23 Listing Removed — MLSNOW
- 2005-08-25 Listed $34,900 MLSNOW
- 2002-12-20 Sold (MLS) $42,000 MLSNOW
- 2002-12-19 Sold (Public Records) $42,000 Public Records
- 2002-11-01 Listed $45,000 MLSNOW
- 1996-09-28 Listing Removed — MLSNOW
- 1996-07-28 Listed $49,900 MLSNOW
- 1993-11-18 Listing Removed — MLSNOW
- 1993-10-15 Sold (Public Records) $40,000 Public Records
- 1993-07-18 Listed $41,900 MLSNOW
- 1993-07-18 Listed $41,900 MLSNOW
Property tax history
+6.6%/yrLatest (2025): $957 · +4.5% YoY. Source: county tax records.
Cash-flow waterfall
monthlySold comps — $/sqft
last 12 mo · ≤1 miLoading sold comps…