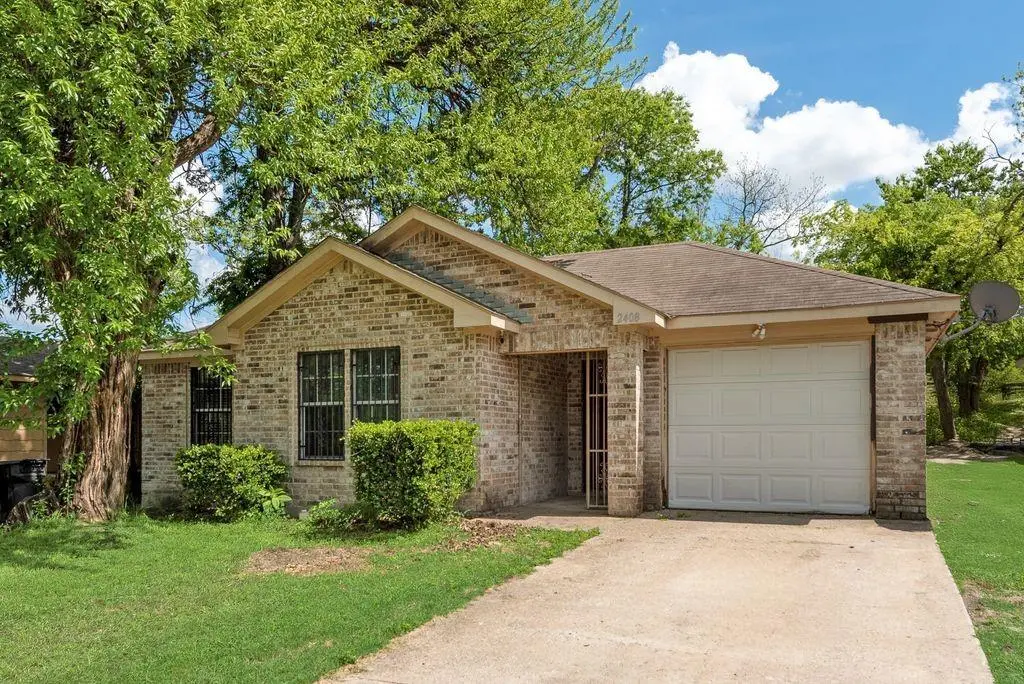
2408 Oak Dale Rd · Dallas, TX
Flood risk 1/10 · Minimal
- FEMA flood zone
- X (unshaded)
- Chance of flooding over 30 yrs
- 0.0%
- Est. flood insurance / yr
- $507 – $1,088
Fire risk 3/10 · Minor
- Est. fire insurance / yr
- $1,222 – $2,270
Heat risk 7/10 · Major
- Hot days now (above 110°F)
- 7 days/yr
- Hot days in 30 yrs
- 23 days/yr
Wind risk 6/10 · Moderate
- Chance of severe wind over 30 yrs
- 27.0%
Air-quality risk 2/10 · Minimal
- Unhealthy air days now
- 1 days/yr
- Unhealthy air days in 30 yrs
- 2 days/yr
Risk factors via First Street. Map © Google.
Why this score? — see what drove the D- grade
The composite is a weighted blend of 9 inputs, each scored 0–100. Each bar is that input's sub-score; the figure is the points it added to the 100-point composite (weight × sub-score).
- ARV discount +15.0/15.0
- Cash flow +7.9/30.0
- Livability +4.0/5.0
- 1% rule +2.9/10.0
- Schools +2.8/10.0
- Condition / age +2.5/5.0
- DSCR +2.0/10.0
- Rent growth +1.8/5.0
- Appreciation +0.0/10.0
$257,900
🖨 Deal sheet 📄 Offer letter ✓ Due diligence
Listing remarks MLS
Great starter home for a small family, nice sized Primary Bedroom, Open Floor Plan, Backyard has Space for cookouts, you can’t beat this price come tour it before you’re to late !!!!!!
Key facts
- Open floor plan
- 6,142 sq ft lot
- Garage
Tags
Neighborhood map
What this means for you Summary
Snapshot
- This is a 4-bed/2.0-bath single-family listed at $258k.
Deal economics
- At list price, monthly cash flow is $-276 ($-3k/yr) — negative.
- To cash-flow at today's rent, offer at most $209k (18.9% below list).
- To meet the 1% rule (rent ≥ 1% of price), the offer needs to be $205k (20.7% below list).
- Recommended offer: $205k (20.7% below list) — sets the bar for 1% rule.
- Cap rate 5.0% vs local median 2.3% in Dallas — top-decile yield for the area; either an underpriced asset or a hidden risk that comps aren't pricing in. Stress-test before assuming the spread holds.
Location & tenants
- Location reads 81/100 on livability (#24 in TX, #1,380 nationally) — a professional / high-income tenant draw. Strengths: amenities A+, commute A+, housing A+; Watch: schools C-, crime F.
- Dallas ISD (urban): math 31% / reading 36% proficiency, ranked #559 of 826 in TX (top 68%) — families likely to look elsewhere, expect single-tenant / working-renter base with shorter leases; 83% free/reduced lunch — lower-income household profile, screen leases tightly.
- Market conditions: Rents soft (-2.8%/yr); 207 active listings in the ZIP; 36 comparable units currently listed for rent nearby; rentals leasing fast (median 8d on market — plan ~1-2 weeks tenant-placement turnaround); 12,577 units permitted in Dallas County in 2024 (6,829 in 5+ unit buildings).
- At $2,046/mo this rent would consume 45% of the median local household income ($54k/yr) (locally 1076% of renters already pay >50% of income on rent) — very limited rent-growth headroom before tenants either downsize or default.
Forward outlook
- Local home prices are declining (-3.0%/yr); year-one equity from $2k of loan paydown is wiped out by about $8k of value loss. Plan a longer hold.
- Dallas County population projected at +35% by 2050 — long-run rental-demand tailwind backs the buy-and-hold thesis.
Negotiation context
- It's been on market 58 days — a 3% lower offer ($250k) is reasonable based on typical stale-listing flexibility.
- 2 sale attempts since 20y ago with the ask held roughly flat each time — persistent listings suggest the price (not the market) is what's stuck; bring a comps-based counter.
Risks & watch-outs
- Climate carrying-cost: major wind risk, 27% chance of damaging wind over 30y; extreme-heat days projected 7→23/yr by 2055 (HVAC capex compounding) — expect insurance premiums to compound above CPI over the hold.
Questions for the listing agent
- What do current leases actually rent for vs. the listed asking? Can we see a recent rent roll and the last 12 months of T-12 income?
- It's been on market 58 days. Have you received any prior offers? Is the seller open to a 21% concession, seller financing, or rate buy-down credit?
- Is there a deadline driving the sale (1031 exchange, divorce, estate, relocation)? That informs how much negotiation room exists.
- Crime grade is F in this area — have there been break-ins, vandalism, or insurance claims at this property in the last 3 years? What carrier currently insures it and at what premium?
- The area grade is low — what's the realistic commute time and amenity access for the typical tenant pool here? Any planned neighborhood developments (good or bad) we should know about?
- What's the average days-on-market for RENTAL listings here right now (not sales)? A rising rental-DOM trend means longer vacancies and softer asking-rent achievability than the comps imply.
- What's the recent tenant-quality profile in this submarket — average credit score on applications, eviction rate, late-payment / NSF rate, and stable-employment percentage? A property-management company in the area should have these aggregated.
- How much new for-sale + rental construction is in the pipeline within 1–3 miles? Heavy new supply typically softens prices + rents 12–24 months out; constrained supply supports both.
Investment metrics
- 1% rule
- 0.79% ✗
- Cap rate
- 5.01%
- Cash-on-cash
- -4.59%
- DSCR
- 0.80
- GRM
- 10.5
CMA / ARV
- ARV (median comp)
- $318,664
- List price
- $257,900
- Delta
- -19.07%
- Verdict
- UNDERPRICED
- Comps
- 20 within 1.0 mi
Show comp detail 12 sales within ~0.75 mi
| Address | Dist | Beds/Ba | Sqft | Sold | Price | $/sf | Match |
|---|---|---|---|---|---|---|---|
| 2708 Kool Ave | 0.26mi | 3/2.0 (-1) | 1,395 (+2%) | 5mo | $239,000 | $171 | 75 |
| 6055 Plum Dale Rd | 0.36mi | 3/2.0 (-1) | 1,395 (+2%) | 11mo | $239,000 | $171 | 65 |
| 6129 Kemrock Dr | 0.39mi | 3/2.0 (-1) | 1,450 (+6%) | 10mo | $239,000 | $165 | 58 |
| 2503 Lyola St | 0.42mi | 3/2.0 (-1) | 1,216 (-11%) | 5mo | $164,900 | $136 | 53 |
| 2315 Fatima Ave | 0.28mi | 3/2.0 (-1) | 1,558 (+14%) | 11mo | $239,000 | $153 | 50 |
| 1742 E Red Bird Ln | 0.75mi | 3/2.0 (-1) | 1,422 (+4%) | 6mo | $199,000 | $140 | 48 |
| 2959 Simpson Stuart Rd | 0.73mi | 3/2.0 (-1) | 1,298 (-5%) | 9mo | $260,000 | $200 | 45 |
| 6059 Plum Dale Rd | 0.36mi | 3/2.0 (-1) | 1,558 (+14%) | 12mo | $239,000 | $153 | 44 |
| 2963 Simpson Stuart Rd | 0.73mi | 3/2.0 (-1) | 1,298 (-5%) | 12mo | $260,000 | $200 | 42 |
| 2363 Talco Dr | 0.60mi | 4/2.0 | 1,170 (-14%) | 12mo | $175,000 | $150 | 38 |
| 6437 Leana Ave | 0.60mi | 3/1.0 (-1) | 1,164 (-15%) | 1mo | $209,900 | $180 | 37 |
| 2962 Kavasar Dr | 0.71mi | 3/2.0 (-1) | 1,558 (+14%) | 5mo | $239,000 | $153 | 35 |
Match score weights: distance 35% · size 25% · config 20% · recency 20%. Top-matched comps best support the ARV.
Projected returns pro-forma
-3.0% appreciation · 0.0% rent growth · sell at horizon
- IRR
- -27.7%
- Equity multiple
- 0.10×
- Total profit
- $-65,270
- Equity at exit
- $38,454
- IRR
- -43.8%
- Equity multiple
- -0.42×
- Total profit
- $-102,249
- Equity at exit
- $22,298
Cash invested: $72,212 (down + closing). Projections, not guarantees.
Landlord ↔ Tenant lean methodology
- Overall (STATE)
- 87 Strongly Landlord-Friendly
- State Texas
- 87 Strongly Landlord-Friendly · R+5
- County
- — inherits STATE
- City
- — inherits STATE
ZIP-level market 75241
- Home prices YoY
- -16.9%
- Rents YoY
- -2.8%
- Active inventory
- 207
- Price-to-rent
- 10.5×
Monthly cashflow live
- Estimated rent
- $2,046 high interval (Pro) →
- Mortgage (P&I)
- −$1,352
- Tax from tax record
- −$433 /mo · $5,191/yr
- Insurance
- −$107
- HOA
- −$0
- Vacancy / Maint / Mgmt
- −$430
- Net cashflow
- $-276
Break-even live
UW: 25.0% down · 7.5% · 30yr · 1.5% tax · 5.0% vac · 8.0% maint · 8.0% mgmt
Financing live
Cash to close
- Down payment
- $64,475
- Closing costs
- $7,737
- Reserves months
- —
- Total cash needed
- —
Loan-product check · same deal, 3 products live
Conventional
25% down · 7.5% · 30yr
- Down + closing
- —
- Monthly P&I
- —
- Monthly cashflow
- —
- DSCR
- —
- Eligible?
- —
Personal DTI + credit; lowest rate.
DSCR
20% down · 8.5% · 30yr
- Down + closing
- —
- Monthly P&I
- —
- Monthly cashflow
- —
- DSCR
- —
- Eligible?
- —
No personal income docs; deal must DSCR.
Hard money
10% down · 12.0% · 12mo
- Down + closing
- —
- Monthly P&I
- —
- Monthly cashflow
- —
- DSCR
- —
- Eligible?
- —
Short-term bridge; refi at stabilization.
Rent comps 36 comps
| Address | Beds | Baths | Sqft | Rent | $/sqft | DOM | Units | Dist |
|---|---|---|---|---|---|---|---|---|
| 2520 Fatima Ave Dallas, TX | 3.0 | 2.0 | 1176 | $1,950 | $1.66 | 7d | 1 | 0.07mi |
| 2602 Ripple Rd Dallas, TX | 3.0 | 2.0 | 1232 | $1,700 | $1.38 | 43d | 1 | 0.21mi |
| 2703 Kool Ave Dallas, TX | 3.0 | 2.0 | 1248 | $1,700 | $1.36 | 24d | 1 | 0.22mi |
| 2809 Gooch St Dallas, TX | 4.0 | 2.0 | 1816 | $2,650 | $1.46 | 7d | 1 | 0.33mi |
| 2842 Pall Mall Ave Dallas, TX | 4.0 | 2.0 | 1584 | $2,095 | $1.32 | 24d | 1 | 0.37mi |
| 2525 Lyola St Dallas, TX | 3.0 | 2.0 | 1080 | $1,895 | $1.75 | 43d | 1 | 0.43mi |
| 3131 Simpson Stuart Rd Dallas, TX | 1.0–3.0 | 1.0–2.0 | 1024 | $1,694 | $1.65 | 3d | 33 | 0.72mi |
| 5828 Lazy River Dr Dallas, TX | 3.0 | 1.5 | 1134 | $1,600 | $1.41 | 44d | 1 | 0.72mi |
| 5761 Highland Hills Dr Dallas, TX | 1.0–3.0 | 1.0–2.0 | 1040 | $1,749 | $1.68 | 3d | 7 | 0.74mi |
| 1754 E Red Bird Ln Dallas, TX | 3.0 | 1.5 | 1115 | $1,675 | $1.50 | 7d | 1 | 0.74mi |
| 5724 Lazy River Cir Dallas, TX | 4.0 | 2.0 | 1863 | $4,000 | $2.15 | 1d | 1 | 0.82mi |
| 6152 Balcony Ln Dallas, TX | 4.0 | 2.5 | 1670 | $1,800 | $1.08 | 17d | 1 | 0.87mi |
| 1706 Caravan Trl Dallas, TX | 3.0 | 2.0 | 1263 | $1,700 | $1.35 | 24d | 1 | 0.87mi |
| 5850 Highland Hills Dr Dallas, TX | 2.0–4.0 | 1.0–2.0 | 910 | $1,286 | $1.41 | 2d | 9 | 0.88mi |
| 5722 Old Ox Rd Dallas, TX | 3.0 | 2.0 | 1464 | $2,200 | $1.50 | 7d | 1 | 0.91mi |
| 5821 Bonnie View Rd Dallas, TX | 1.0–3.0 | 1.0–2.0 | 820 | $1,101 | $1.34 | 7d | 7 | 0.97mi |
| 5160 Cardiff St Dallas, TX | 4.0 | 2.0 | 1251 | $1,950 | $1.56 | 3d | 1 | 1.01mi |
| 5175 Cardiff St Dallas, TX | 3.0 | 1.0 | 1248 | $1,650 | $1.32 | 43d | 1 | 1.02mi |
| 4934 Kildare Ave Dallas, TX | 3.0 | 2.0 | 1118 | $1,595 | $1.43 | 24d | 1 | 1.04mi |
| 3440 Simpson Stuart Rd Dallas, TX | 1.0–3.0 | 1.0–2.0 | 942 | $2,103 | $2.23 | 1d | 9 | 1.06mi |
| 2228 52nd St Dallas, TX | 4.0 | 3.0 | 1730 | $2,300 | $1.33 | 7d | 1 | 1.08mi |
| 1435 Whispering Trl Dallas, TX | 3.0 | 1.0 | 1047 | $1,660 | $1.59 | 7d | 1 | 1.11mi |
| 3210 Little River Dr Dallas, TX | 3.0 | 2.0 | 1202 | $1,950 | $1.62 | 3d | 1 | 1.11mi |
| 6327 Hidden Trail Dr Dallas, TX | 3.0 | 2.0 | 1187 | $1,795 | $1.51 | 43d | 1 | 1.17mi |
| 3528 Keyridge Dr Dallas, TX | 3.0 | 2.0 | 1362 | $1,795 | $1.32 | 20d | 1 | 1.20mi |
| 3806 Castle Hills Dr Dallas, TX | 4.0 | 2.0 | 1422 | $1,900 | $1.34 | 16d | 1 | 1.21mi |
| 3015 Flask Dr Dallas, TX | 3.0 | 2.0 | 1267 | $1,875 | $1.48 | 43d | 1 | 1.23mi |
| 2751 E Ledbetter Dr Dallas, TX | 1.0–3.0 | 1.0–1.5 | 794 | $1,410 | $1.78 | 43d | 3 | 1.25mi |
| 3835 Basswood Dr Dallas, TX | 3.0 | 2.0 | 1000 | $1,625 | $1.62 | 24d | 1 | 1.28mi |
| 6436 Moonhill Dr Dallas, TX | 4.0 | 2.0 | 1200 | $1,961 | $1.63 | 1d | 1 | 1.31mi |
| 3623 Softcloud Dr Dallas, TX | 3.0 | 2.0 | 1477 | $1,910 | $1.29 | 43d | 1 | 1.32mi |
| 1441 Quartet Dr Dallas, TX | 3.0 | 2.0 | 1319 | $1,700 | $1.29 | 4d | 1 | 1.33mi |
| 7312 Sierra Way Dallas, TX | 3.0 | 2.0 | 1439 | $1,900 | $1.32 | 1d | 1 | 1.33mi |
| 6520 Warm Moon Ln Dallas, TX | 4.0 | 2.0 | 1237 | $1,995 | $1.61 | 3d | 1 | 1.34mi |
| 2919 N El Centro Way Dallas, TX | 4.0 | 2.0 | 1294 | $1,800 | $1.39 | 7d | 1 | 1.41mi |
| 6115 Flagstaff Dr Dallas, TX | 3.0 | 1.5 | 1522 | $1,696 | $1.11 | 7d | 1 | 1.49mi |
Listing history 19 events
-
2026-06-18days on market $257,900 Active 58 DOM
-
2026-06-17days on market $257,900 Active 57 DOM
-
2026-06-16days on market $257,900 Active 56 DOM
-
2026-06-15days on market $257,900 Active 55 DOM
-
2026-06-13days on market $257,900 Active 53 DOM
-
2026-06-09days on market $257,900 Active 49 DOM
-
2026-06-08days on market $257,900 Active 48 DOM
-
2026-06-07days on market $257,900 Active 47 DOM
-
2026-06-04days on market $257,900 Active 44 DOM
-
2026-06-03days on market $257,900 Active 43 DOM
-
2026-06-02days on market $257,900 Active 42 DOM
-
2026-06-01days on market $257,900 Active 41 DOM
-
2026-05-31days on market $257,900 Active 40 DOM
-
2026-04-21$257,900 Active 196-char remark
Show marketing remark (196 chars)
Great starter home for a small family, nice sized Primary Bedroom, Open Floor Plan, Backyard has Space for cookouts, you can’t beat this price come tour it before you’re to late !!!!!!
-
2023-02-06soldstatus
-
2022-06-07soldstatus
-
2006-12-14soldstatus
-
2006-11-04historical
-
2006-10-27$7,500
ⓘ Source: listings_history table (triggers on properties + properties_extension) + one-shot
backfill from property_details.listing_events for pre-trigger history.
Tax reassessment forecast TX · Resets to sale price
- Current annual tax
- $5,191 · $433/mo
- Projected year-2 tax
- $5,191 · $433/mo
- Expected delta
- $0/yr ($0/mo · 0.0%)
ⓘ Screening estimate from a state-policy table — verify with the county assessor before closing.
Climate risk First Street
- Flood 1/10 Low FEMA zone X (unshaded) · 0% chance over 30 yrs
- Wildfire 3/10 Moderate
- Heat 7/10 Severe 7 d/yr ≥110°F today · 23 d/yr by 30 yrs out
- Wind 6/10 Major 27% chance of damaging wind over 30 yrs
- Air quality 2/10 Low 1 unhealthy d/yr today · 2 by 30 yrs out
Nearby sold comps map
Loading sold comps map…
Walkable amenities ~0.75 mi
Loading nearby amenities…
Taxation est. · year 1
- Rental income
- $24,554
- − Mortgage interest
- −$14,446
- − Property taxes
- −$5,191
- − Insurance
- −$1,290
- − Repairs & maintenance
- −$1,964
- − Management
- −$1,964
- − Depreciation
- −$7,503
- Taxable loss
- −$7,804
- Est. tax savings @ 24.0%
- +$1,873
- After-tax cash flow
- $-1,439/yr
For passive investors: Depreciation is non-cash, so a rental often shows a tax loss while cash-flowing — sheltering income. Rental losses are passive: they offset passive income freely, and up to $25,000/yr can offset ordinary (W-2) income if you actively participate and your MAGI is under $100k (phasing out to $0 by $150k); unused losses carry forward. On sale, claimed depreciation is recaptured at up to 25%, and gains may owe capital-gains tax (a 1031 exchange can defer both). Figures are a year-1 estimate at your 24.0% rate — not tax advice; consult a CPA.
Schools (NCES district)
- District
- Dallas ISD
- NCES district ID
- 4816230
- Math proficiency
- 31% ▼ -16.00%
- Reading proficiency
- 36% ▼ -4.00%
- Median HH income
- $42,881
- Composite
- 28.41/100
- National rank
- #6763
- State rank
- #559 of 826 in TX
Livability — Dallas
- Score
- 81/100
- State rank
- #24
- US rank
- #1380
Category grades
Schools grade is shown separately in the Schools card above.
Census & demographics
- Census place
- Dallas, TX
- County
- Dallas County · 2,612,404 people
- City population
- 1,168,437
- Metro
- Dallas-Fort Worth-Arlington, TX
- Population (ZIP)
- 33,840
- Household income
- $53,998
- Rent vs Own
- Severe rent burden
- 1076.0
Population outlook (Dallas County) Hauer SSP2
- Today (2025)
- 2,979,839 people
- By 2030
- 3,191,823 · +7.1%
- By 2040
- 3,619,611 · +21.5%
- By 2050
- 4,026,915 · +35.1%
- By 2075
- 4,957,073 · +66.4%
- By 2100
- 5,508,725 · +84.9%
Race, ethnicity, and origin ACS 2023
- Neighborhood character
- Majority Black (62%)
- Race & ethnicity
- Black 62% Hispanic / Latino 30% Two or more races 8% White 5% Native American 2%
- Hispanic origin (detail)
- Mexican 24%
- Foreign-born
- 13% · Canada
- Languages at home
- 73% English-only · Spanish 25%
Political lean MEDSL · Dallas
- 2024 margin
- Strong D (+22.2) · D 60.2% · R 38.0% · Other 1.8%
- 2008→2024 swing
- +6.9pp toward D · 2008: 15.3pp · 2024: 22.2pp
- All cycles
- 2024: D+22.2 2020: D+31.6 2016: D+26.2 2012: D+15.4 2008: D+15.3
Not yet ingested
- Civics
- —
Market trends
- HPI YoY
- ▼ -72.36%
- Current HPI
- 356.2348
- Rent YoY
- ▼ -2.75%
- Metro
- Dallas-Fort Worth-Arlington, TX
- State GDP YoY
- ▲ 3.95%
- F500 in state
- 110
Industry mix (Fortune 500 HQ in TX)
| Industry | F500 HQs | Revenue |
|---|---|---|
| Energy | 16 | $1,198B |
|
||
| Technology | 5 | $198B |
|
||
| Engineering / Construction | 4 | $72B |
|
||
| Energy Services | 3 | $60B |
|
||
| Utilities | 3 | $41B |
|
||
| Healthcare | 2 | $330B |
|
||
Price history
+3338.7% since first listed6 events — show timeline
- 2026-04-21 Listed $257,900 NTREIS
- 2023-02-06 Sold (Public Records) — Public Records
- 2022-06-07 Sold (Public Records) — Public Records
- 2006-12-14 Sold (Public Records) — Public Records
- 2006-11-04 Listing Removed — NTREIS
- 2006-10-27 Listed $7,500 NTREIS
Property tax history
+8.2%/yrLatest (2025): $5,191 · -2.3% YoY. Source: county tax records.
Cash-flow waterfall
monthlySold comps — $/sqft
last 12 mo · ≤1 miLoading sold comps…