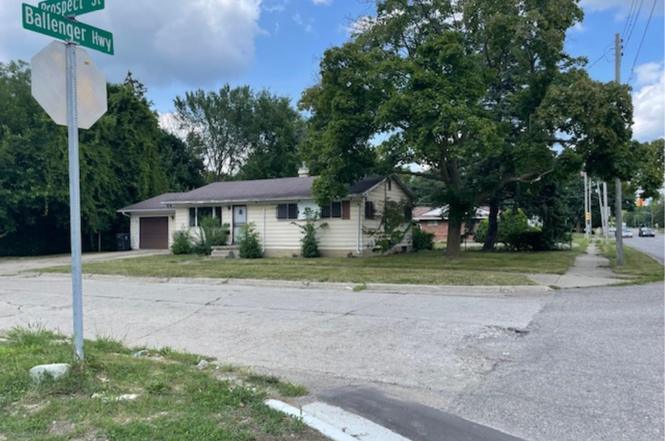
2902 Prospect St · Flint, MI
Flood risk 1/10 · Minimal
- FEMA flood zone
- X (unshaded)
- Chance of flooding over 30 yrs
- 0.0%
- Est. flood insurance / yr
- $507 – $1,088
Fire risk 1/10 · Minimal
- Est. fire insurance / yr
- $784 – $1,456
Heat risk 2/10 · Minimal
- Hot days now (above 96°F)
- 7 days/yr
- Hot days in 30 yrs
- 15 days/yr
Wind risk 2/10 · Minimal
- Chance of severe wind over 30 yrs
- —
Air-quality risk 3/10 · Minor
- Unhealthy air days now
- 3 days/yr
- Unhealthy air days in 30 yrs
- 4 days/yr
Risk factors via First Street. Map © Google.
Why this score? — see what drove the B grade
The composite is a weighted blend of 9 inputs, each scored 0–100. Each bar is that input's sub-score; the figure is the points it added to the 100-point composite (weight × sub-score).
- Cash flow +30.0/30.0
- ARV discount +15.0/15.0
- 1% rule +10.0/10.0
- DSCR +10.0/10.0
- Livability +3.7/5.0
- Rent growth +2.5/5.0
- Condition / age +2.5/5.0
- Schools +1.1/10.0
- Appreciation +0.0/10.0
$27,000
🖨 Deal sheet (PDF) 📄 Offer letter ✓ Due diligence
Listing remarks MLS
This home features 3 bedrooms and spacious living room with hardwood flooring throughout. bathroom needs repair. Home has an attached garage and breezeway area. Send your offer today. All offfers must have subject to probate approval. Home needs some TLC. All offers are Subject to Probate approval. Priced for quick sale.
Key facts
- 4,792 sq ft lot
- Garage
- Built 1969
Neighborhood map
What this means for you Summary
Snapshot
- This is a 3-bed/1.0-bath single-family listed at $27k.
Deal economics
- At list price, monthly cash flow is $530 ($6k/yr) — positive.
- The deal already cash-flows at list — no discount required.
- Meets the 1% rule at list price ($934 rent vs $27k).
- Cap rate 29.8% vs local median 11.5% in Flint — top-decile yield for the area; either an underpriced asset or a hidden risk that comps aren't pricing in. Stress-test before assuming the spread holds.
Location & tenants
- Location reads 74/100 on livability (#196 in MI, #4,946 nationally) — a middle-class / working-renter tenant base. Strengths: commute A+, cost of living A+, housing A+; Watch: crime F, employment F.
- Flint School District (urban): math 7% / reading 13% proficiency, ranked #714 of 760 in MI (top 94%) — low school quality limits family demand, transient renter base, plan for 1-2y turnover; 83% free/reduced lunch — lower-income household profile, screen leases tightly.
- Zoned schools: Holmes Stem Middle School Academy (math 10% / reading 30%, grade F, #420 of 493 statewide, top 86%, 324 students, 90% FRL).
- Market conditions: 132 active listings in the ZIP; 12 comparable units currently listed for rent nearby; rentals lingering (median 46d on market — plan ~5-8 weeks vacancy on turnover, expect pricing pressure); 58% of comp listings sitting > 30 days — soft ceiling on asking rent; 419 units permitted in Genesee County in 2024 (68 in 5+ unit buildings).
Forward outlook
- Local home prices are declining (-3.0%/yr); year-one equity from $187 of loan paydown is wiped out by about $810 of value loss. Plan a longer hold.
- Genesee County population projected at -27% by 2050 — secular population decline; favor cash flow + early exit over multi-decade hold.
- At projected returns (-3.0% appreciation + 3.0% rent growth), your $8k cash investment doubles in ~2 years — after that, you're playing with house money.
Negotiation context
- Only 3 days on market — expect competitive offers; lowballing is unlikely to land.
- 2 sale attempts with the ask held roughly flat each time — persistent listings suggest the price (not the market) is what's stuck; bring a comps-based counter.
Questions for the listing agent
- Built in 1969 — when were the roof, HVAC, electrical panel, plumbing, and water heater last replaced?
- Is there a deadline driving the sale (1031 exchange, divorce, estate, relocation)? That informs how much negotiation room exists.
- Schools are F-rated, which usually means shorter tenancies and higher turnover. Who's the typical renter profile here, and what's been the actual vacancy rate?
- Crime grade is F in this area — have there been break-ins, vandalism, or insurance claims at this property in the last 3 years? What carrier currently insures it and at what premium?
- What's the average days-on-market for RENTAL listings here right now (not sales)? A rising rental-DOM trend means longer vacancies and softer asking-rent achievability than the comps imply.
- What's the recent tenant-quality profile in this submarket — average credit score on applications, eviction rate, late-payment / NSF rate, and stable-employment percentage? A property-management company in the area should have these aggregated.
- How much new for-sale + rental construction is in the pipeline within 1–3 miles? Heavy new supply typically softens prices + rents 12–24 months out; constrained supply supports both.
Investment metrics
- 1% rule
- 3.46% ✓
- Cap rate
- 29.83%
- Cash-on-cash
- 84.06%
- DSCR
- 4.74
- GRM
- 2.4
CMA / ARV
- ARV (on-the-fly)
- $44,064
- Comps found
- 12
Show comp detail 12 sales within ~0.75 mi
| Address | Dist | Beds/Ba | Sqft | Sold | Price | $/sf | Match |
|---|---|---|---|---|---|---|---|
| 2622 Concord St | 0.34mi | 3/1.0 | 939 (+2%) | 1mo | $7,000 | $7 | 80 |
| 1271 Donaldson Blvd | 0.48mi | 3/1.0 | 926 (+1%) | 0mo | $126,500 | $137 | 76 |
| 2915 Berkley St | 0.18mi | 2/1.0 (-1) | 987 (+8%) | 4mo | $27,500 | $28 | 71 |
| 2930 Prospect St | 0.12mi | 3/1.0 | 808 (-12%) | 6mo | $17,900 | $22 | 69 |
| 2602 Sloan St | 0.50mi | 3/1.0 | 955 (+4%) | 2mo | $25,000 | $26 | 68 |
| 2331 Welch Blvd | 0.58mi | 3/1.0 | 912 (-1%) | 7mo | $69,900 | $77 | 66 |
| 1457 Mitson Blvd | 0.65mi | 3/1.0 | 900 (-2%) | 5mo | $48,000 | $53 | 62 |
| 2606 Stevenson St | 0.38mi | 3/1.0 | 1,016 (+11%) | 7mo | $60,000 | $59 | 58 |
| 2101 Barth St | 0.68mi | 2/1.0 (-1) | 905 (-1%) | 5mo | $33,000 | $36 | 57 |
| 3216 Walton Ave | 0.64mi | 3/1.0 | 1,040 (+13%) | 1mo | $50,000 | $48 | 48 |
| 2214 Mack Ave | 0.74mi | 3/1.0 | 1,008 (+10%) | 6mo | $26,500 | $26 | 44 |
| 3288 Kissner Ave | 0.74mi | 2/1.0 (-1) | 780 (-15%) | 8mo | $40,000 | $51 | 29 |
Match score weights: distance 35% · size 25% · config 20% · recency 20%. Top-matched comps best support the ARV.
Projected returns pro-forma
-3.0% appreciation · 3.0% rent growth · sell at horizon
- IRR
- 84.5%
- Equity multiple
- 4.89×
- Total profit
- $29,383
- Equity at exit
- $4,026
- IRR
- 87.7%
- Equity multiple
- 10.14×
- Total profit
- $69,131
- Equity at exit
- $2,334
Cash invested: $7,560 (down + closing). Projections, not guarantees.
Landlord ↔ Tenant lean methodology
- Overall (STATE)
- 62 Landlord-Friendly
- State Michigan
- 62 Landlord-Friendly · EVEN
- County
- — inherits STATE
- City
- — inherits STATE
ZIP-level market 48504
- Active inventory
- 132
- Price-to-rent
- 2.4×
Monthly cashflow live
- Estimated rent
- $934 high interval (Pro) →
- Mortgage (P&I)
- −$142
- Tax from tax record
- −$56 /mo · $667/yr
- Insurance
- −$11
- HOA
- −$0
- Lot rent
- −$0
- Vacancy / Maint / Mgmt
- −$196
- Net cashflow
- $530
Break-even live
Sensitivity live
| Price | -10% $545 | -5% $537 | +0% $530 | +5% $522 | +10% $514 |
|---|---|---|---|---|---|
| Rent | -10% $456 | -5% $493 | +0% $530 | +5% $566 | +10% $603 |
| Rate | -1.0pp $543 | -0.5pp $536 | base $530 | +0.5pp $523 | +1.0pp $515 |
UW: 25.0% down · 7.5% · 30yr · 1.5% tax · 5.0% vac · 8.0% maint · 8.0% mgmt
Financing live
Cash to close
- Down payment
- $6,750
- Closing costs
- $810
- Reserves months
- —
- Total cash needed
- —
Loan-product check · same deal, 3 products live
Conventional
25% down · 7.5% · 30yr
- Down + closing
- —
- Monthly P&I
- —
- Monthly cashflow
- —
- DSCR
- —
- Eligible?
- —
Personal DTI + credit; lowest rate.
DSCR
20% down · 8.5% · 30yr
- Down + closing
- —
- Monthly P&I
- —
- Monthly cashflow
- —
- DSCR
- —
- Eligible?
- —
No personal income docs; deal must DSCR.
Hard money
10% down · 12.0% · 12mo
- Down + closing
- —
- Monthly P&I
- —
- Monthly cashflow
- —
- DSCR
- —
- Eligible?
- —
Short-term bridge; refi at stabilization.
Rent comps 12 comps
| Address | Beds | Baths | Sqft | Rent | $/sqft | DOM | Units | Dist |
|---|---|---|---|---|---|---|---|---|
| 314 Sheffield Ave Flint, MI | 2.0 | 1.0 | 896 | $1,250 | $1.40 | 23d | 1 | 1.17mi |
| 3221 Burgess St Flint, MI | 2.0 | 1.0 | 755 | $875 | $1.16 | 23d | 1 | 1.18mi |
| 3616 Concord St Unit CON3616 Flint, MI | 3.0 | 2.0 | 960 | $895 | $0.93 | 46d | 1 | 1.24mi |
| 3506 Brownell Blvd Flint, MI | 2.0 | 1.0 | 600 | $825 | $1.38 | 15d | 1 | 1.26mi |
| 2410 Gena Ann Ln Flint, MI | 3.0 | 2.0 | 960 | $895 | $0.93 | 46d | 1 | 1.28mi |
| 2410 Gena Ann Ln Unit GEN2410 Flint, MI | 3.0 | 2.0 | 960 | $895 | $0.93 | 46d | 1 | 1.28mi |
| 2332 Fredonia Ave Unit FRE2332 Flint, MI | 3.0 | 2.0 | 960 | $895 | $0.93 | 46d | 1 | 1.30mi |
| 2419 Gena Ann Ln Unit GEN2419 Flint, MI | 3.0 | 2.0 | 960 | $895 | $0.93 | 46d | 1 | 1.32mi |
| 2462 Gena Ann Ln Unit GEN2462 Flint, MI | 3.0 | 2.0 | 960 | $895 | $0.93 | 46d | 1 | 1.37mi |
| 711 W Dewey St Flint, MI | 3.0 | 1.0 | 1011 | $925 | $0.91 | 23d | 1 | 1.38mi |
| 3376 Preston Pl Unit PRE3376 Flint, MI | 3.0 | 2.0 | 960 | $895 | $0.93 | 46d | 1 | 1.39mi |
| 806 Barney Ave Flint, MI | 2.0 | 1.0 | 1000 | $1,000 | $1.00 | 23d | 1 | 1.49mi |
Listing history 4 events
-
2025-10-30status Pending
Show marketing remark (322 chars)
This home features 3 bedrooms and spacious living room with hardwood flooring throughout. bathroom needs repair. Home has an attached garage and breezeway area. Send your offer today. All offfers must have subject to probate approval. Home needs some TLC. All offers are Subject to Probate approval. Priced for quick sale.
-
2025-10-30status Pending 322-char remark
Show marketing remark (322 chars)
This home features 3 bedrooms and spacious living room with hardwood flooring throughout. bathroom needs repair. Home has an attached garage and breezeway area. Send your offer today. All offfers must have subject to probate approval. Home needs some TLC. All offers are Subject to Probate approval. Priced for quick sale.
-
2025-10-26$27,000 Active
Show marketing remark (322 chars)
This home features 3 bedrooms and spacious living room with hardwood flooring throughout. bathroom needs repair. Home has an attached garage and breezeway area. Send your offer today. All offfers must have subject to probate approval. Home needs some TLC. All offers are Subject to Probate approval. Priced for quick sale.
-
2025-10-26$27,000 Active 322-char remark
Show marketing remark (322 chars)
This home features 3 bedrooms and spacious living room with hardwood flooring throughout. bathroom needs repair. Home has an attached garage and breezeway area. Send your offer today. All offfers must have subject to probate approval. Home needs some TLC. All offers are Subject to Probate approval. Priced for quick sale.
ⓘ Source: listings_history table (triggers on properties + properties_extension) + one-shot
backfill from property_details.listing_events for pre-trigger history.
Tax reassessment forecast MI · Partial reset (capped growth)
- Current annual tax
- $667 · $56/mo
- Projected year-2 tax
- $667 · $56/mo
- Expected delta
- $0/yr ($0/mo · 0.0%)
ⓘ Screening estimate from a state-policy table — verify with the county assessor before closing.
Climate risk First Street
- Flood 1/10 Low FEMA zone X (unshaded) · 0% chance over 30 yrs
- Wildfire 1/10 Low
- Heat 2/10 Low 7 d/yr ≥96°F today · 15 d/yr by 30 yrs out
- Wind 2/10 Low
- Air quality 3/10 Moderate 3 unhealthy d/yr today · 4 by 30 yrs out
Nearby sold comps map
Loading sold comps map…
Walkable amenities ~0.75 mi
Loading nearby amenities…
Taxation est. · year 1
- Rental income
- $11,210
- − Mortgage interest
- −$1,512
- − Property taxes
- −$667
- − Insurance
- −$135
- − Repairs & maintenance
- −$897
- − Management
- −$897
- − Depreciation
- −$785
- Taxable income
- $6,317
- Est. tax owed @ 24.0%
- −$1,516
- After-tax cash flow
- $4,839/yr
For passive investors: Depreciation is non-cash, so a rental often shows a tax loss while cash-flowing — sheltering income. Rental losses are passive: they offset passive income freely, and up to $25,000/yr can offset ordinary (W-2) income if you actively participate and your MAGI is under $100k (phasing out to $0 by $150k); unused losses carry forward. On sale, claimed depreciation is recaptured at up to 25%, and gains may owe capital-gains tax (a 1031 exchange can defer both). Figures are a year-1 estimate at your 24.0% rate — not tax advice; consult a CPA.
Schools (NCES district)
- District
- Flint School District
- NCES district ID
- 2614520
- Math proficiency
- 7% ▬ 0.00%
- Reading proficiency
- 13% ▲ 3.00%
- Median HH income
- $25,954
- Composite
- 10.97/100
- National rank
- #14642
- State rank
- #714 of 760 in MI
Livability — Flint
- Score
- 74/100
- State rank
- #196
- US rank
- #4946
Category grades
Schools grade is shown separately in the Schools card above.
Census & demographics
- Census place
- Flint, MI
- City population
- 93,814
- Population (ZIP)
- 23,873
Population outlook (Genesee County) Hauer SSP2
- Today (2025)
- 381,312 people
- By 2030
- 362,731 · -4.9%
- By 2040
- 321,550 · -15.7%
- By 2050
- 279,212 · -26.8%
- By 2075
- 193,336 · -49.3%
- By 2100
- 128,118 · -66.4%
Race, ethnicity, and origin ACS 2023
- Neighborhood character
- Predominantly Black (66%)
- Race & ethnicity
- Black 66% White 24% Two or more races 6% Hispanic / Latino 5% Asian 1%
- Common ancestry
- Romanian 2% Lithuanian 1% Italian 1%
- Foreign-born
- 3% · Canada, China
- Languages at home
- 96% English-only · Spanish 2%
Political lean MEDSL · Genesee
- 2024 margin
- Toss-up / Even · D 51.4% · R 47.2% · Other 1.4%
- 2008→2024 swing
- -28.3pp toward R · 2008: 32.5pp · 2024: 4.2pp
- All cycles
- 2024: D+4.2 2020: D+9.3 2016: D+9.5 2012: D+28.2 2008: D+32.5
Not yet ingested
- Civics
- —
Market trends
- HPI YoY
- ▼ -101.67%
- Current HPI
- 94.3111
- Rent YoY
- —
- Metro
- —
- State GDP YoY
- ▲ 1.37%
- F500 in state
- 28
Industry mix (Fortune 500 HQ in MI)
| Industry | F500 HQs | Revenue |
|---|---|---|
| Automotive Parts | 3 | $48B |
|
||
| Automotive | 2 | $372B |
|
||
| Chemicals | 1 | $45B |
|
||
| Automotive Retail | 1 | $29B |
|
||
| Healthcare / Medical Devices | 1 | $23B |
|
||
| Automotive Technology | 1 | $20B |
|
||
Price history
+0.0% since first listed4 events — show timeline
- 2025-10-30 Pending — REALCOMP
- 2025-10-30 Pending — MiRealSource-MiMLS
- 2025-10-26 Listed $27,000 REALCOMP
- 2025-10-26 Listed $27,000 MiRealSource-MiMLS
Property tax history
-1.3%/yrLatest (2025): $667 · -6.9% YoY. Source: county tax records.
Cash-flow waterfall
monthlySold comps — $/sqft
last 12 mo · ≤1 miLoading sold comps…