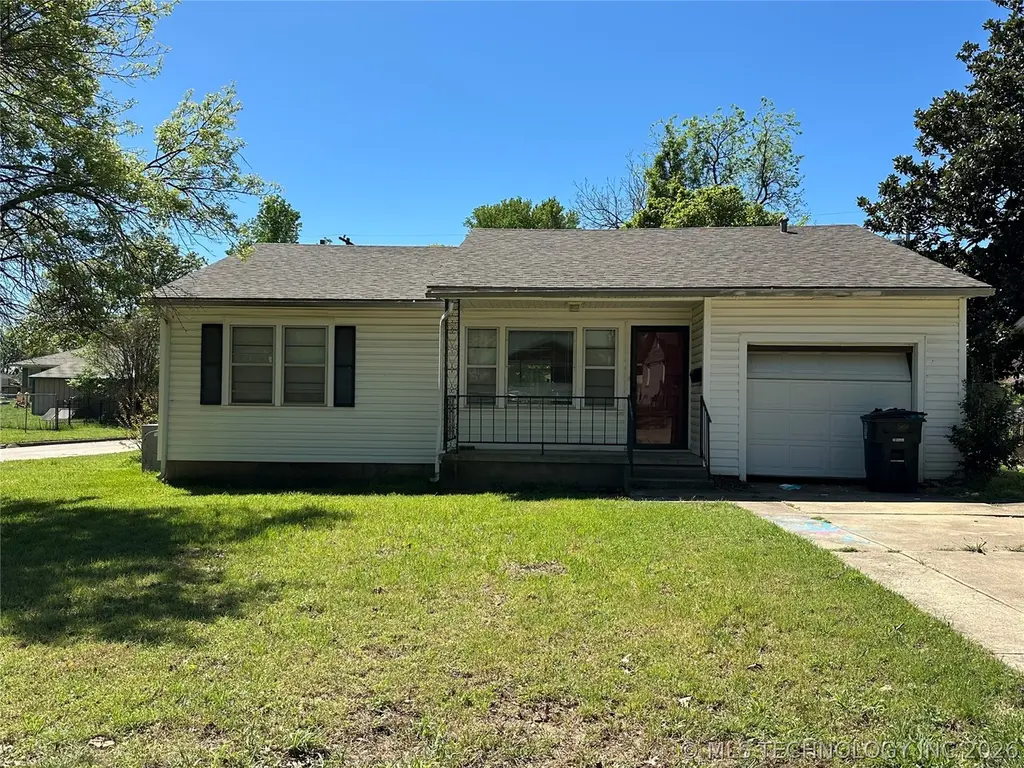
1021 Hill · Durant, OK
Flood risk 4/10 · Minor
- FEMA flood zone
- X (unshaded)
- Chance of flooding over 30 yrs
- 0.22%
- Est. flood insurance / yr
- $507 – $1,088
Fire risk 4/10 · Minor
- Est. fire insurance / yr
- $2,463 – $4,575
Heat risk 7/10 · Major
- Hot days now (above 111°F)
- 7 days/yr
- Hot days in 30 yrs
- 20 days/yr
Wind risk 4/10 · Minor
- Chance of severe wind over 30 yrs
- 18.0%
Air-quality risk 3/10 · Minor
- Unhealthy air days now
- 2 days/yr
- Unhealthy air days in 30 yrs
- 2 days/yr
Risk factors via First Street. Map © Google.
Why this score? — see what drove the C grade
The composite is a weighted blend of 9 inputs, each scored 0–100. Each bar is that input's sub-score; the figure is the points it added to the 100-point composite (weight × sub-score).
- Cash flow +23.3/30.0
- ARV discount +11.1/15.0
- DSCR +7.5/10.0
- 1% rule +5.0/10.0
- Livability +3.1/5.0
- Schools +2.8/10.0
- Rent growth +2.5/5.0
- Condition / age +2.5/5.0
- Appreciation +0.0/10.0
$135,900
🖨 Deal sheet (PDF) 📄 Offer letter ✓ Due diligence
Listing remarks MLS
2 Bedroom 1.5 Bath Home on Corner Lot.
Key facts
- Corner lot
- Covered back porch
- 7,144 sq ft lot
Tags
Property features AI
Exterior
- Parking: Attached garage (1 car)
- Security: No safety shelter
- Utilities: Electricity available; Public water; Public sewer
- Home design: Single-story; Faces north; Crawlspace foundation
- Construction: Vinyl siding with wood frame; Asphalt/fiberglass roof; Built per public records
- Exterior features: Covered porch; Shed(s); Corner lot; No additional exterior features listed
Interior
- Kitchen: Oven; Range; Electric water heater
- Flooring: Carpet; Laminate
- Bathrooms: 1 full bathroom; 1 half bathroom
- Heating & cooling: Central heating (electric); Central air conditioning
- Interior features: Ceiling fan(s); Laminate counters; Aluminum frame windows; Electric oven and range connections
Neighborhood map
What this means for you Summary
Snapshot
- This is a 4-bed/1.0-bath single-family listed at $136k.
Deal economics
- At list price, monthly cash flow is $248 ($3k/yr) — positive.
- The deal already cash-flows at list — no discount required.
- Meets the 1% rule at list price ($1k rent vs $136k).
- Recommended offer: $128k (6.0% below list) — sets the bar for market timing.
- Cap rate 8.5% vs local median 3.1% in Durant — top-decile yield for the area; either an underpriced asset or a hidden risk that comps aren't pricing in. Stress-test before assuming the spread holds.
Location & tenants
- Location reads 62/100 on livability (#262 in OK) — a middle-class / working-renter tenant base. Strengths: cost of living A+, housing A+; Watch: health & safety C-, crime D+, amenities F.
- Durant (town): math 30% / reading 37% proficiency, ranked #49 of 270 in OK (top 18%) — families likely to look elsewhere, expect single-tenant / working-renter base with shorter leases.
- Zoned schools: Washington Irving Es (math 42% / reading 32%, grade F, #132 of 845 statewide, top 19%, 435 students, 0% FRL); Durant Intermediate Es (math 24% / reading 36%, grade F, #49 of 345 statewide, top 15%, 615 students, 0% FRL); Durant Hs (math 22% / reading 32%, grade F, #125 of 447 statewide, top 31%, 956 students, 0% FRL) — zoned schools average 0% FRL vs 55% district-wide (55 pts lower); this property's tenant base skews higher-income than the district average.
- Market conditions: Rents soft (-0.1%/yr); 310 active listings in the ZIP; 1 comparable units currently listed for rent nearby; 176 units permitted in Bryan County in 2024 (80 in 5+ unit buildings).
Forward outlook
- Local home prices are declining (-3.0%/yr); year-one equity from $940 of loan paydown is wiped out by about $4k of value loss. Plan a longer hold.
- Bryan County population projected at +26% by 2050 — long-run rental-demand tailwind backs the buy-and-hold thesis.
Negotiation context
- It's been on market 76 days — a 6% lower offer ($128k) is reasonable based on typical stale-listing flexibility.
- 2 sale attempts since 4y ago with the ask held roughly flat each time — persistent listings suggest the price (not the market) is what's stuck; bring a comps-based counter.
Risks & watch-outs
- Watch-outs: built in 1953 — expect roof / HVAC / electrical / plumbing capex.
- Climate carrying-cost: extreme-heat days projected 7→20/yr by 2055 (HVAC capex compounding) — expect insurance premiums to compound above CPI over the hold.
Questions for the listing agent
- It's been on market 76 days. Have you received any prior offers? Is the seller open to a 6% concession, seller financing, or rate buy-down credit?
- Built in 1953 — when were the roof, HVAC, electrical panel, plumbing, and water heater last replaced?
- Why hasn't it sold? Are there any deal-killer items the seller is aware of (foundation, flood, title, zoning, code violations)?
- Is there a deadline driving the sale (1031 exchange, divorce, estate, relocation)? That informs how much negotiation room exists.
- Schools are D-rated, which usually means shorter tenancies and higher turnover. Who's the typical renter profile here, and what's been the actual vacancy rate?
- Crime grade is D in this area — have there been break-ins, vandalism, or insurance claims at this property in the last 3 years? What carrier currently insures it and at what premium?
- What's the average days-on-market for RENTAL listings here right now (not sales)? A rising rental-DOM trend means longer vacancies and softer asking-rent achievability than the comps imply.
- What's the recent tenant-quality profile in this submarket — average credit score on applications, eviction rate, late-payment / NSF rate, and stable-employment percentage? A property-management company in the area should have these aggregated.
- How much new for-sale + rental construction is in the pipeline within 1–3 miles? Heavy new supply typically softens prices + rents 12–24 months out; constrained supply supports both.
Investment metrics
- 1% rule
- 1.00% ✓
- Cap rate
- 8.49%
- Cash-on-cash
- 7.83%
- DSCR
- 1.35
- GRM
- 8.3
CMA / ARV
- ARV (on-the-fly)
- $147,630
- Comps found
- 12
Show comp detail 12 sales within ~0.75 mi
| Address | Dist | Beds/Ba | Sqft | Sold | Price | $/sf | Match |
|---|---|---|---|---|---|---|---|
| 1641 N 9th | 0.44mi | 3/1.0 (-1) | 1,098 (-1%) | 1mo | $155,000 | $141 | 72 |
| 503 N 13th Ave | 0.54mi | 3/1.0 (-1) | 1,148 (+3%) | 8mo | $38,500 | $34 | 58 |
| 1302 Denison | 0.26mi | 3/1.5 (-1) | 1,200 (+8%) | 17mo | $129,000 | $108 | 53 |
| 1224 Dallas | 0.26mi | 3/1.0 (-1) | 1,264 (+14%) | 14mo | $72,000 | $57 | 48 |
| 724 N 7th | 0.49mi | 3/2.0 (-1) | 1,256 (+13%) | 2mo | $190,000 | $151 | 45 |
| 921 N 6th | 0.43mi | 3/1.5 (-1) | 1,274 (+15%) | 8mo | $128,000 | $100 | 41 |
| 823 W Beech | 0.73mi | 3/1.0 (-1) | 1,076 (-3%) | 23mo | $137,500 | $128 | 37 |
| 1211 Rolling Lane St | 0.49mi | 3/2.0 (-1) | 1,268 (+14%) | 10mo | $130,000 | $103 | 36 |
| 307 N 8th | 0.71mi | 3/2.0 (-1) | 1,228 (+11%) | 6mo | $168,000 | $137 | 36 |
| 512 W Locust | 0.58mi | 3/1.0 (-1) | 1,008 (-9%) | 22mo | $145,000 | $144 | 34 |
| 1316 N 2nd | 0.62mi | 3/2.0 (-1) | 992 (-11%) | 13mo | $150,000 | $151 | 34 |
| 1202 W Beech St | 0.68mi | 3/1.0 (-1) | 954 (-14%) | 21mo | $127,000 | $133 | 22 |
Match score weights: distance 35% · size 25% · config 20% · recency 20%. Top-matched comps best support the ARV.
Projected returns pro-forma
-3.0% appreciation · 0.0% rent growth · sell at horizon
- IRR
- -7.5%
- Equity multiple
- 0.73×
- Total profit
- $-10,242
- Equity at exit
- $20,263
- IRR
- -1.8%
- Equity multiple
- 0.89×
- Total profit
- $-4,181
- Equity at exit
- $11,750
Cash invested: $38,052 (down + closing). Projections, not guarantees.
Landlord ↔ Tenant lean methodology
- Overall (STATE)
- 83 Strongly Landlord-Friendly
- State Oklahoma
- 83 Strongly Landlord-Friendly · R+20
- County
- — inherits STATE
- City
- — inherits STATE
ZIP-level market 74701
- Home prices YoY
- -11.3%
- Rents YoY
- -0.1%
- Active inventory
- 310
- Price-to-rent
- 8.3×
Monthly cashflow live
- Estimated rent
- $1,364 medium interval (Pro) →
- Mortgage (P&I)
- −$713
- Tax from tax record
- −$60 /mo · $716/yr
- Insurance
- −$57
- HOA
- −$0
- Vacancy / Maint / Mgmt
- −$286
- Net cashflow
- $248
Break-even live
Sensitivity live
| Price | -10% $325 | -5% $287 | +0% $248 | +5% $210 | +10% $172 |
|---|---|---|---|---|---|
| Rent | -10% $141 | -5% $195 | +0% $248 | +5% $302 | +10% $356 |
| Rate | -1.0pp $317 | -0.5pp $283 | base $248 | +0.5pp $213 | +1.0pp $177 |
UW: 25.0% down · 7.5% · 30yr · 1.5% tax · 5.0% vac · 8.0% maint · 8.0% mgmt
Financing live
Cash to close
- Down payment
- $33,975
- Closing costs
- $4,077
- Reserves months
- —
- Total cash needed
- —
Loan-product check · same deal, 3 products live
Conventional
25% down · 7.5% · 30yr
- Down + closing
- —
- Monthly P&I
- —
- Monthly cashflow
- —
- DSCR
- —
- Eligible?
- —
Personal DTI + credit; lowest rate.
DSCR
20% down · 8.5% · 30yr
- Down + closing
- —
- Monthly P&I
- —
- Monthly cashflow
- —
- DSCR
- —
- Eligible?
- —
No personal income docs; deal must DSCR.
Hard money
10% down · 12.0% · 12mo
- Down + closing
- —
- Monthly P&I
- —
- Monthly cashflow
- —
- DSCR
- —
- Eligible?
- —
Short-term bridge; refi at stabilization.
Rent comps 1 comps
| Address | Beds | Baths | Sqft | Rent | $/sqft | DOM | Units | Dist |
|---|---|---|---|---|---|---|---|---|
| 112 Wilson St Durant, OK | 2.0–3.0 | 1.0–2.0 | 901 | $975 | $1.08 | 22d | 5 | 0.56mi |
Listing history 25 events
-
2026-06-21days on market $135,900 Active 76 DOM
-
2026-06-19days on market $135,900 Active 74 DOM
-
2026-06-18days on market $135,900 Active 73 DOM
-
2026-06-17days on market $135,900 Active 72 DOM
-
2026-06-16days on market $135,900 Active 71 DOM
-
2026-06-15days on market $135,900 Active 70 DOM
-
2026-06-14days on market $135,900 Active 68 DOM
-
2026-06-12days on market $135,900 Active 67 DOM
-
2026-06-09days on market $135,900 Active 64 DOM
-
2026-06-08days on market $135,900 Active 63 DOM
-
2026-06-07days on market $135,900 Active 62 DOM
-
2026-06-07days on market $135,900 Active 61 DOM
-
2026-06-03days on market $135,900 Active 58 DOM
-
2026-06-02days on market $135,900 Active 57 DOM
-
2026-06-01price $135,900 Active 56 DOM
-
2026-06-01days on market $137,900 Active 56 DOM
-
2026-05-31days on market $137,900 Active 55 DOM
-
2026-05-30days on market $137,900 Active 54 DOM
-
2026-04-14price $137,900
-
2026-04-06$139,900 Active
-
2022-10-07status Pending 38-char remark
Show marketing remark (38 chars)
2 Bedroom 1.5 Bath Home on Corner Lot.
-
2022-10-07soldstatus $122,500 Closed 38-char remark
Show marketing remark (38 chars)
2 Bedroom 1.5 Bath Home on Corner Lot.
-
2022-10-07$122,500 Active 38-char remark
Show marketing remark (38 chars)
2 Bedroom 1.5 Bath Home on Corner Lot.
-
2022-10-07soldstatus $122,500
Show marketing remark (38 chars)
2 Bedroom 1.5 Bath Home on Corner Lot.
-
1997-06-15soldstatus $42,500
ⓘ Source: listings_history table (triggers on properties + properties_extension) + one-shot
backfill from property_details.listing_events for pre-trigger history.
Tax reassessment forecast OK · Resets to sale price
- Current annual tax
- $716 · $60/mo
- Projected year-2 tax
- $1,223 · $102/mo
- Expected delta
- +$507/yr (+$42/mo · 70.8%)
ⓘ Screening estimate from a state-policy table — verify with the county assessor before closing.
Climate risk First Street
- Flood 4/10 Moderate FEMA zone X (unshaded) · 22% chance over 30 yrs
- Wildfire 4/10 Moderate
- Heat 7/10 Severe 7 d/yr ≥111°F today · 20 d/yr by 30 yrs out
- Wind 4/10 Moderate 18% chance of damaging wind over 30 yrs
- Air quality 3/10 Moderate 2 unhealthy d/yr today · 2 by 30 yrs out
Nearby sold comps map
Loading sold comps map…
Walkable amenities ~0.75 mi
Loading nearby amenities…
Taxation est. · year 1
- Rental income
- $16,366
- − Mortgage interest
- −$7,613
- − Property taxes
- −$716
- − Insurance
- −$680
- − Repairs & maintenance
- −$1,309
- − Management
- −$1,309
- − Depreciation
- −$3,953
- Taxable income
- $786
- Est. tax owed @ 24.0%
- −$189
- After-tax cash flow
- $2,793/yr
For passive investors: Depreciation is non-cash, so a rental often shows a tax loss while cash-flowing — sheltering income. Rental losses are passive: they offset passive income freely, and up to $25,000/yr can offset ordinary (W-2) income if you actively participate and your MAGI is under $100k (phasing out to $0 by $150k); unused losses carry forward. On sale, claimed depreciation is recaptured at up to 25%, and gains may owe capital-gains tax (a 1031 exchange can defer both). Figures are a year-1 estimate at your 24.0% rate — not tax advice; consult a CPA.
Schools (NCES district)
- District
- Durant
- NCES district ID
- 4010350
- Math proficiency
- 30% ▼ -11.00%
- Reading proficiency
- 37% ▼ -7.00%
- Median HH income
- $35,850
- Composite
- 27.73/100
- National rank
- #6903
- State rank
- #49 of 270 in OK
Livability — Durant
- Score
- 62/100
- State rank
- #262
- US rank
- #17020
Category grades
Schools grade is shown separately in the Schools card above.
Census & demographics
- Census place
- Durant, OK
- County
- Bryan County · 27,497 people
- City population
- 27,497
- Metro
- Durant, OK
- Population (ZIP)
- 27,497
- Household income
- $58,036
- Rent vs Own
- Severe rent burden
- 759.0
Population outlook (Bryan County) Hauer SSP2
- Today (2025)
- 50,265 people
- By 2030
- 52,866 · +5.2%
- By 2040
- 58,018 · +15.4%
- By 2050
- 63,073 · +25.5%
- By 2075
- 74,439 · +48.1%
- By 2100
- 81,743 · +62.6%
Race, ethnicity, and origin ACS 2023
- Neighborhood character
- Diverse neighborhood (Simpson 0.56)
- Race & ethnicity
- White 65% Native American 14% Two or more races 13% Hispanic / Latino 9% Black 3%
- Hispanic origin (detail)
- Mexican 7%
- Common ancestry
- Italian 1% Slovak 1% Serbian 1%
- Foreign-born
- 3% · Canada
- Languages at home
- 94% English-only · Spanish 5% Other Indo-European 1%
Political lean MEDSL · Bryan
- 2024 margin
- Solid R (+58.5) · D 20.0% · R 78.6% · Other 1.4%
- 2008→2024 swing
- -23.0pp toward R · 2008: -35.5pp · 2024: -58.5pp
- All cycles
- 2024: R+58.5 2020: R+56.5 2016: R+55.6 2012: R+44.5 2008: R+35.5
Not yet ingested
- Civics
- —
Market trends
- HPI YoY
- ▼ -38.66%
- Current HPI
- 303.3877
- Rent YoY
- ▼ -0.13%
- Metro
- Durant, OK
- State GDP YoY
- ▲ 1.55%
- F500 in state
- 6
Industry mix (Fortune 500 HQ in OK)
| Industry | F500 HQs | Revenue |
|---|---|---|
| Energy | 3 | $48B |
|
||
Price history
+224.5% since first listed7 events — show timeline
- 2026-04-14 Price Changed $137,900 MLS Technology, Inc.
- 2026-04-06 Listed $139,900 MLS Technology, Inc.
- 2022-10-07 Pending — MLS Technology, Inc.
- 2022-10-07 Sold (Public Records) $122,500 Public Records
- 2022-10-07 Listed $122,500 MLS Technology, Inc.
- 2022-10-07 Sold (MLS) $122,500 MLS Technology, Inc.
- 1997-06-15 Sold (Public Records) $42,500 Public Records
Property tax history
+3.7%/yrLatest (2025): $716 · -3.2% YoY. Source: county tax records.
Cash-flow waterfall
monthlySold comps — $/sqft
last 12 mo · ≤1 miLoading sold comps…