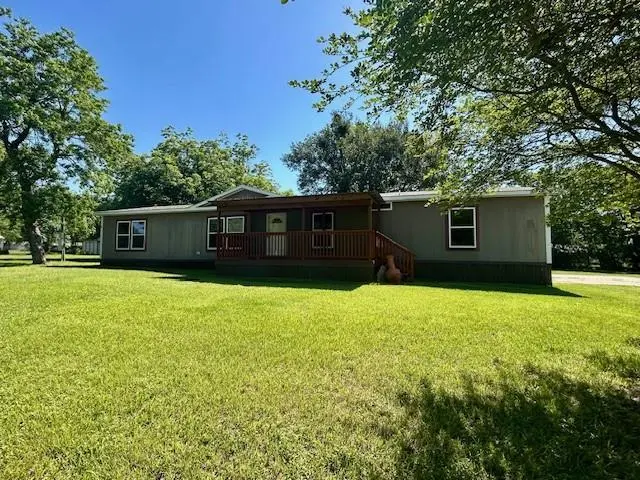
817 S 7th Ave · Teague, TX
Flood risk 1/10 · Minimal
- FEMA flood zone
- —
- Chance of flooding over 30 yrs
- 0.0%
- Est. flood insurance / yr
- —
Fire risk 5/10 · Moderate
- Est. fire insurance / yr
- $1,222 – $2,270
Heat risk 7/10 · Major
- Hot days now (above 110°F)
- 7 days/yr
- Hot days in 30 yrs
- 23 days/yr
Wind risk 7/10 · Major
- Chance of severe wind over 30 yrs
- 78.0%
Air-quality risk 1/10 · Minimal
- Unhealthy air days now
- 0 days/yr
- Unhealthy air days in 30 yrs
- 0 days/yr
Risk factors via First Street. Map © Google.
Why this score? — see what drove the B- grade
The composite is a weighted blend of 9 inputs, each scored 0–100. Each bar is that input's sub-score; the figure is the points it added to the 100-point composite (weight × sub-score).
- Cash flow +26.3/30.0
- DSCR +8.9/10.0
- ARV discount +7.5/15.0
- Appreciation +6.1/10.0
- 1% rule +5.9/10.0
- Schools +3.7/10.0
- Livability +3.4/5.0
- Rent growth +2.5/5.0
- Condition / age +2.5/5.0
$129,900
🖨 Deal sheet (PDF) 📄 Offer letter ✓ Due diligence
Listing remarks
This charming 4 bedroom, 2 bath home sits on a gorgeous . 58-acre lot and delivers the open, airy feel buyers love. The open-concept kitchen, dining, and living area flows effortlessly into a separate family room featuring a welcoming fireplace, perfect for cozy evenings. The primary bedroom is thoughtfully positioned on the opposite end of the home, offering added privacy and a quiet retreat from the main living spaces. Step outside to a covered back porch designed for gatherings, grilling, and enjoying peaceful views of the property. A storage shed provides convenient extra space for tools, hobbies, or yard equipment. A wonderful blend of comfort, space, and outdoor living. Price to sell!
Key facts
- Open concept kitchen
- Storage shed
- Peaceful views
Tags
Property features AI
Finance
- Financial info: Accepts Cash, Conventional, FHA, USDA and VA financing
- HOA & community: No association
Exterior
- Parking: Driveway parking; 2 covered parking spaces; Additional parking
- Utilities: City water; City sewer; Electricity available and connected; Cable available; Overhead utilities; Asphalt (street)
- Home design: Manufactured home; Single-story; Attached; Subdivision: Colonial Hills
- Construction: Built in 2013; Asphalt roof; Pillar/post/pier foundation
- Exterior features: Covered patio; Deck; Utilities easement; Horse permitted
Interior
- Kitchen: Built-in refrigerator; Dishwasher; Electric range
- Bedrooms: 4 bedrooms (all on main level)
- Flooring: Carpet; Linoleum
- Bathrooms: 2 full bathrooms
- Heating & cooling: Central heating (electric); Central air; Ceiling fan(s)
- Interior features: Open floorplan; Eat-in kitchen; Kitchen island; Double vanity; Walk-in closet(s); Cable TV available
- Laundry & utility: Full-size washer/dryer area; Washer hookup; Electric dryer hookup; Utility room; Electric water heater
Neighborhood map
What this means for you Summary
Snapshot
- This is a 4-bed/2.0-bath manufactured listed at $130k.
Deal economics
- At list price, monthly cash flow is $337 ($4k/yr) — positive.
- The deal already cash-flows at list — no discount required.
- Meets the 1% rule at list price ($1k rent vs $130k).
- Recommended offer: $126k (3.0% below list) — sets the bar for market timing.
- Cap rate 9.4% vs local median 2.6% in Teague — top-decile yield for the area; either an underpriced asset or a hidden risk that comps aren't pricing in. Stress-test before assuming the spread holds.
Location & tenants
- Location reads 67/100 on livability (#518 in TX) — a middle-class / working-renter tenant base. Strengths: cost of living A+, housing A+, crime B+; Watch: amenities F, commute F, health & safety F.
- Teague ISD (town): math 43% / reading 45% proficiency, ranked #289 of 826 in TX (top 35%) — families likely to look elsewhere, expect single-tenant / working-renter base with shorter leases.
- Zoned schools: Teague El (math 57% / reading 52%, grade C, #621 of 4,322 statewide, top 15%, 468 students, 69% FRL); Teague J H (math 31% / reading 38%, grade F, #858 of 1,662 statewide, top 54%, 334 students, 63% FRL); Teague H S (math 72% / reading 62%, grade B, #163 of 1,632 statewide, top 11%, 394 students, 56% FRL).
- Market conditions: 84 active listings in the ZIP; 2 units permitted in Freestone County in 2024 (0 in 5+ unit buildings).
Forward outlook
- In year one you build about $4k of equity ($898 loan paydown + $3k appreciation (2.2% local appreciation)).
- Freestone County population projected to shrink 4% by 2050 — rents likely to lag national; underwrite the cash flow, not the appreciation.
- At projected returns (2.2% appreciation + 3.0% rent growth), your $36k cash investment doubles in ~5 years — after that, you're playing with house money.
- By year 9, paydown + projected appreciation supports a ~$32k cash-out refi (75% LTV) — recoverable capital for the next deal without selling this one.
Negotiation context
- It's been on market 35 days — a 3% lower offer ($126k) is reasonable based on typical stale-listing flexibility.
- 2 sale attempts with the ask held roughly flat each time — persistent listings suggest the price (not the market) is what's stuck; bring a comps-based counter.
Risks & watch-outs
- Climate carrying-cost: major wind risk, 78% chance of damaging wind over 30y; moderate wildfire risk; extreme-heat days projected 7→23/yr by 2055 (HVAC capex compounding) — expect insurance premiums to compound above CPI over the hold.
Questions for the listing agent
- It's been on market 35 days. Have you received any prior offers? Is the seller open to a 3% concession, seller financing, or rate buy-down credit?
- Is there a deadline driving the sale (1031 exchange, divorce, estate, relocation)? That informs how much negotiation room exists.
- Schools are D-rated, which usually means shorter tenancies and higher turnover. Who's the typical renter profile here, and what's been the actual vacancy rate?
- What's the average days-on-market for RENTAL listings here right now (not sales)? A rising rental-DOM trend means longer vacancies and softer asking-rent achievability than the comps imply.
- What's the recent tenant-quality profile in this submarket — average credit score on applications, eviction rate, late-payment / NSF rate, and stable-employment percentage? A property-management company in the area should have these aggregated.
- How much new for-sale + rental construction is in the pipeline within 1–3 miles? Heavy new supply typically softens prices + rents 12–24 months out; constrained supply supports both.
Investment metrics
- 1% rule
- 1.09% ✓
- Cap rate
- 9.40%
- Cash-on-cash
- 11.11%
- DSCR
- 1.49
- GRM
- 7.7
CMA / ARV
- ARV (median comp)
- $85,060
- List price
- $129,900
- Delta
- 52.72%
- Verdict
- OVERPRICED
- Comps
- 2 within 2.0 mi
Projected returns pro-forma
2.21% appreciation · 3.0% rent growth · sell at horizon
- IRR
- 16.0%
- Equity multiple
- 1.87×
- Total profit
- $31,675
- Equity at exit
- $52,700
- IRR
- 18.2%
- Equity multiple
- 3.46×
- Total profit
- $89,554
- Equity at exit
- $77,030
Cash invested: $36,372 (down + closing). Projections, not guarantees.
Landlord ↔ Tenant lean methodology
- Overall (STATE)
- 87 Strongly Landlord-Friendly
- State Texas
- 87 Strongly Landlord-Friendly · R+5
- County
- — inherits STATE
- City
- — inherits STATE
ZIP-level market 75860
- Home prices YoY
- 1.5%
- Active inventory
- 84
- Price-to-rent
- 7.7×
Monthly cashflow live
- Estimated rent
- $1,413 medium interval (Pro) →
- Mortgage (P&I)
- −$681
- Tax from tax record
- −$44 /mo · $530/yr
- Insurance
- −$54
- HOA
- −$0
- Vacancy / Maint / Mgmt
- −$297
- Net cashflow
- $337
Break-even live
Sensitivity live
| Price | -10% $410 | -5% $373 | +0% $337 | +5% $300 | +10% $263 |
|---|---|---|---|---|---|
| Rent | -10% $225 | -5% $281 | +0% $337 | +5% $393 | +10% $448 |
| Rate | -1.0pp $402 | -0.5pp $370 | base $337 | +0.5pp $303 | +1.0pp $269 |
UW: 25.0% down · 7.5% · 30yr · 1.5% tax · 5.0% vac · 8.0% maint · 8.0% mgmt
Financing live
Cash to close
- Down payment
- $32,475
- Closing costs
- $3,897
- Reserves months
- —
- Total cash needed
- —
Loan-product check · same deal, 3 products live
Conventional
25% down · 7.5% · 30yr
- Down + closing
- —
- Monthly P&I
- —
- Monthly cashflow
- —
- DSCR
- —
- Eligible?
- —
Personal DTI + credit; lowest rate.
DSCR
20% down · 8.5% · 30yr
- Down + closing
- —
- Monthly P&I
- —
- Monthly cashflow
- —
- DSCR
- —
- Eligible?
- —
No personal income docs; deal must DSCR.
Hard money
10% down · 12.0% · 12mo
- Down + closing
- —
- Monthly P&I
- —
- Monthly cashflow
- —
- DSCR
- —
- Eligible?
- —
Short-term bridge; refi at stabilization.
Listing history 20 events
-
2026-06-22days on market $129,900 Active 35 DOM
-
2026-06-21days on market $129,900 Active 34 DOM
-
2026-06-21days on market $129,900 Active 33 DOM
-
2026-06-18days on market $129,900 Active 31 DOM
-
2026-06-17days on market $129,900 Active 30 DOM
-
2026-06-16days on market $129,900 Active 29 DOM
-
2026-06-15days on market $129,900 Active 28 DOM
-
2026-06-15days on market $129,900 Active 27 DOM
-
2026-06-13days on market $129,900 Active 26 DOM
-
2026-06-12days on market $129,900 Active 25 DOM
-
2026-06-09days on market $129,900 Active 22 DOM
-
2026-06-08days on market $129,900 Active 21 DOM
-
2026-06-08pricedays on market $129,900 Active 20 DOM
-
2026-06-05days on market $132,500 Active 18 DOM
-
2026-06-03days on market $132,500 Active 16 DOM
-
2026-06-02days on market $132,500 Active 15 DOM
-
2026-06-01days on market $132,500 Active 14 DOM
-
2026-05-31days on market $132,500 Active 13 DOM
-
2026-05-14$132,500 Active 702-char remark
-
2010-03-25soldstatus
ⓘ Source: listings_history table (triggers on properties + properties_extension) + one-shot
backfill from property_details.listing_events for pre-trigger history.
Tax reassessment forecast TX · Resets to sale price
- Current annual tax
- $530 · $44/mo
- Projected year-2 tax
- $2,377 · $198/mo
- Expected delta
- +$1,847/yr (+$154/mo · 348.1%)
ⓘ Screening estimate from a state-policy table — verify with the county assessor before closing.
Climate risk First Street
- Flood 1/10 Low 0% chance over 30 yrs
- Wildfire 5/10 Major
- Heat 7/10 Severe 7 d/yr ≥110°F today · 23 d/yr by 30 yrs out
- Wind 7/10 Severe 78% chance of damaging wind over 30 yrs
- Air quality 1/10 Low 0 unhealthy d/yr today · 0 by 30 yrs out
Nearby sold comps map
Loading sold comps map…
Walkable amenities ~0.75 mi
Loading nearby amenities…
Taxation est. · year 1
- Rental income
- $16,955
- − Mortgage interest
- −$7,276
- − Property taxes
- −$530
- − Insurance
- −$650
- − Repairs & maintenance
- −$1,356
- − Management
- −$1,356
- − Depreciation
- −$3,779
- Taxable income
- $2,007
- Est. tax owed @ 24.0%
- −$482
- After-tax cash flow
- $3,559/yr
For passive investors: Depreciation is non-cash, so a rental often shows a tax loss while cash-flowing — sheltering income. Rental losses are passive: they offset passive income freely, and up to $25,000/yr can offset ordinary (W-2) income if you actively participate and your MAGI is under $100k (phasing out to $0 by $150k); unused losses carry forward. On sale, claimed depreciation is recaptured at up to 25%, and gains may owe capital-gains tax (a 1031 exchange can defer both). Figures are a year-1 estimate at your 24.0% rate — not tax advice; consult a CPA.
Schools (NCES district)
- District
- Teague ISD
- NCES district ID
- 4842300
- Math proficiency
- 43% ▼ -5.00%
- Reading proficiency
- 45% ▲ 2.00%
- Median HH income
- $46,009
- Composite
- 37.43/100
- National rank
- #4419
- State rank
- #289 of 826 in TX
Livability — Teague
- Score
- 67/100
- State rank
- #518
- US rank
- #10201
Category grades
Schools grade is shown separately in the Schools card above.
Census & demographics
- Census place
- Teague, TX
- Population (ZIP)
- 6,451
Population outlook (Freestone County) Hauer SSP2
- Today (2025)
- 19,591 people
- By 2030
- 19,470 · -0.6%
- By 2040
- 19,111 · -2.5%
- By 2050
- 18,700 · -4.5%
- By 2075
- 17,586 · -10.2%
- By 2100
- 14,933 · -23.8%
Race, ethnicity, and origin ACS 2023
- Neighborhood character
- Diverse neighborhood (Simpson 0.64)
- Race & ethnicity
- White 50% Hispanic / Latino 30% Two or more races 24% Black 15%
- Hispanic origin (detail)
- Mexican 25%
- Common ancestry
- Lithuanian 2% Iranian 1% Slovak 1%
- Foreign-born
- 7% · Canada
- Languages at home
- 81% English-only · Spanish 18% Arabic 1%
Political lean MEDSL · Freestone
- 2024 margin
- Solid R (+66.3) · D 16.6% · R 82.9%
- 2008→2024 swing
- -22.8pp toward R · 2008: -43.5pp · 2024: -66.3pp
- All cycles
- 2024: R+66.3 2020: R+61.5 2016: R+59.6 2012: R+50.2 2008: R+43.5
Not yet ingested
- Civics
- —
Market trends
- HPI YoY
- ▲ 2.21%
- Current HPI
- 152.2612
- Rent YoY
- —
- Metro
- —
- State GDP YoY
- ▲ 3.95%
- F500 in state
- 110
Industry mix (Fortune 500 HQ in TX)
| Industry | F500 HQs | Revenue |
|---|---|---|
| Energy | 16 | $1,198B |
|
||
| Technology | 5 | $198B |
|
||
| Engineering / Construction | 4 | $72B |
|
||
| Energy Services | 3 | $60B |
|
||
| Utilities | 3 | $41B |
|
||
| Healthcare | 2 | $330B |
|
||
Price history
-2.0% since first listed5 events — show timeline
- 2026-06-05 Price Changed $129,900 NTREIS
- 2026-05-23 Relisted — NTREIS
- 2026-05-19 Pending — NTREIS
- 2026-05-14 Listed $132,500 NTREIS
- 2010-03-25 Sold (Public Records) — Public Records
Property tax history
-6.4%/yrLatest (2025): $530 · -0.8% YoY. Source: county tax records.
Cash-flow waterfall
monthlySold comps — $/sqft
last 12 mo · ≤1 miLoading sold comps…