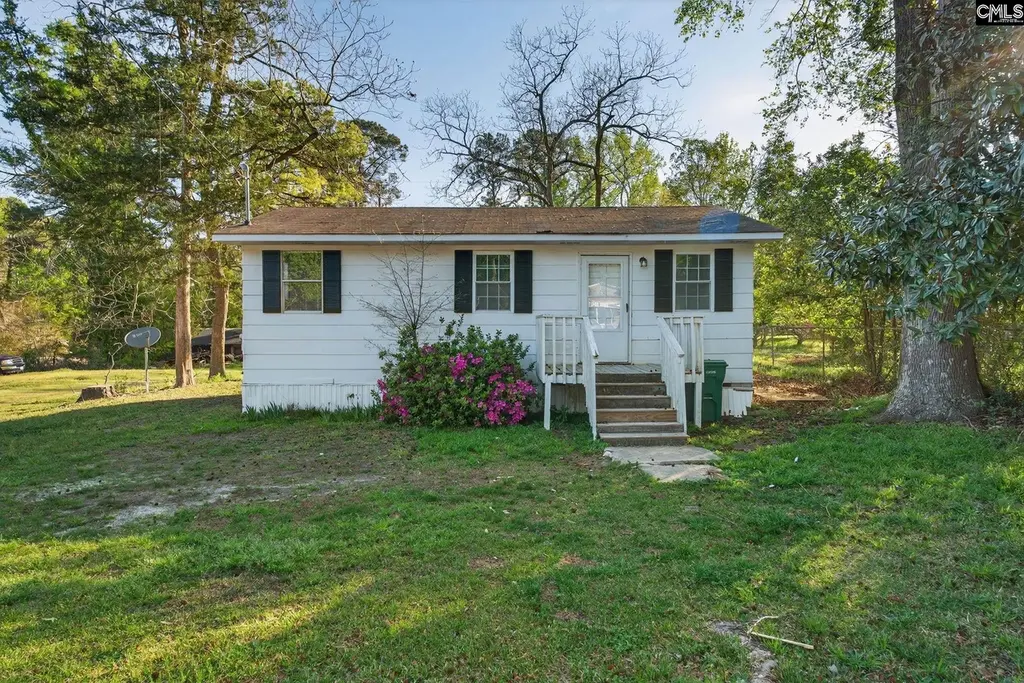
332 Beltline Ave · Batesburg-Leesville, SC
Flood risk 1/10 · Minimal
- FEMA flood zone
- X (unshaded)
- Chance of flooding over 30 yrs
- 0.0%
- Est. flood insurance / yr
- $507 – $1,088
Fire risk 3/10 · Minor
- Est. fire insurance / yr
- $783 – $1,453
Heat risk 6/10 · Moderate
- Hot days now (above 106°F)
- 7 days/yr
- Hot days in 30 yrs
- 16 days/yr
Wind risk 6/10 · Moderate
- Chance of severe wind over 30 yrs
- 66.0%
Air-quality risk 3/10 · Minor
- Unhealthy air days now
- 3 days/yr
- Unhealthy air days in 30 yrs
- 3 days/yr
Risk factors via First Street. Map © Google.
Why this score? — see what drove the D+ grade
The composite is a weighted blend of 9 inputs, each scored 0–100. Each bar is that input's sub-score; the figure is the points it added to the 100-point composite (weight × sub-score).
- Cash flow +20.2/30.0
- ARV discount +7.5/15.0
- DSCR +6.4/10.0
- 1% rule +5.0/10.0
- Rent growth +2.5/5.0
- Schools +2.5/10.0
- Livability +2.5/5.0
- Condition / age +2.5/5.0
- Appreciation +0.0/10.0
$100,000
🖨 Deal sheet (PDF) 📄 Offer letter ✓ Due diligence
Listing remarks MLS
Sold AS IS; No Disclosures. Bring ALL offers; Owner is anxious. Good investment property.
Key facts
- Fresh paint
- Newer roof
- New lvp flooring
Tags
Property features AI
Exterior
- Utilities: Public water; Public sewer
- Home design: Single-story entry (main level living indicated)
- Construction: Crawlspace foundation
- Exterior features: Other exterior finish; Paved road access
Interior
- Bedrooms: Master bedroom located on the main level
- Bathrooms: One full bathroom
- Heating & cooling: Gas pack heating; Gas pack cooling
- Interior features: Main-level master bedroom
Neighborhood map
What this means for you Summary
Snapshot
- This is a 2-bed/1.0-bath single-family listed at $100k.
Deal economics
- At list price, monthly cash flow is $126 ($2k/yr) — positive.
- The deal already cash-flows at list — no discount required.
- Meets the 1% rule at list price ($1k rent vs $100k).
- Recommended offer: $94k (6.0% below list) — sets the bar for market timing.
Location & tenants
- Location reads: area grade D — affects rentability + tenant quality, not the cash-flow math above.
- Lexington 03 (rural): math 26% / reading 33% proficiency, ranked #56 of 80 in SC (top 70%) — low school quality limits family demand, transient renter base, plan for 1-2y turnover; 61% free/reduced lunch — lower-income household profile, screen leases tightly.
- Zoned schools: Batesburg-Leesville Primary School (543 students, 100% FRL); Batesburg-Leesville Middle School (math 14% / reading 29%, grade F, #176 of 229 statewide, top 77%, 456 students, 100% FRL); Batesburg-Leesville High School (math 22% / reading 72%, grade D-, #158 of 196 statewide, top 82%, 547 students, 100% FRL) — zoned schools average 100% FRL vs 61% district-wide (39 pts higher); higher-poverty schools than district average — tighter screening recommended.
- Market conditions: 71 active listings in the ZIP; 1 comparable units currently listed for rent nearby; 1,712 units permitted in Lexington County in 2024 (0 in 5+ unit buildings).
Forward outlook
- Local home prices are declining (-3.0%/yr); year-one equity from $691 of loan paydown is wiped out by about $3k of value loss. Plan a longer hold.
- Lexington County population projected at +26% by 2050 — long-run rental-demand tailwind backs the buy-and-hold thesis.
Negotiation context
- It's been on market 83 days — a 6% lower offer ($94k) is reasonable based on typical stale-listing flexibility.
- 3 sale attempts since 19y ago; this cycle's ask has dropped $20k (17%) from the opening price — seller is motivated, your offer sets the floor, not the list.
- Current owner paid $12k; list at $100k implies a 733% gain — meaningful room to come down on a strong offer.
Risks & watch-outs
- Climate carrying-cost: major wind risk, 66% chance of damaging wind over 30y; extreme-heat days projected 7→16/yr by 2055 (HVAC capex compounding) — expect insurance premiums to compound above CPI over the hold.
Questions for the listing agent
- It's been on market 83 days. Have you received any prior offers? Is the seller open to a 6% concession, seller financing, or rate buy-down credit?
- Why hasn't it sold? Are there any deal-killer items the seller is aware of (foundation, flood, title, zoning, code violations)?
- Is there a deadline driving the sale (1031 exchange, divorce, estate, relocation)? That informs how much negotiation room exists.
- The area grade is low — what's the realistic commute time and amenity access for the typical tenant pool here? Any planned neighborhood developments (good or bad) we should know about?
- What's the average days-on-market for RENTAL listings here right now (not sales)? A rising rental-DOM trend means longer vacancies and softer asking-rent achievability than the comps imply.
- What's the recent tenant-quality profile in this submarket — average credit score on applications, eviction rate, late-payment / NSF rate, and stable-employment percentage? A property-management company in the area should have these aggregated.
- How much new for-sale + rental construction is in the pipeline within 1–3 miles? Heavy new supply typically softens prices + rents 12–24 months out; constrained supply supports both.
Investment metrics
- 1% rule
- 1.00% ✓
- Cap rate
- 7.80%
- Cash-on-cash
- 5.38%
- DSCR
- 1.24
- GRM
- 8.3
CMA / ARV
No comps found within radius.
Projected returns pro-forma
-3.0% appreciation · 3.0% rent growth · sell at horizon
- IRR
- -8.0%
- Equity multiple
- 0.71×
- Total profit
- $-8,202
- Equity at exit
- $14,910
- IRR
- 1.6%
- Equity multiple
- 1.11×
- Total profit
- $3,164
- Equity at exit
- $8,646
Cash invested: $28,000 (down + closing). Projections, not guarantees.
Landlord ↔ Tenant lean methodology
- Overall (STATE)
- 90 Strongly Landlord-Friendly
- State South Carolina
- 90 Strongly Landlord-Friendly · R+6
- County
- — inherits STATE
- City
- — inherits STATE
ZIP-level market 29006
- Home prices YoY
- -6.3%
- Active inventory
- 71
- Price-to-rent
- 8.3×
Monthly cashflow live
- Estimated rent
- $1,004 medium interval (Pro) →
- Mortgage (P&I)
- −$524
- Tax from tax record
- −$102 /mo · $1,222/yr
- Insurance
- −$42
- HOA
- −$0
- Lot rent
- −$0
- Vacancy / Maint / Mgmt
- −$211
- Net cashflow
- $126
Break-even live
Sensitivity live
| Price | -10% $182 | -5% $154 | +0% $126 | +5% $97 | +10% $69 |
|---|---|---|---|---|---|
| Rent | -10% $46 | -5% $86 | +0% $126 | +5% $165 | +10% $205 |
| Rate | -1.0pp $176 | -0.5pp $151 | base $126 | +0.5pp $100 | +1.0pp $73 |
UW: 25.0% down · 7.5% · 30yr · 1.5% tax · 5.0% vac · 8.0% maint · 8.0% mgmt
Financing live
Cash to close
- Down payment
- $25,000
- Closing costs
- $3,000
- Reserves months
- —
- Total cash needed
- —
Loan-product check · same deal, 3 products live
Conventional
25% down · 7.5% · 30yr
- Down + closing
- —
- Monthly P&I
- —
- Monthly cashflow
- —
- DSCR
- —
- Eligible?
- —
Personal DTI + credit; lowest rate.
DSCR
20% down · 8.5% · 30yr
- Down + closing
- —
- Monthly P&I
- —
- Monthly cashflow
- —
- DSCR
- —
- Eligible?
- —
No personal income docs; deal must DSCR.
Hard money
10% down · 12.0% · 12mo
- Down + closing
- —
- Monthly P&I
- —
- Monthly cashflow
- —
- DSCR
- —
- Eligible?
- —
Short-term bridge; refi at stabilization.
Rent comps 1 comps
| Address | Beds | Baths | Sqft | Rent | $/sqft | DOM | Units | Dist |
|---|---|---|---|---|---|---|---|---|
| 221 Willis St Batesburg-Leesville, SC | 1.0–3.0 | 1.0–2.0 | 870 | $1,004 | $1.15 | 5d | 1 | 1.15mi |
Listing history 23 events
-
2026-06-21days on market $100,000 Active 83 DOM
-
2026-06-18days on market $100,000 Active 80 DOM
-
2026-06-17days on market $100,000 Active 79 DOM
-
2026-06-16days on market $100,000 Active 78 DOM
-
2026-06-15days on market $100,000 Active 77 DOM
-
2026-06-14days on market $100,000 Active 75 DOM
-
2026-06-10days on market $100,000 Active 72 DOM
-
2026-06-09days on market $100,000 Active 71 DOM
-
2026-06-08days on market $100,000 Active 70 DOM
-
2026-06-07days on market $100,000 Active 69 DOM
-
2026-06-03days on market $100,000 Active 65 DOM
-
2026-06-03days on market $100,000 Active 64 DOM
-
2026-06-01days on market $100,000 Active 63 DOM
-
2026-05-31days on market $100,000 Active 62 DOM
-
2026-05-21price $100,000
-
2026-04-28price $105,000
-
2026-04-20price $110,000
-
2026-03-29$119,999 Active
-
2026-03-21historical $1,100
-
2026-02-20$1,100
-
2008-01-08soldstatus $12,000 89-char remark
Show marketing remark (89 chars)
Sold AS IS; No Disclosures. Bring ALL offers; Owner is anxious. Good investment property.
-
2007-11-19$18,000 89-char remark
Show marketing remark (89 chars)
Sold AS IS; No Disclosures. Bring ALL offers; Owner is anxious. Good investment property.
-
1994-05-01soldstatus $15,000
ⓘ Source: listings_history table (triggers on properties + properties_extension) + one-shot
backfill from property_details.listing_events for pre-trigger history.
Tax reassessment forecast SC · Resets to sale price
- Current annual tax
- $1,222 · $102/mo
- Projected year-2 tax
- $1,222 · $102/mo
- Expected delta
- $0/yr ($0/mo · 0.0%)
ⓘ Screening estimate from a state-policy table — verify with the county assessor before closing.
Climate risk First Street
- Flood 1/10 Low FEMA zone X (unshaded) · 0% chance over 30 yrs
- Wildfire 3/10 Moderate
- Heat 6/10 Major 7 d/yr ≥106°F today · 16 d/yr by 30 yrs out
- Wind 6/10 Major 66% chance of damaging wind over 30 yrs
- Air quality 3/10 Moderate 3 unhealthy d/yr today · 3 by 30 yrs out
Nearby sold comps map
Loading sold comps map…
Walkable amenities ~0.75 mi
Loading nearby amenities…
Taxation est. · year 1
- Rental income
- $12,054
- − Mortgage interest
- −$5,602
- − Property taxes
- −$1,222
- − Insurance
- −$500
- − Repairs & maintenance
- −$964
- − Management
- −$964
- − Depreciation
- −$2,909
- Taxable loss
- −$108
- Est. tax savings @ 24.0%
- +$26
- After-tax cash flow
- $1,533/yr
For passive investors: Depreciation is non-cash, so a rental often shows a tax loss while cash-flowing — sheltering income. Rental losses are passive: they offset passive income freely, and up to $25,000/yr can offset ordinary (W-2) income if you actively participate and your MAGI is under $100k (phasing out to $0 by $150k); unused losses carry forward. On sale, claimed depreciation is recaptured at up to 25%, and gains may owe capital-gains tax (a 1031 exchange can defer both). Figures are a year-1 estimate at your 24.0% rate — not tax advice; consult a CPA.
Schools (NCES district)
- District
- Lexington 03
- NCES district ID
- 4502760
- Math proficiency
- 26% ▼ -18.00%
- Reading proficiency
- 33% ▼ -6.00%
- Median HH income
- $40,709
- Composite
- 24.88/100
- National rank
- #7586
- State rank
- #56 of 80 in SC
Livability — Batesburg-Leesville
No livability data for this city. (Only ~50 U.S. cities are tracked.)
Census & demographics
- Census place
- Batesburg-Leesville, SC
- Population (ZIP)
- 8,987
Population outlook (Lexington County) Hauer SSP2
- Today (2025)
- 322,999 people
- By 2030
- 342,356 · +6.0%
- By 2040
- 377,715 · +16.9%
- By 2050
- 406,984 · +26.0%
- By 2075
- 465,447 · +44.1%
- By 2100
- 485,674 · +50.4%
Race, ethnicity, and origin ACS 2023
- Neighborhood character
- Majority White (63%)
- Race & ethnicity
- White 63% Black 18% Hispanic / Latino 16% Two or more races 8%
- Hispanic origin (detail)
- Mexican 11%
- Common ancestry
- Slovak 2% Lithuanian 1% Italian 1%
- Foreign-born
- 8% · Canada
- Languages at home
- 85% English-only · Spanish 13% German/W. Germanic 2%
Political lean MEDSL · Lexington
- 2024 margin
- Solid R (+33.5) · D 32.5% · R 66.0% · Other 1.4%
- 2008→2024 swing
- +4.6pp toward D · 2008: -38.0pp · 2024: -33.5pp
- All cycles
- 2024: R+33.5 2020: R+30.1 2016: R+36.7 2012: R+37.8 2008: R+38.0
Not yet ingested
- Civics
- —
Market trends
- HPI YoY
- ▼ -17.26%
- Current HPI
- 256.774
- Rent YoY
- —
- Metro
- —
- State GDP YoY
- ▲ 4.51%
- F500 in state
- 2
Industry mix (Fortune 500 HQ in SC)
| Industry | F500 HQs | Revenue |
|---|---|---|
| Packaging | 1 | $7B |
|
||
Price history
+566.7% since first listed9 events — show timeline
- 2026-05-21 Price Changed $100,000 Consolidated MLS
- 2026-04-28 Price Changed $105,000 Consolidated MLS
- 2026-04-20 Price Changed $110,000 Consolidated MLS
- 2026-03-29 Listed $119,999 Consolidated MLS
- 2026-03-21 Rental Removed $1,100 APPFOLIO
- 2026-02-20 Listed for Rent $1,100 APPFOLIO
- 2008-01-08 Sold (MLS) $12,000 AMLS
- 2007-11-19 Listed $18,000 AMLS
- 1994-05-01 Sold (Public Records) $15,000 Public Records
Property tax history
+0.8%/yrLatest (2024): $1,222 · +27.2% YoY. Source: county tax records.
Cash-flow waterfall
monthlySold comps — $/sqft
last 12 mo · ≤1 miLoading sold comps…