2732 Huron St · Baton Rouge, LA
Flood risk 1/10 · Minimal
- FEMA flood zone
- X (unshaded)
- Chance of flooding over 30 yrs
- 0.0%
- Est. flood insurance / yr
- $507 – $1,088
Fire risk 1/10 · Minimal
- Est. fire insurance / yr
- $1,269 – $2,357
Heat risk 8/10 · Major
- Hot days now (above 108°F)
- 7 days/yr
- Hot days in 30 yrs
- 19 days/yr
Wind risk 9/10 · Severe
- Chance of severe wind over 30 yrs
- 99.0%
Air-quality risk 2/10 · Minimal
- Unhealthy air days now
- 1 days/yr
- Unhealthy air days in 30 yrs
- 1 days/yr
Risk factors via First Street. Map © Google.
Why this score? — see what drove the B+ grade
The composite is a weighted blend of 9 inputs, each scored 0–100. Each bar is that input's sub-score; the figure is the points it added to the 100-point composite (weight × sub-score).
- Cash flow +30.0/30.0
- ARV discount +15.0/15.0
- 1% rule +10.0/10.0
- DSCR +10.0/10.0
- Livability +3.7/5.0
- Condition / age +2.5/5.0
- Schools +2.4/10.0
- Rent growth +2.2/5.0
- Appreciation +0.0/10.0
$39,900
🖨 Deal sheet (PDF) 📄 Offer letter ✓ Due diligence
Listing remarks MLS
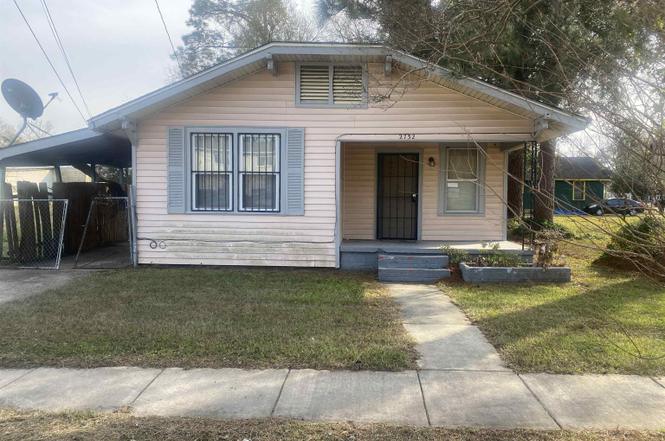
Calling all DIY Owners of investors! This 3-bedroom, 1-bath home in the Istrouma area is a prime candidate for your next project. Situated on a fully fenced lot with a single carport, this property offers a solid footprint for a full restoration. The interior features a living room, formal dining room, and a massive eat-in kitchen with enough space to create a custom breakfast nook or secondary sitting area. Whether you're looking to flip or build your rental portfolio, this diamond in the rough is priced to move.
Key facts
- Formal dining room
- Living room
- Single carport
Tags
Neighborhood map
What this means for you Summary
Snapshot
- This is a 3-bed/1.0-bath single-family listed at $40k.
Deal economics
- At list price, monthly cash flow is $527 ($6k/yr) — positive.
- The deal already cash-flows at list — no discount required.
- Meets the 1% rule at list price ($986 rent vs $40k).
- Recommended offer: $36k (9.0% below list) — sets the bar for market timing.
- Cap rate 22.2% vs local median 4.3% in Baton Rouge — top-decile yield for the area; either an underpriced asset or a hidden risk that comps aren't pricing in. Stress-test before assuming the spread holds.
Location & tenants
- Location reads 74/100 on livability (#24 in LA, #4,535 nationally) — a middle-class / working-renter tenant base. Strengths: commute A+, cost of living A+, health & safety A+; Watch: amenities D, crime F, employment D-.
- East Baton Rouge Parish (urban): math 22% / reading 34% proficiency, ranked #47 of 98 in LA (top 48%) — low school quality limits family demand, transient renter base, plan for 1-2y turnover; 77% free/reduced lunch — lower-income household profile, screen leases tightly.
- Market conditions: Rents soft (-1.2%/yr); 155 active listings in the ZIP; 17 comparable units currently listed for rent nearby; rentals at typical pace (median 24d on market — plan ~3-4 weeks tenant-placement turnaround); 41% of comp listings sitting > 30 days — soft ceiling on asking rent; lower-income renter base — watch delinquency; 2,252 units permitted in East Baton Rouge Parish in 2024 (440 in 5+ unit buildings).
- At $986/mo this rent would consume 47% of the median local household income ($25k/yr) (locally 1980% of renters already pay >50% of income on rent) — very limited rent-growth headroom before tenants either downsize or default.
Forward outlook
- Local home prices are declining (-3.0%/yr); year-one equity from $276 of loan paydown is wiped out by about $1k of value loss. Plan a longer hold.
- East Baton Rouge County population projected at +4% by 2050 — modest demand growth; plan on rents tracking national, not racing it.
- At projected returns (-3.0% appreciation + 0.0% rent growth), your $11k cash investment doubles in ~3 years — after that, you're playing with house money.
Negotiation context
- It's been on market 96 days — a 9% lower offer ($36k) is reasonable based on typical stale-listing flexibility.
- 6 sale attempts since 22y ago; this cycle's ask has dropped $5k (11%) from the opening price — seller is motivated, your offer sets the floor, not the list.
Risks & watch-outs
- Watch-outs: built in 1930 — expect roof / HVAC / electrical / plumbing capex.
- Climate carrying-cost: severe wind risk, 99% chance of damaging wind over 30y; extreme-heat days projected 7→19/yr by 2055 (HVAC capex compounding) — expect insurance premiums to compound above CPI over the hold.
Questions for the listing agent
- It's been on market 96 days. Have you received any prior offers? Is the seller open to a 9% concession, seller financing, or rate buy-down credit?
- Built in 1930 — when were the roof, HVAC, electrical panel, plumbing, and water heater last replaced?
- Why hasn't it sold? Are there any deal-killer items the seller is aware of (foundation, flood, title, zoning, code violations)?
- Is there a deadline driving the sale (1031 exchange, divorce, estate, relocation)? That informs how much negotiation room exists.
- Crime grade is F in this area — have there been break-ins, vandalism, or insurance claims at this property in the last 3 years? What carrier currently insures it and at what premium?
- What's the average days-on-market for RENTAL listings here right now (not sales)? A rising rental-DOM trend means longer vacancies and softer asking-rent achievability than the comps imply.
- What's the recent tenant-quality profile in this submarket — average credit score on applications, eviction rate, late-payment / NSF rate, and stable-employment percentage? A property-management company in the area should have these aggregated.
- How much new for-sale + rental construction is in the pipeline within 1–3 miles? Heavy new supply typically softens prices + rents 12–24 months out; constrained supply supports both.
Investment metrics
- 1% rule
- 2.47% ✓
- Cap rate
- 22.15%
- Cash-on-cash
- 56.65%
- DSCR
- 3.52
- GRM
- 3.4
CMA / ARV
- ARV (on-the-fly)
- $73,968
- Comps found
- 12
Show comp detail 12 sales within ~0.75 mi
| Address | Dist | Beds/Ba | Sqft | Sold | Price | $/sf | Match |
|---|---|---|---|---|---|---|---|
| 3235 Alliquippa St | 0.06mi | 2/1.0 (-1) | 1,200 (+9%) | 5mo | $80,000 | $67 | 73 |
| 3216 Brady St | 0.31mi | 3/1.0 | 1,038 (-6%) | 6mo | $69,900 | $67 | 70 |
| 3736 Alliquippa St | 0.38mi | 3/1.5 | 1,050 (-5%) | 5mo | $109,900 | $105 | 68 |
| 3130 Hiawatha St | 0.28mi | 2/1.0 (-1) | 1,012 (-8%) | 5mo | $36,900 | $36 | 64 |
| 3430 Oswego St | 0.46mi | 2/1.0 (-1) | 1,180 (+7%) | 1mo | $95,900 | $81 | 62 |
| 2927 Tecumseh St | 0.29mi | 3/2.0 | 1,245 (+13%) | 3mo | $182,500 | $147 | 59 |
| 3911 Dalton St | 0.69mi | 3/1.0 | 1,033 (-6%) | 2mo | $29,000 | $28 | 56 |
| 3032 Seneca St | 0.44mi | 2/1.0 (-1) | 1,000 (-9%) | 8mo | $10,000 | $10 | 52 |
| 2908 Adams Ave | 0.61mi | 3/1.0 | 1,232 (+12%) | 9mo | $100,000 | $81 | 45 |
| 3691 Dalton St | 0.58mi | 4/1.0 (+1) | 1,225 (+11%) | 10mo | $52,500 | $43 | 42 |
| 2711 Jackson Ave | 0.75mi | 3/2.0 | 1,200 (+9%) | 7mo | $79,000 | $66 | 41 |
| 3825 Keokuk St | 0.47mi | 4/2.0 (+1) | 1,265 (+15%) | 5mo | $59,500 | $47 | 40 |
Match score weights: distance 35% · size 25% · config 20% · recency 20%. Top-matched comps best support the ARV.
Projected returns pro-forma
-3.0% appreciation · 0.0% rent growth · sell at horizon
- IRR
- 51.7%
- Equity multiple
- 3.17×
- Total profit
- $24,235
- Equity at exit
- $5,949
- IRR
- 55.9%
- Equity multiple
- 5.76×
- Total profit
- $53,188
- Equity at exit
- $3,450
Cash invested: $11,172 (down + closing). Projections, not guarantees.
Landlord ↔ Tenant lean methodology
- Overall (STATE)
- 90 Strongly Landlord-Friendly
- State Louisiana
- 90 Strongly Landlord-Friendly · R+12
- County
- — inherits STATE
- City
- — inherits STATE
ZIP-level market 70805
- Rents YoY
- -1.2%
- Active inventory
- 155
- Price-to-rent
- 3.4×
Monthly cashflow live
- Estimated rent
- $986 high interval (Pro) →
- Mortgage (P&I)
- −$209
- Tax from tax record
- −$26 /mo · $310/yr
- Insurance
- −$17
- HOA
- −$0
- Vacancy / Maint / Mgmt
- −$207
- Net cashflow
- $527
Break-even live
Sensitivity live
| Price | -10% $550 | -5% $539 | +0% $527 | +5% $516 | +10% $505 |
|---|---|---|---|---|---|
| Rent | -10% $449 | -5% $488 | +0% $527 | +5% $566 | +10% $605 |
| Rate | -1.0pp $548 | -0.5pp $538 | base $527 | +0.5pp $517 | +1.0pp $507 |
UW: 25.0% down · 7.5% · 30yr · 1.5% tax · 5.0% vac · 8.0% maint · 8.0% mgmt
Financing live
Cash to close
- Down payment
- $9,975
- Closing costs
- $1,197
- Reserves months
- —
- Total cash needed
- —
Loan-product check · same deal, 3 products live
Conventional
25% down · 7.5% · 30yr
- Down + closing
- —
- Monthly P&I
- —
- Monthly cashflow
- —
- DSCR
- —
- Eligible?
- —
Personal DTI + credit; lowest rate.
DSCR
20% down · 8.5% · 30yr
- Down + closing
- —
- Monthly P&I
- —
- Monthly cashflow
- —
- DSCR
- —
- Eligible?
- —
No personal income docs; deal must DSCR.
Hard money
10% down · 12.0% · 12mo
- Down + closing
- —
- Monthly P&I
- —
- Monthly cashflow
- —
- DSCR
- —
- Eligible?
- —
Short-term bridge; refi at stabilization.
Rent comps 17 comps
| Address | Beds | Baths | Sqft | Rent | $/sqft | DOM | Units | Dist |
|---|---|---|---|---|---|---|---|---|
| 3160 Wyandotte St Baton Rouge, LA | 2.0 | 1.0 | 1100 | $800 | $0.73 | 44d | 1 | 0.42mi |
| 3567 Charles St Baton Rouge, LA | 3.0 | 1.0 | 1400 | $1,250 | $0.89 | 44d | 1 | 0.58mi |
| 2606 Weller Ave Baton Rouge, LA | 2.0 | 1.0 | 1000 | $650 | $0.65 | 44d | 1 | 0.58mi |
| 3859 Brady St Baton Rouge, LA | 2.0 | 1.0 | 800 | $775 | $0.97 | 44d | 1 | 0.64mi |
| 3936 Dalton St Baton Rouge, LA | 2.0 | 1.0 | 900 | $750 | $0.83 | 20d | 1 | 0.71mi |
| 2852 Dayton St Baton Rouge, LA | 2.0 | 1.0 | 1020 | $850 | $0.83 | 24d | 1 | 0.76mi |
| 2347 Rhodes Ave Baton Rouge, LA | 2.0 | 1.0 | 1250 | $950 | $0.76 | 20d | 1 | 0.98mi |
| 3577 Mission Dr Baton Rouge, LA | 2.0 | 1.0 | 755 | $950 | $1.26 | 20d | 1 | 1.03mi |
| 3647 Mission Dr Baton Rouge, LA | 3.0 | 1.0 | 900 | $895 | $0.99 | 24d | 1 | 1.05mi |
| 1404 N 29th St Baton Rouge, LA | 3.0 | 2.0 | 1120 | $1,100 | $0.98 | 44d | 1 | 1.07mi |
| 1847 N 16th St Baton Rouge, LA | 3.0 | 2.0 | 909 | $1,250 | $1.38 | 15d | 1 | 1.10mi |
| 1336 N 29th St Baton Rouge, LA | 3.0 | 2.0 | 1400 | $1,450 | $1.04 | 15d | 1 | 1.11mi |
| 1305 N 30th St Baton Rouge, LA | 2.0 | 1.0 | 1000 | $900 | $0.90 | 24d | 1 | 1.12mi |
| 4380 Mohican-Prescott Crossover Baton Rouge, LA | 2.0 | 2.0 | 910 | $1,055 | $1.16 | 44d | 1 | 1.17mi |
| 1409 N 35th St Baton Rouge, LA | 3.0 | 2.0 | 912 | $750 | $0.82 | 24d | 1 | 1.18mi |
| 1348 N 37th St Baton Rouge, LA | 3.0 | 1.0 | 1100 | $1,200 | $1.09 | 44d | 1 | 1.24mi |
| 3540 N Foster Dr Baton Rouge, LA | 2.0 | 1.0 | 1000 | $1,000 | $1.00 | 24d | 1 | 1.31mi |
Listing history 29 events
-
2026-06-18days on market $39,900 Active 96 DOM
-
2026-06-17days on market $39,900 Active 95 DOM
-
2026-06-16days on market $39,900 Active 94 DOM
-
2026-06-15days on market $39,900 Active 93 DOM
-
2026-06-14days on market $39,900 Active 91 DOM
-
2026-06-10days on market $39,900 Active 88 DOM
-
2026-06-09days on market $39,900 Active 87 DOM
-
2026-06-08days on market $39,900 Active 86 DOM
-
2026-06-07days on market $39,900 Active 85 DOM
-
2026-06-05days on market $39,900 Active 82 DOM
-
2026-06-03days on market $39,900 Active 81 DOM
-
2026-06-03price $39,900 Active 80 DOM
-
2026-06-02days on market $44,900 Active 80 DOM
-
2026-06-01days on market $44,900 Active 79 DOM
-
2026-05-31days on market $44,900 Active 78 DOM
-
2026-05-31days on market $44,900 Active 77 DOM
-
2026-04-15status Pending 519-char remark
Show marketing remark (519 chars)
Calling all DIY Owners of investors! This 3-bedroom, 1-bath home in the Istrouma area is a prime candidate for your next project. Situated on a fully fenced lot with a single carport, this property offers a solid footprint for a full restoration. The interior features a living room, formal dining room, and a massive eat-in kitchen with enough space to create a custom breakfast nook or secondary sitting area. Whether you're looking to flip or build your rental portfolio, this diamond in the rough is priced to move.
-
2026-04-15status Pending
Show marketing remark (519 chars)
Calling all DIY Owners of investors! This 3-bedroom, 1-bath home in the Istrouma area is a prime candidate for your next project. Situated on a fully fenced lot with a single carport, this property offers a solid footprint for a full restoration. The interior features a living room, formal dining room, and a massive eat-in kitchen with enough space to create a custom breakfast nook or secondary sitting area. Whether you're looking to flip or build your rental portfolio, this diamond in the rough is priced to move.
-
2026-01-30$44,900 Active 519-char remark
Show marketing remark (519 chars)
Calling all DIY Owners of investors! This 3-bedroom, 1-bath home in the Istrouma area is a prime candidate for your next project. Situated on a fully fenced lot with a single carport, this property offers a solid footprint for a full restoration. The interior features a living room, formal dining room, and a massive eat-in kitchen with enough space to create a custom breakfast nook or secondary sitting area. Whether you're looking to flip or build your rental portfolio, this diamond in the rough is priced to move.
-
2026-01-30$44,900 Active
Show marketing remark (519 chars)
Calling all DIY Owners of investors! This 3-bedroom, 1-bath home in the Istrouma area is a prime candidate for your next project. Situated on a fully fenced lot with a single carport, this property offers a solid footprint for a full restoration. The interior features a living room, formal dining room, and a massive eat-in kitchen with enough space to create a custom breakfast nook or secondary sitting area. Whether you're looking to flip or build your rental portfolio, this diamond in the rough is priced to move.
-
2025-10-11price $44,900
-
2025-10-11price $44,900
-
2025-09-10price $46,900
-
2025-09-10price $46,900
-
2025-08-05$47,900 Active
-
2025-08-05$47,900 Active
-
2005-11-28soldstatus
-
2004-08-17$30,000
-
2004-08-17$30,000
ⓘ Source: listings_history table (triggers on properties + properties_extension) + one-shot
backfill from property_details.listing_events for pre-trigger history.
Tax reassessment forecast LA · Resets to sale price
- Current annual tax
- $310 · $26/mo
- Projected year-2 tax
- $310 · $26/mo
- Expected delta
- $0/yr ($0/mo · 0.0%)
ⓘ Screening estimate from a state-policy table — verify with the county assessor before closing.
Climate risk First Street
- Flood 1/10 Low FEMA zone X (unshaded) · 0% chance over 30 yrs
- Wildfire 1/10 Low
- Heat 8/10 Severe 7 d/yr ≥108°F today · 19 d/yr by 30 yrs out
- Wind 9/10 Extreme 99% chance of damaging wind over 30 yrs
- Air quality 2/10 Low 1 unhealthy d/yr today · 1 by 30 yrs out
Nearby sold comps map
Loading sold comps map…
Walkable amenities ~0.75 mi
Loading nearby amenities…
Taxation est. · year 1
- Rental income
- $11,835
- − Mortgage interest
- −$2,235
- − Property taxes
- −$310
- − Insurance
- −$200
- − Repairs & maintenance
- −$947
- − Management
- −$947
- − Depreciation
- −$1,161
- Taxable income
- $6,036
- Est. tax owed @ 24.0%
- −$1,449
- After-tax cash flow
- $4,880/yr
For passive investors: Depreciation is non-cash, so a rental often shows a tax loss while cash-flowing — sheltering income. Rental losses are passive: they offset passive income freely, and up to $25,000/yr can offset ordinary (W-2) income if you actively participate and your MAGI is under $100k (phasing out to $0 by $150k); unused losses carry forward. On sale, claimed depreciation is recaptured at up to 25%, and gains may owe capital-gains tax (a 1031 exchange can defer both). Figures are a year-1 estimate at your 24.0% rate — not tax advice; consult a CPA.
Schools (NCES district)
- District
- East Baton Rouge Parish
- NCES district ID
- 2200540
- Math proficiency
- 22% ▼ -36.00%
- Reading proficiency
- 34% ▼ -31.00%
- Median HH income
- $46,263
- Composite
- 24.14/100
- National rank
- #7745
- State rank
- #47 of 98 in LA
Livability — Baton Rouge
- Score
- 74/100
- State rank
- #24
- US rank
- #4535
Category grades
Schools grade is shown separately in the Schools card above.
Census & demographics
- Census place
- Baton Rouge, LA
- County
- East Baton Rouge Parish · 399,686 people
- City population
- 351,868
- Metro
- Baton Rouge, LA
- Population (ZIP)
- 23,288
- Household income
- $25,397
- Rent vs Own
- Severe rent burden
- 1980.0
Population outlook (East Baton Rouge County) Hauer SSP2
- Today (2025)
- 464,810 people
- By 2030
- 472,137 · +1.6%
- By 2040
- 480,243 · +3.3%
- By 2050
- 484,422 · +4.2%
- By 2075
- 492,069 · +5.9%
- By 2100
- 476,347 · +2.5%
Race, ethnicity, and origin ACS 2023
- Neighborhood character
- Predominantly Black (95%)
- Race & ethnicity
- Black 95% Hispanic / Latino 2% White 2% Two or more races 1%
- Common ancestry
- Lithuanian 1%
- Foreign-born
- 1% · Canada
- Languages at home
- 98% English-only · Spanish 1%
Political lean MEDSL · East Baton Rouge
- 2024 margin
- D (+11.1) · D 54.5% · R 43.4% · Other 2.1%
- 2008→2024 swing
- +8.9pp toward D · 2008: 2.2pp · 2024: 11.1pp
- All cycles
- 2024: D+11.1 2020: D+13.1 2016: D+9.2 2012: D+5.2 2008: D+2.2
Not yet ingested
- Civics
- —
Market trends
- HPI YoY
- ▼ -110.79%
- Current HPI
- 75.7121
- Rent YoY
- ▼ -1.21%
- Metro
- Baton Rouge, LA
- State GDP YoY
- ▲ 3.29%
- F500 in state
- 10
Industry mix (Fortune 500 HQ in LA)
| Industry | F500 HQs | Revenue |
|---|---|---|
| Telecommunications | 2 | $23B |
|
||
| Utilities | 1 | $12B |
|
||
| Wholesale / Distribution | 1 | $5B |
|
||
| Advertising | 1 | $2B |
|
||
Price history
+49.7% since first listed13 events — show timeline
- 2026-04-15 Pending — AcadianaMLS
- 2026-04-15 Pending — GBRMLS
- 2026-01-30 Listed $44,900 GBRMLS
- 2026-01-30 Listed $44,900 AcadianaMLS
- 2025-10-11 Price Changed $44,900 AcadianaMLS
- 2025-10-11 Price Changed $44,900 GBRMLS
- 2025-09-10 Price Changed $46,900 AcadianaMLS
- 2025-09-10 Price Changed $46,900 GBRMLS
- 2025-08-05 Listed $47,900 GBRMLS
- 2025-08-05 Listed $47,900 AcadianaMLS
- 2005-11-28 Sold (Public Records) — Public Records
- 2004-08-17 Listed $30,000 AcadianaMLS
- 2004-08-17 Listed $30,000 GBRMLS
Property tax history
+2.7%/yrLatest (2025): $310 · +4.7% YoY. Source: county tax records.
Cash-flow waterfall
monthlySold comps — $/sqft
last 12 mo · ≤1 miLoading sold comps…