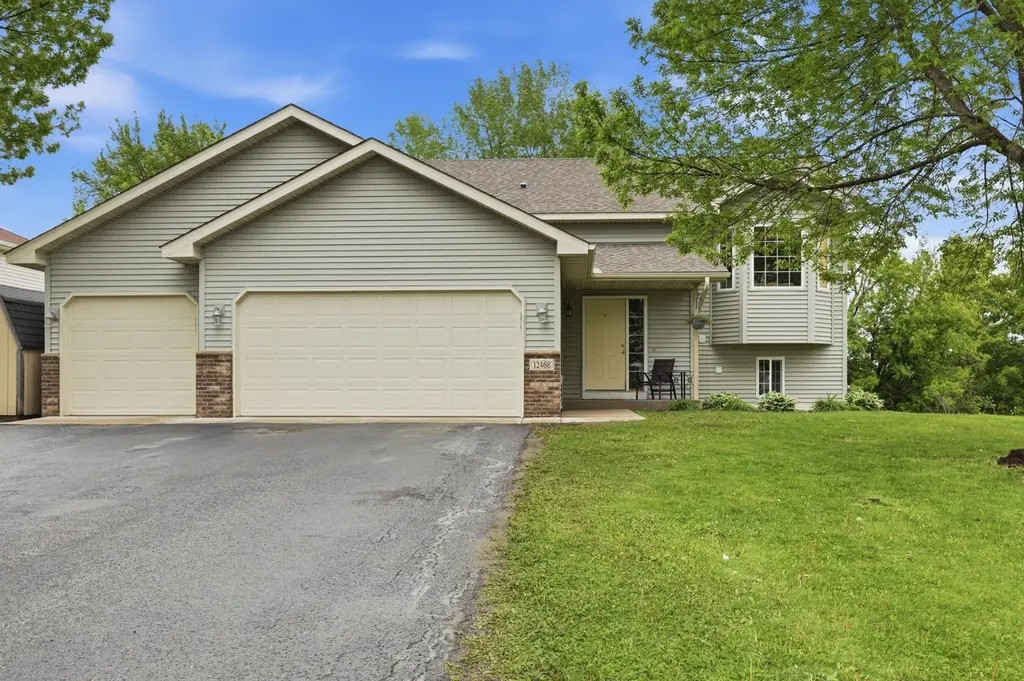
12468 65th St NE · Otsego, MN
Flood risk 7/10 · Major
- FEMA flood zone
- —
- Chance of flooding over 30 yrs
- 0.77%
- Est. flood insurance / yr
- —
Fire risk 1/10 · Minimal
- Est. fire insurance / yr
- $888 – $1,650
Heat risk 2/10 · Minimal
- Hot days now (above 98°F)
- 7 days/yr
- Hot days in 30 yrs
- 14 days/yr
Wind risk 2/10 · Minimal
- Chance of severe wind over 30 yrs
- —
Air-quality risk 2/10 · Minimal
- Unhealthy air days now
- 1 days/yr
- Unhealthy air days in 30 yrs
- 2 days/yr
Risk factors via First Street. Map © Google.
Why this score? — see what drove the C- grade
The composite is a weighted blend of 9 inputs, each scored 0–100. Each bar is that input's sub-score; the figure is the points it added to the 100-point composite (weight × sub-score).
- Cash flow +18.8/30.0
- ARV discount +7.5/15.0
- DSCR +5.9/10.0
- Schools +5.2/10.0
- 1% rule +4.5/10.0
- Livability +3.5/5.0
- Rent growth +2.5/5.0
- Condition / age +2.5/5.0
- Appreciation +0.0/10.0
$380,000
🖨 Deal sheet (PDF) 📄 Offer letter ✓ Due diligence
Listing remarks MLS
All information is approximate and estimated. Agents & buyers to verify all. Agents please view agent remarks. Clean home, move in ready. Partially finished lower level with walk out. 3 br on one level.
Key facts
- Open floor plan
- 240 volt outlet
- Raspberry bushes
Tags
Property features AI
Exterior
- Parking: Attached garage with 3 spaces
- Utilities: City water connected; City sewer connected; Natural gas
- Home design: Residential property; Split-entry (bi-level) design; Entry level details include living areas on one level
- Construction: Block foundation; Roof replaced within the last 8 years
- Exterior features: Vinyl exterior; Storage shed; City-maintained paved streets
Interior
- Kitchen: Main kitchen on upper level; Second kitchen on lower level
- Bedrooms: 4 bedrooms total; Primary bedroom and additional bedrooms on the upper level; One bedroom located on the lower level
- Bathrooms: 2 full bathrooms
- Heating & cooling: Forced air heating; Central air conditioning
- Interior features: Finished lower-level living space; Walkout basement; Block foundation; Fireplace (1)
- Laundry & utility: Lower-level laundry room
Neighborhood map
What this means for you Summary
Snapshot
- This is a 4-bed/2.0-bath single-family listed at $380k.
Deal economics
- At list price, monthly cash flow is $386 ($5k/yr) — positive.
- The deal already cash-flows at list — no discount required.
- To meet the 1% rule (rent ≥ 1% of price), the offer needs to be $360k (5.3% below list).
- Recommended offer: $360k (5.3% below list) — sets the bar for 1% rule.
- Cap rate 7.5% vs local median 4.0% in Otsego — top-decile yield for the area; either an underpriced asset or a hidden risk that comps aren't pricing in. Stress-test before assuming the spread holds.
Location & tenants
- Location reads 69/100 on livability (#367 in MN) — a middle-class / working-renter tenant base. Strengths: employment A+, housing A+, crime A-; Watch: cost of living C-, amenities F, commute F.
- Independent School District 728 (suburban): math 56% / reading 60% proficiency, ranked #37 of 301 in MN (top 12%) — acceptable for families but not a draw, mixed tenant base, ~2y average lease; only 14% free/reduced lunch — higher-income household profile.
- Zoned schools: Rogers Elementary (math 69% / reading 70%, grade A-, #74 of 857 statewide, top 10%, 627 students, 12% FRL); Rogers Middle School (math 61% / reading 63%, grade B+, #19 of 258 statewide, top 8%, 979 students, 16% FRL); Rogers Senior High (math 66% / reading 64%, grade B, #28 of 471 statewide, top 6%, 1,740 students, 18% FRL) — zoned schools at 15% FRL track the district average.
- Market conditions: 143 active listings in the ZIP; 2 comparable units currently listed for rent nearby; high-income renter base; 1,260 units permitted in Wright County in 2024 (180 in 5+ unit buildings).
- This rent runs 33% of the median local income ($129k/yr) — at the standard rent-burdened threshold; future hikes will face affordability resistance.
Forward outlook
- Local home prices are declining (-3.0%/yr); year-one equity from $3k of loan paydown is wiped out by about $11k of value loss. Plan a longer hold.
- Wright County population projected at +9% by 2050 — modest demand growth; plan on rents tracking national, not racing it.
Negotiation context
- Only 9 days on market — expect competitive offers; lowballing is unlikely to land.
- 2 sale attempts since 18y ago with the ask held roughly flat each time — persistent listings suggest the price (not the market) is what's stuck; bring a comps-based counter.
- Current owner paid $300k; 27% above their basis — modest negotiation headroom, anchor on the comps not their cost.
Risks & watch-outs
- Climate carrying-cost: major flood risk — expect insurance premiums to compound above CPI over the hold.
Questions for the listing agent
- Is there a deadline driving the sale (1031 exchange, divorce, estate, relocation)? That informs how much negotiation room exists.
- Schools are B-rated — typically a magnet for longer-tenancy family renters. What's the average tenant stay here, and is there a school-zone premium baked into asking?
- What's the average days-on-market for RENTAL listings here right now (not sales)? A rising rental-DOM trend means longer vacancies and softer asking-rent achievability than the comps imply.
- What's the recent tenant-quality profile in this submarket — average credit score on applications, eviction rate, late-payment / NSF rate, and stable-employment percentage? A property-management company in the area should have these aggregated.
- How much new for-sale + rental construction is in the pipeline within 1–3 miles? Heavy new supply typically softens prices + rents 12–24 months out; constrained supply supports both.
Investment metrics
- 1% rule
- 0.95% ✗
- Cap rate
- 7.51%
- Cash-on-cash
- 4.35%
- DSCR
- 1.19
- GRM
- 8.8
CMA / ARV
No comps found within radius.
Projected returns pro-forma
-3.0% appreciation · 3.0% rent growth · sell at horizon
- IRR
- -9.5%
- Equity multiple
- 0.65×
- Total profit
- $-37,045
- Equity at exit
- $56,659
- IRR
- -0.1%
- Equity multiple
- 0.99×
- Total profit
- $-807
- Equity at exit
- $32,855
Cash invested: $106,400 (down + closing). Projections, not guarantees.
Landlord ↔ Tenant lean methodology
- Overall (STATE)
- 46 Balanced
- State Minnesota
- 46 Balanced · D+2
- County
- — inherits STATE
- City
- — inherits STATE
ZIP-level market 55301
- Home prices YoY
- -14.2%
- Active inventory
- 143
- Price-to-rent
- 8.8×
Monthly cashflow live
- Estimated rent
- $3,600 medium interval (Pro) →
- Mortgage (P&I)
- −$1,993
- Tax from tax record
- −$307 /mo · $3,680/yr
- Insurance
- −$158
- HOA
- −$0
- Vacancy / Maint / Mgmt
- −$756
- Net cashflow
- $386
Break-even live
Sensitivity live
| Price | -10% $601 | -5% $493 | +0% $386 | +5% $278 | +10% $171 |
|---|---|---|---|---|---|
| Rent | -10% $102 | -5% $244 | +0% $386 | +5% $528 | +10% $670 |
| Rate | -1.0pp $577 | -0.5pp $483 | base $386 | +0.5pp $287 | +1.0pp $187 |
UW: 25.0% down · 7.5% · 30yr · 1.5% tax · 5.0% vac · 8.0% maint · 8.0% mgmt
Financing live
Cash to close
- Down payment
- $95,000
- Closing costs
- $11,400
- Reserves months
- —
- Total cash needed
- —
Loan-product check · same deal, 3 products live
Conventional
25% down · 7.5% · 30yr
- Down + closing
- —
- Monthly P&I
- —
- Monthly cashflow
- —
- DSCR
- —
- Eligible?
- —
Personal DTI + credit; lowest rate.
DSCR
20% down · 8.5% · 30yr
- Down + closing
- —
- Monthly P&I
- —
- Monthly cashflow
- —
- DSCR
- —
- Eligible?
- —
No personal income docs; deal must DSCR.
Hard money
10% down · 12.0% · 12mo
- Down + closing
- —
- Monthly P&I
- —
- Monthly cashflow
- —
- DSCR
- —
- Eligible?
- —
Short-term bridge; refi at stabilization.
Rent comps 2 comps
| Address | Beds | Baths | Sqft | Rent | $/sqft | DOM | Units | Dist |
|---|---|---|---|---|---|---|---|---|
| 7535 Lannon Ave NE Albertville, MN | 5.0 | 3.0 | 2209 | $3,179 | $1.44 | 0d | 1 | 1.20mi |
| 11193 68th St NE Unit NA Albertville, MN | 3.0 | 3.0 | 2644 | $3,250 | $1.23 | 0d | 1 | 1.36mi |
Listing history 12 events
-
2026-06-07status $380,000 Pending 9 DOM
-
2026-06-04days on market $380,000 Active 9 DOM
-
2026-06-03days on market $380,000 Active 8 DOM
-
2026-06-02remarks 699-char remark
-
2026-06-02days on market $380,000 Active 7 DOM
-
2026-06-01days on market $380,000 Active 6 DOM
-
2026-05-31days on market $380,000 Active 5 DOM
-
2026-05-26$380,000 Active
-
2023-06-05soldstatus $300,000
-
2008-10-28soldstatus $145,000 210-char remark
Show marketing remark (210 chars)
All information is approximate and estimated. Agents & buyers to verify all. Agents please view agent remarks. Clean home, move in ready. Partially finished lower level with walk out. 3 br on one level.
-
2008-10-01historical 210-char remark
Show marketing remark (210 chars)
All information is approximate and estimated. Agents & buyers to verify all. Agents please view agent remarks. Clean home, move in ready. Partially finished lower level with walk out. 3 br on one level.
-
2008-07-08$154,900 210-char remark
Show marketing remark (210 chars)
All information is approximate and estimated. Agents & buyers to verify all. Agents please view agent remarks. Clean home, move in ready. Partially finished lower level with walk out. 3 br on one level.
ⓘ Source: listings_history table (triggers on properties + properties_extension) + one-shot
backfill from property_details.listing_events for pre-trigger history.
Tax reassessment forecast MN · Partial reset (capped growth)
- Current annual tax
- $3,680 · $307/mo
- Projected year-2 tax
- $3,968 · $331/mo
- Expected delta
- +$288/yr (+$24/mo · 7.8%)
ⓘ Screening estimate from a state-policy table — verify with the county assessor before closing.
Climate risk First Street
- Flood 7/10 Severe 77% chance over 30 yrs
- Wildfire 1/10 Low
- Heat 2/10 Low 7 d/yr ≥98°F today · 14 d/yr by 30 yrs out
- Wind 2/10 Low
- Air quality 2/10 Low 1 unhealthy d/yr today · 2 by 30 yrs out
Nearby sold comps map
Loading sold comps map…
Walkable amenities ~0.75 mi
Loading nearby amenities…
Taxation est. · year 1
- Rental income
- $43,195
- − Mortgage interest
- −$21,286
- − Property taxes
- −$3,680
- − Insurance
- −$1,900
- − Repairs & maintenance
- −$3,456
- − Management
- −$3,456
- − Depreciation
- −$11,055
- Taxable loss
- −$1,636
- Est. tax savings @ 24.0%
- +$393
- After-tax cash flow
- $5,024/yr
For passive investors: Depreciation is non-cash, so a rental often shows a tax loss while cash-flowing — sheltering income. Rental losses are passive: they offset passive income freely, and up to $25,000/yr can offset ordinary (W-2) income if you actively participate and your MAGI is under $100k (phasing out to $0 by $150k); unused losses carry forward. On sale, claimed depreciation is recaptured at up to 25%, and gains may owe capital-gains tax (a 1031 exchange can defer both). Figures are a year-1 estimate at your 24.0% rate — not tax advice; consult a CPA.
Schools (NCES district)
- District
- Independent School District 728
- NCES district ID
- 2711370
- Math proficiency
- 56% ▼ -15.00%
- Reading proficiency
- 60% ▼ -10.00%
- Median HH income
- $82,336
- Composite
- 52.5/100
- National rank
- #1567
- State rank
- #37 of 301 in MN
Livability — Otsego
- Score
- 69/100
- State rank
- #367
- US rank
- #8641
Category grades
Schools grade is shown separately in the Schools card above.
Census & demographics
- Census place
- Otsego, MN
- County
- Wright County · 79,164 people
- Metro
- Minneapolis-St. Paul-Bloomington, MN-WI
- Population (ZIP)
- 13,482
- Household income
- $129,232
- Rent vs Own
- Severe rent burden
- 50.0
Population outlook (Wright County) Hauer SSP2
- Today (2025)
- 142,526 people
- By 2030
- 146,915 · +3.1%
- By 2040
- 153,625 · +7.8%
- By 2050
- 155,416 · +9.0%
- By 2075
- 150,352 · +5.5%
- By 2100
- 130,631 · -8.3%
Race, ethnicity, and origin ACS 2023
- Neighborhood character
- Predominantly White (85%)
- Race & ethnicity
- White 85% Black 7% Two or more races 5% Asian 2%
- Common ancestry
- Portuguese 10% Romanian 5% Lithuanian 4%
- Foreign-born
- 7% · South Korea, China, Canada
Political lean MEDSL · Wright
- 2024 margin
- Strong R (+29.4) · D 34.4% · R 63.8% · Other 1.8%
- 2008→2024 swing
- -11.9pp toward R · 2008: -17.4pp · 2024: -29.4pp
- All cycles
- 2024: R+29.4 2020: R+28.6 2016: R+33.2 2012: R+21.4 2008: R+17.4
Not yet ingested
- Civics
- —
Market trends
- HPI YoY
- ▼ -38.52%
- Current HPI
- 233.6299
- Rent YoY
- —
- Metro
- Minneapolis-St. Paul-Bloomington, MN-WI
- State GDP YoY
- ▲ 2.41%
- F500 in state
- 34
Industry mix (Fortune 500 HQ in MN)
| Industry | F500 HQs | Revenue |
|---|---|---|
| Healthcare | 2 | $407B |
|
||
| Retail | 2 | $150B |
|
||
| Consumer Goods | 2 | $32B |
|
||
| Industrial Machinery | 2 | $6B |
|
||
| Agriculture | 1 | $40B |
|
||
| Healthcare / Medical Devices | 1 | $32B |
|
||
Price history
+145.3% since first listed5 events — show timeline
- 2026-05-26 Listed $380,000 NORTHSTARMLS as Distributed by MLS Grid
- 2023-06-05 Sold (Public Records) $300,000 Public Records
- 2008-10-28 Sold (MLS) $145,000 NORTHSTARMLS as Distributed by MLS Grid
- 2008-10-01 Listing Removed — NORTHSTARMLS as Distributed by MLS Grid
- 2008-07-08 Listed $154,900 NORTHSTARMLS as Distributed by MLS Grid
Property tax history
+4.4%/yrLatest (2025): $3,680 · -5.1% YoY. Source: county tax records.
Cash-flow waterfall
monthlySold comps — $/sqft
last 12 mo · ≤1 miLoading sold comps…