15716 Terrace Dr #3 · Oak Forest, IL
Flood risk 1/10 · Minimal
- FEMA flood zone
- X (unshaded)
- Chance of flooding over 30 yrs
- 0.0%
- Est. flood insurance / yr
- $507 – $1,088
Fire risk 1/10 · Minimal
- Est. fire insurance / yr
- $804 – $1,492
Heat risk 3/10 · Minor
- Hot days now (above 101°F)
- 7 days/yr
- Hot days in 30 yrs
- 15 days/yr
Wind risk 2/10 · Minimal
- Chance of severe wind over 30 yrs
- —
Air-quality risk 4/10 · Minor
- Unhealthy air days now
- 4 days/yr
- Unhealthy air days in 30 yrs
- 5 days/yr
Risk factors via First Street. Map © Google.
Why this score? — see what drove the C grade
The composite is a weighted blend of 9 inputs, each scored 0–100. Each bar is that input's sub-score; the figure is the points it added to the 100-point composite (weight × sub-score).
- Cash flow +23.5/30.0
- 1% rule +7.8/10.0
- DSCR +7.5/10.0
- ARV discount +7.5/15.0
- Livability +4.2/5.0
- Rent growth +2.5/5.0
- Condition / age +2.5/5.0
- Schools +1.5/10.0
- Appreciation +0.0/10.0
$130,000
🖨 Deal sheet (PDF) 📄 Offer letter ✓ Due diligence
Listing remarks
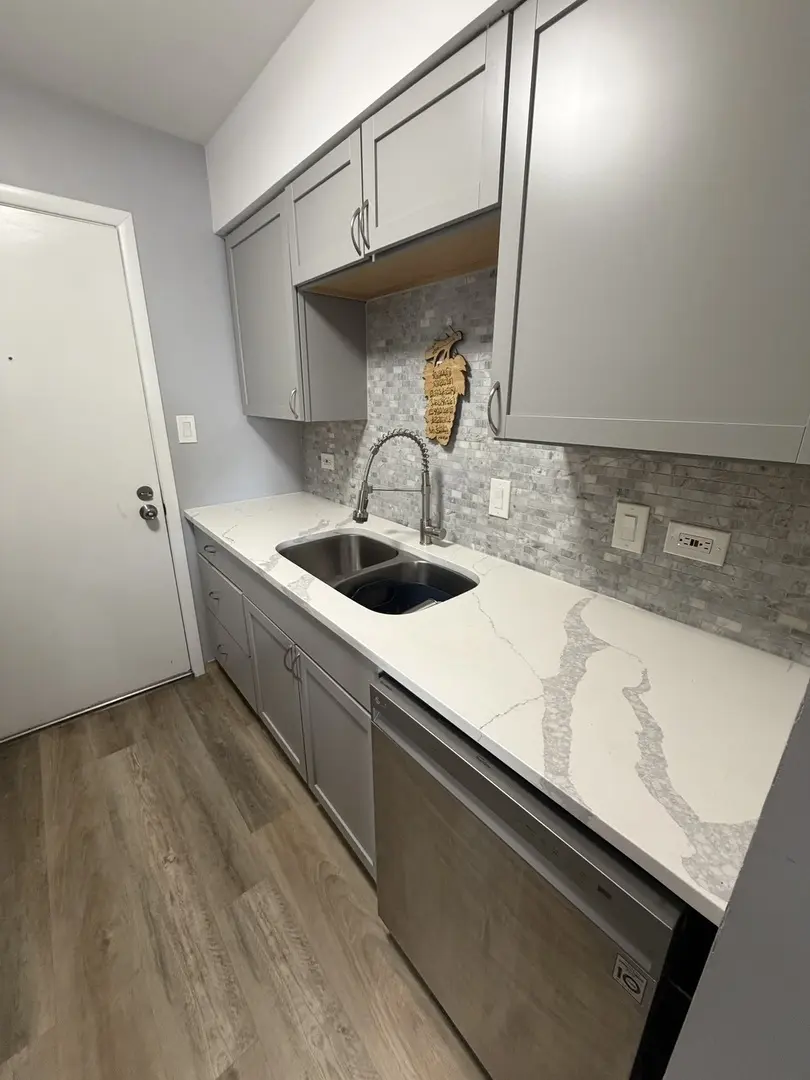
Broker owned and fully updated! This spacious 3rd-floor 1-bedroom features a large walk-in closet and a brand-new kitchen with quartz countertops and stainless steel appliances. The bathroom has been beautifully remodeled with fresh tile, vanity, and a new toilet. Convenient laundry is available on the main level. Includes one designated parking spot in the lot, plus plenty of street parking. This condo is also a great rental opportunity.
Key facts
- Quartz countertops
- Remodeled bathroom
- Walk-in closet
Tags
Property features AI
Finance
- Other: Part of a 6-unit building; Common lot designation
- HOA & community: Monthly association fee of $204; Association covers water, parking, insurance, security, clubhouse, pool, exterior maintenance, lawn care, scavenger (trash), and snow removal; Association amenities include coin laundry, storage, on-site manager/engineer, pool, security door locks, and ceiling fan; Pets allowed (cats OK), max pet weight ~30 lbs
Exterior
- Parking: Assigned parking (1 space)
- Security: Security door locks (association amenity)
- Utilities: Public water; Public sewer
- Home design: Attached single property; Condo ownership; Entry on 3rd level; Rehab completed in 2023; Estimated living area; Built ~51–60 years ago
- Construction: Brick construction
- Exterior features: Balcony; Balcony/porch on third level (4 x 8)
Interior
- Kitchen: Kitchen on third level (15 x 10)
- Bedrooms: 1 bedroom (master bedroom on third level, 16 x 14); Additional bedroom(s) listed
- Flooring: Ceramic tile in laundry
- Bathrooms: 1 full bathroom
- Heating & cooling: Electric heating; Window unit(s) for cooling
- Interior features: Storage; Walk-in closet(s); 4 total rooms
- Laundry & utility: Common area laundry; Laundry room on main level (8 x 8)
Neighborhood map
What this means for you Summary
Snapshot
- This is a 1-bed/1.0-bath condo listed at $130k.
Deal economics
- At list price, monthly cash flow is $242 ($3k/yr) — positive.
- The deal already cash-flows at list — no discount required.
- Meets the 1% rule at list price ($2k rent vs $130k).
- Recommended offer: $128k (1.5% below list) — sets the bar for market timing.
- Cap rate 8.5% vs local median 4.5% in Oak Forest — top-decile yield for the area; either an underpriced asset or a hidden risk that comps aren't pricing in. Stress-test before assuming the spread holds.
Location & tenants
- Location reads 85/100 on livability (#28 in IL, #501 nationally) — a professional / high-income tenant draw. Strengths: crime A+, commute A+, employment A+; Watch: amenities F.
- Bremen Chsd 228 (suburban): math 15% / reading 17% proficiency, ranked #468 of 620 in IL (top 76%) — low school quality limits family demand, transient renter base, plan for 1-2y turnover.
- Zoned schools: Scarlet Oak Elementary School (math 12% / reading 22%, grade F, #1,141 of 2,056 statewide, top 59%, 225 students, 0% FRL); Arbor Park Middle School (math 11% / reading 19%, grade F, #501 of 665 statewide, top 77%, 486 students, 0% FRL); Oak Forest High School (math 26% / reading 26%, grade F, #244 of 693 statewide, top 35%, 1,370 students, 0% FRL).
- Market conditions: 52 active listings in the ZIP; 9 comparable units currently listed for rent nearby; rentals leasing fast (median 5d on market — plan ~1-2 weeks tenant-placement turnaround); solid renter incomes; 6,272 units permitted in Cook County in 2024 (4,658 in 5+ unit buildings).
Forward outlook
- Local home prices are declining (-3.0%/yr); year-one equity from $899 of loan paydown is wiped out by about $4k of value loss. Plan a longer hold.
Negotiation context
- It's been on market 19 days — a 2% lower offer ($128k) is reasonable based on typical stale-listing flexibility.
- 2 sale attempts with the ask held roughly flat each time — persistent listings suggest the price (not the market) is what's stuck; bring a comps-based counter.
- Current owner paid $43k; list at $130k implies a 202% gain — meaningful room to come down on a strong offer.
Questions for the listing agent
- Built in 1975 — when were the roof, HVAC, electrical panel, plumbing, and water heater last replaced?
- What does the HOA fee cover, when was the last increase, and are there any pending special assessments or reserve-fund shortfalls?
- Any open or pending special assessments — roof, HVAC, plumbing, elevator, façade? What's the per-unit balance and payoff schedule, and is the seller paying it off at close or rolling it to the buyer?
- Is there a deadline driving the sale (1031 exchange, divorce, estate, relocation)? That informs how much negotiation room exists.
- What's the average days-on-market for RENTAL listings here right now (not sales)? A rising rental-DOM trend means longer vacancies and softer asking-rent achievability than the comps imply.
- What's the recent tenant-quality profile in this submarket — average credit score on applications, eviction rate, late-payment / NSF rate, and stable-employment percentage? A property-management company in the area should have these aggregated.
- How much new apartment / multifamily construction is in the pipeline within 1–3 miles? Heavy new supply (>2% of stock underway) typically softens rents 12–24 months out; light construction supports rent growth.
Investment metrics
- 1% rule
- 1.28% ✓
- Cap rate
- 8.52%
- Cash-on-cash
- 7.97%
- DSCR
- 1.35
- GRM
- 6.5
CMA / ARV
No comps found within radius.
Projected returns pro-forma
-3.0% appreciation · 3.0% rent growth · sell at horizon
- IRR
- -4.1%
- Equity multiple
- 0.85×
- Total profit
- $-5,534
- Equity at exit
- $19,383
- IRR
- 5.7%
- Equity multiple
- 1.43×
- Total profit
- $15,548
- Equity at exit
- $11,240
Cash invested: $36,400 (down + closing). Projections, not guarantees.
Landlord ↔ Tenant lean methodology
- Overall (STATE)
- 43 Moderately Tenant-Leaning
- State Illinois
- 43 Moderately Tenant-Leaning · D+7
- County
- — inherits STATE
- City
- — inherits STATE
ZIP-level market 60452
- Active inventory
- 52
- Price-to-rent
- 6.5×
Monthly cashflow live
- Estimated rent
- $1,664 high interval (Pro) →
- Mortgage (P&I)
- −$682
- Tax from tax record
- −$133 /mo · $1,591/yr
- Insurance
- −$54
- HOA
- −$204
- Vacancy / Maint / Mgmt
- −$349
- Net cashflow
- $242
Break-even live
Sensitivity live
| Price | -10% $315 | -5% $279 | +0% $242 | +5% $205 | +10% $168 |
|---|---|---|---|---|---|
| Rent | -10% $110 | -5% $176 | +0% $242 | +5% $308 | +10% $373 |
| Rate | -1.0pp $307 | -0.5pp $275 | base $242 | +0.5pp $208 | +1.0pp $174 |
UW: 25.0% down · 7.5% · 30yr · 1.5% tax · 5.0% vac · 8.0% maint · 8.0% mgmt
Financing live
Cash to close
- Down payment
- $32,500
- Closing costs
- $3,900
- Reserves months
- —
- Total cash needed
- —
Loan-product check · same deal, 3 products live
Conventional
25% down · 7.5% · 30yr
- Down + closing
- —
- Monthly P&I
- —
- Monthly cashflow
- —
- DSCR
- —
- Eligible?
- —
Personal DTI + credit; lowest rate.
DSCR
20% down · 8.5% · 30yr
- Down + closing
- —
- Monthly P&I
- —
- Monthly cashflow
- —
- DSCR
- —
- Eligible?
- —
No personal income docs; deal must DSCR.
Hard money
10% down · 12.0% · 12mo
- Down + closing
- —
- Monthly P&I
- —
- Monthly cashflow
- —
- DSCR
- —
- Eligible?
- —
Short-term bridge; refi at stabilization.
Rent comps 9 comps
| Address | Beds | Baths | Sqft | Rent | $/sqft | DOM | Units | Dist |
|---|---|---|---|---|---|---|---|---|
| 15737 Thomas Ln Oak Forest, IL | 2.0 | 1.0 | 1000 | $1,595 | $1.59 | 26d | 1 | 0.18mi |
| 15700 Reynolds Ln Unit 1 Oak Forest, IL | 2.0 | 1.0 | 900 | $1,900 | $2.11 | 0d | 1 | 0.18mi |
| 16703 Lakewood Dr Tinley Park, IL | 1.0–2.0 | 1.0–2.0 | 972 | $1,285 | $1.32 | 0d | 1 | 1.25mi |
| 14700 Central Ave Oak Forest, IL | 1.0–2.0 | 1.0 | 775 | $1,125 | $1.45 | 26d | 6 | 1.35mi |
| 5910 Lake Bluff Dr Tinley Park, IL | 1.0 | 1.0 | 956 | $1,775 | $1.86 | 4d | 1 | 1.40mi |
| 4800 W 157th St Oak Forest, IL | 1.0–2.0 | 1.0–2.0 | 1151 | $1,725 | $1.50 | 0d | 3 | 1.50mi |
| 4800 157th St Oak Forest, IL | 1.0 | 1.0 | 573 | $1,725 | $3.01 | 17d | 1 | 1.50mi |
| 4800 157th St Oak Forest, IL | 1.0 | 1.0 | 673 | $1,925 | $2.86 | 26d | 1 | 1.50mi |
| 4800 157th St Oak Forest, IL | 2.0 | 2.0 | 1031 | $2,660 | $2.58 | 0d | 1 | 1.50mi |
HOA detail condo
- Monthly dues
- $204 · $2,448/yr
- Assessments
- None detected in remarks — confirm with the listing agent.
Listing history 12 events
-
2026-06-21days on market $130,000 Active 19 DOM
-
2026-06-18days on market $130,000 Active 16 DOM
-
2026-06-17days on market $130,000 Active 15 DOM
-
2026-06-16days on market $130,000 Active 14 DOM
-
2026-06-15days on market $130,000 Active 13 DOM
-
2026-06-13days on market $130,000 Active 11 DOM
-
2026-06-09days on market $130,000 Active 7 DOM
-
2026-06-08days on market $130,000 Active 6 DOM
-
2026-06-07days on market $130,000 Active 5 DOM
-
2026-06-04days on market $130,000 Active 2 DOM
-
2026-06-02remarks 442-char remark
-
2026-06-02$130,000 Active 1 DOM
ⓘ Source: listings_history table (triggers on properties + properties_extension) + one-shot
backfill from property_details.listing_events for pre-trigger history.
Tax reassessment forecast IL · Partial reset (capped growth)
- Current annual tax
- $1,591 · $133/mo
- Projected year-2 tax
- $2,271 · $189/mo
- Expected delta
- +$680/yr (+$57/mo · 42.7%)
ⓘ Screening estimate from a state-policy table — verify with the county assessor before closing.
Climate risk First Street
- Flood 1/10 Low FEMA zone X (unshaded) · 0% chance over 30 yrs
- Wildfire 1/10 Low
- Heat 3/10 Moderate 7 d/yr ≥101°F today · 15 d/yr by 30 yrs out
- Wind 2/10 Low
- Air quality 4/10 Moderate 4 unhealthy d/yr today · 5 by 30 yrs out
Nearby sold comps map
Loading sold comps map…
Walkable amenities ~0.75 mi
Loading nearby amenities…
Taxation est. · year 1
- Rental income
- $19,964
- − Mortgage interest
- −$7,282
- − Property taxes
- −$1,591
- − Insurance
- −$650
- − Repairs & maintenance
- −$1,597
- − Management
- −$1,597
- − HOA
- −$2,448
- − Depreciation
- −$3,782
- Taxable income
- $1,017
- Est. tax owed @ 24.0%
- −$244
- After-tax cash flow
- $2,657/yr
For passive investors: Depreciation is non-cash, so a rental often shows a tax loss while cash-flowing — sheltering income. Rental losses are passive: they offset passive income freely, and up to $25,000/yr can offset ordinary (W-2) income if you actively participate and your MAGI is under $100k (phasing out to $0 by $150k); unused losses carry forward. On sale, claimed depreciation is recaptured at up to 25%, and gains may owe capital-gains tax (a 1031 exchange can defer both). Figures are a year-1 estimate at your 24.0% rate — not tax advice; consult a CPA.
Schools (NCES district)
- District
- Bremen Chsd 228
- NCES district ID
- 1707050
- Math proficiency
- 15% ▼ -4.00%
- Reading proficiency
- 17% ▼ -5.00%
- Median HH income
- $57,625
- Composite
- 15.32/100
- National rank
- #9327
- State rank
- #468 of 620 in IL
Livability — Oak Forest
- Score
- 85/100
- State rank
- #28
- US rank
- #501
Category grades
Schools grade is shown separately in the Schools card above.
Census & demographics
- Census place
- Oak Forest, IL
- County
- Cook County · 4,486,803 people
- City population
- 26,739
- Metro
- Chicago-Naperville-Elgin, IL-IN-WI
- Population (ZIP)
- 26,739
- Household income
- $93,076
- Rent vs Own
- Severe rent burden
- 299.0
Population outlook (Cook County) Hauer SSP2
- Today (2025)
- 5,347,519 people
- By 2030
- 5,357,703 · +0.2%
- By 2040
- 5,324,924 · -0.4%
- By 2050
- 5,230,762 · -2.2%
- By 2075
- 4,785,735 · -10.5%
- By 2100
- 4,188,836 · -21.7%
Race, ethnicity, and origin ACS 2023
- Neighborhood character
- Majority White (65%)
- Race & ethnicity
- White 65% Hispanic / Latino 18% Two or more races 10% Black 8% Asian 6%
- Hispanic origin (detail)
- Mexican 16% Puerto Rican 1%
- Common ancestry
- Romanian 13% Iranian 1% Lithuanian 1%
- Foreign-born
- 14% · Canada, Dominican Republic, China
- Languages at home
- 77% English-only · Spanish 12% Other Indo-European 4% Arabic 2%
Political lean MEDSL · Cook
- 2024 margin
- Solid D (+42.0) · D 70.4% · R 28.4% · Other 1.2%
- 2008→2024 swing
- -11.4pp toward R · 2008: 53.4pp · 2024: 42.0pp
- All cycles
- 2024: D+42.0 2020: D+50.3 2016: D+53.0 2012: D+49.4 2008: D+53.4
Not yet ingested
- Civics
- —
Market trends
- HPI YoY
- ▼ -228.62%
- Current HPI
- 205.0118
- Rent YoY
- —
- Metro
- Chicago-Naperville-Elgin, IL-IN-WI
- State GDP YoY
- ▲ 1.59%
- F500 in state
- 60
Industry mix (Fortune 500 HQ in IL)
| Industry | F500 HQs | Revenue |
|---|---|---|
| Insurance | 4 | $201B |
|
||
| Consumer Goods | 4 | $87B |
|
||
| Industrial Machinery | 3 | $64B |
|
||
| Healthcare | 2 | $55B |
|
||
| Retail / Pharmacy | 1 | $148B |
|
||
| Agriculture / Food | 1 | $86B |
|
||
Price history
+550.0% since first listed9 events — show timeline
- 2026-06-02 Listed $130,000 MRED as Distributed by MLS Grid
- 2026-06-02 Listing Removed — MRED as Distributed by MLS Grid
- 2026-05-27 Listed — MRED as Distributed by MLS Grid
- 2021-10-05 Sold (Public Records) $43,000 Public Records
- 1986-05-16 Sold (Public Records) $34,000 Public Records
- 1984-03-19 Sold (Public Records) $34,000 Public Records
- 1984-02-01 Sold (Public Records) $34,000 Public Records
- 1979-08-31 Sold (Public Records) $32,000 Public Records
- 1976-10-20 Sold (Public Records) $20,000 Public Records
Property tax history
+1.4%/yrLatest (2023): $1,591 · +41.5% YoY. Source: county tax records.
Cash-flow waterfall
monthlySold comps — $/sqft
last 12 mo · ≤1 miLoading sold comps…