1315 Dixie Ln · Walla Walla, WA
Flood risk No data
- FEMA flood zone
- —
- Chance of flooding over 30 yrs
- —
- Est. flood insurance / yr
- —
Fire risk No data
- Est. fire insurance / yr
- —
Heat risk No data
- Hot days now (above threshold)
- —
- Hot days in 30 yrs
- —
Wind risk No data
- Chance of severe wind over 30 yrs
- —
Air-quality risk No data
- Unhealthy air days now
- —
- Unhealthy air days in 30 yrs
- —
Risk factors via First Street. Map © Google.
Why this score? — see what drove the B grade
The composite is a weighted blend of 9 inputs, each scored 0–100. Each bar is that input's sub-score; the figure is the points it added to the 100-point composite (weight × sub-score).
- Cash flow +30.0/30.0
- 1% rule +10.0/10.0
- DSCR +10.0/10.0
- ARV discount +7.5/15.0
- Schools +4.1/10.0
- Livability +4.0/5.0
- Rent growth +3.1/5.0
- Condition / age +2.5/5.0
- Appreciation +0.0/10.0
$45,000
🖨 Deal sheet (PDF) 📄 Offer letter ✓ Due diligence
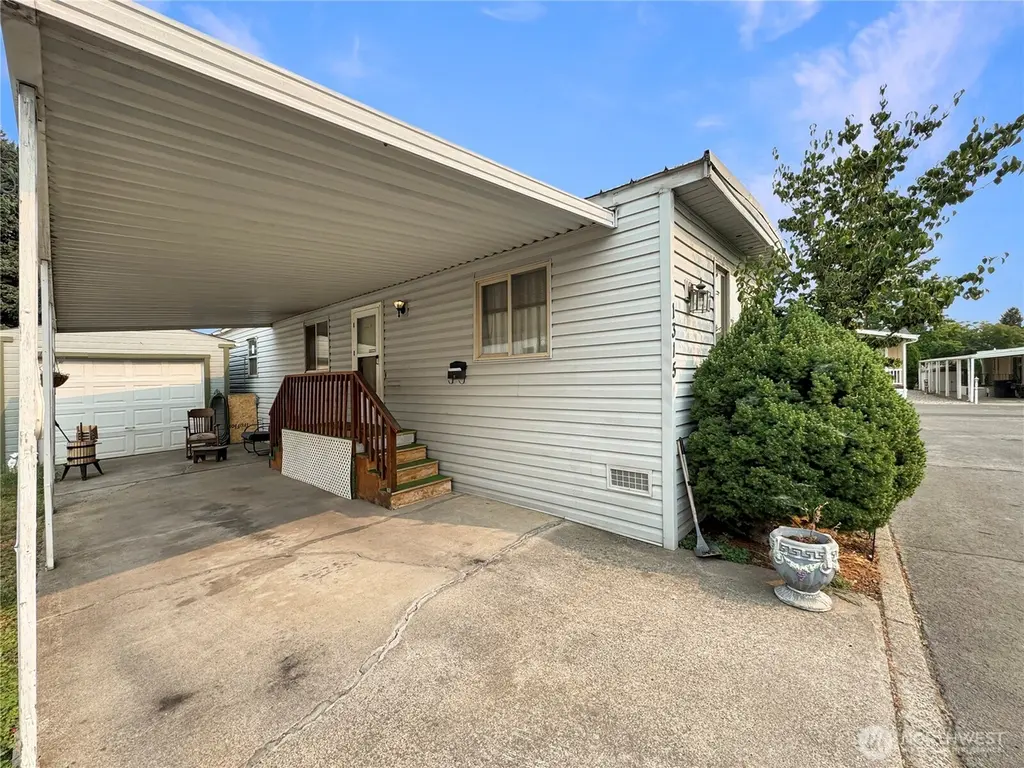
Listing remarks
Welcome to this well-kept single-wide manufactured home. Featuring a practical layout, this home offers a spacious primary suite complete with its own bathroom, walk-in shower, and soaking tub for relaxing at the end of the day. The living room provides a comfortable space to unwind, and the pellet stove adds warmth and efficiency. The kitchen includes ample cabinet storage and flows nicely into the main living areas. A convenient laundry area and additional bedrooms make the home functional for everyday living. Outside, you’ll appreciate the covered carport along with a garage that provides extra parking or room for hobbies and storage. Located in a welcoming community, this property
Key facts
- Soaking tub
- Covered carport
- Primary suite
Tags
Neighborhood map
What this means for you Summary
Snapshot
- This is a 2-bed/2.0-bath manufactured listed at $45k.
Deal economics
- At list price, monthly cash flow is $835 ($10k/yr) — positive.
- The deal already cash-flows at list — no discount required.
- Meets the 1% rule at list price ($1k rent vs $45k).
- Recommended offer: $40k (12.0% below list) — sets the bar for market timing.
- Cap rate 28.5% vs local median 2.3% in Walla Walla — top-decile yield for the area; either an underpriced asset or a hidden risk that comps aren't pricing in. Stress-test before assuming the spread holds.
Location & tenants
- Location reads 79/100 on livability (#105 in WA, #2,015 nationally) — a middle-class / working-renter tenant base. Strengths: amenities A+, commute A+, housing A+; Watch: schools C-.
- Walla Walla Public Schools (urban): math 41% / reading 50% proficiency, ranked #179 of 291 in WA (top 62%) — families likely to look elsewhere, expect single-tenant / working-renter base with shorter leases.
- Market conditions: Rents rising (+2.4%/yr); 422 active listings in the ZIP; 11 comparable units currently listed for rent nearby; rentals lingering (median 45d on market — plan ~5-8 weeks vacancy on turnover, expect pricing pressure); 100% of comp listings sitting > 30 days — soft ceiling on asking rent; 206 units permitted in Walla Walla County in 2024 (50 in 5+ unit buildings).
Forward outlook
- Local home prices are declining (-3.0%/yr); year-one equity from $311 of loan paydown is wiped out by about $1k of value loss. Plan a longer hold.
- Walla Walla County population projected at +8% by 2050 — modest demand growth; plan on rents tracking national, not racing it.
- At projected returns (-3.0% appreciation + 2.4% rent growth), your $13k cash investment doubles in ~2 years — after that, you're playing with house money.
Negotiation context
- It's been on market 264 days — a 12% lower offer ($40k) is reasonable based on typical stale-listing flexibility.
- 3 sale attempts since 3y ago; this cycle's ask has dropped $24k (35%) from the opening price — seller is motivated, your offer sets the floor, not the list.
Questions for the listing agent
- It's been on market 264 days. Have you received any prior offers? Is the seller open to a 12% concession, seller financing, or rate buy-down credit?
- Built in 1977 — when were the roof, HVAC, electrical panel, plumbing, and water heater last replaced?
- Why hasn't it sold? Are there any deal-killer items the seller is aware of (foundation, flood, title, zoning, code violations)?
- Is there a deadline driving the sale (1031 exchange, divorce, estate, relocation)? That informs how much negotiation room exists.
- What's the average days-on-market for RENTAL listings here right now (not sales)? A rising rental-DOM trend means longer vacancies and softer asking-rent achievability than the comps imply.
- What's the recent tenant-quality profile in this submarket — average credit score on applications, eviction rate, late-payment / NSF rate, and stable-employment percentage? A property-management company in the area should have these aggregated.
- How much new for-sale + rental construction is in the pipeline within 1–3 miles? Heavy new supply typically softens prices + rents 12–24 months out; constrained supply supports both.
Investment metrics
- 1% rule
- 3.16% ✓
- Cap rate
- 28.55%
- Cash-on-cash
- 79.48%
- DSCR
- 4.54
- GRM
- 2.6
CMA / ARV
- ARV (median comp)
- $45,000
- List price
- $45,000
- Delta
- —
- Verdict
- FAIR
- Comps
- 8 within 1.0 mi
Show comp detail 10 sales within ~0.75 mi
| Address | Dist | Beds/Ba | Sqft | Sold | Price | $/sf | Match |
|---|---|---|---|---|---|---|---|
| 1315 Dixie Ln | 0.00mi | 2/2.0 | 924 (0%) | 0mo | $44,000 | $48 | 100 |
| 1308 Fort Ln | 0.05mi | 2/2.0 | 924 (0%) | 10mo | $18,500 | $20 | 89 |
| 1240 Jones Dr | 0.25mi | 3/2.0 (+1) | 938 (+2%) | 2mo | $60,000 | $64 | 79 |
| 1317 Fort Ln | 0.03mi | 2/1.0 | 924 (0%) | 21mo | $49,000 | $53 | 77 |
| 1309 Tollgate Ln | 0.04mi | 2/1.0 | 882 (-4%) | 23mo | $17,000 | $19 | 68 |
| 1308 Samuel Dr | 0.22mi | 2/1.0 | 826 (-11%) | 5mo | $45,000 | $54 | 64 |
| 1218 Arkansas | 0.28mi | 2/2.0 | 1,000 (+8%) | 13mo | $159,000 | $159 | 62 |
| 1264 Jones Dr | 0.27mi | 2/2.0 | 1,040 (+13%) | 10mo | $125,000 | $120 | 58 |
| 1205 Arkansas Dr | 0.29mi | 2/1.0 | 840 (-9%) | 12mo | $65,000 | $77 | 57 |
| 1253 Arkansas Dr | 0.31mi | 2/1.0 | 800 (-13%) | 6mo | $44,900 | $56 | 54 |
Match score weights: distance 35% · size 25% · config 20% · recency 20%. Top-matched comps best support the ARV.
Projected returns pro-forma
-3.0% appreciation · 2.4% rent growth · sell at horizon
- IRR
- 78.9%
- Equity multiple
- 4.57×
- Total profit
- $45,016
- Equity at exit
- $6,710
- IRR
- 82.3%
- Equity multiple
- 9.27×
- Total profit
- $104,216
- Equity at exit
- $3,891
Cash invested: $12,600 (down + closing). Projections, not guarantees.
Landlord ↔ Tenant lean methodology
- Overall (STATE)
- 28 Tenant-Leaning
- State Washington
- 28 Tenant-Leaning · D+8
- County
- — inherits STATE
- City
- — inherits STATE
ZIP-level market 99362
- Rents YoY
- 2.4%
- Active inventory
- 422
- Price-to-rent
- 2.6×
Monthly cashflow live
- Estimated rent
- $1,421 high interval (Pro) →
- Mortgage (P&I)
- −$236
- Tax from tax record
- −$33 /mo · $400/yr
- Insurance
- −$19
- HOA
- −$0
- Vacancy / Maint / Mgmt
- −$298
- Net cashflow
- $835
Break-even live
Sensitivity live
| Price | -10% $860 | -5% $847 | +0% $835 | +5% $822 | +10% $809 |
|---|---|---|---|---|---|
| Rent | -10% $722 | -5% $778 | +0% $835 | +5% $891 | +10% $947 |
| Rate | -1.0pp $857 | -0.5pp $846 | base $835 | +0.5pp $823 | +1.0pp $811 |
UW: 25.0% down · 7.5% · 30yr · 1.5% tax · 5.0% vac · 8.0% maint · 8.0% mgmt
Financing live
Cash to close
- Down payment
- $11,250
- Closing costs
- $1,350
- Reserves months
- —
- Total cash needed
- —
Loan-product check · same deal, 3 products live
Conventional
25% down · 7.5% · 30yr
- Down + closing
- —
- Monthly P&I
- —
- Monthly cashflow
- —
- DSCR
- —
- Eligible?
- —
Personal DTI + credit; lowest rate.
DSCR
20% down · 8.5% · 30yr
- Down + closing
- —
- Monthly P&I
- —
- Monthly cashflow
- —
- DSCR
- —
- Eligible?
- —
No personal income docs; deal must DSCR.
Hard money
10% down · 12.0% · 12mo
- Down + closing
- —
- Monthly P&I
- —
- Monthly cashflow
- —
- DSCR
- —
- Eligible?
- —
Short-term bridge; refi at stabilization.
Rent comps 11 comps
| Address | Beds | Baths | Sqft | Rent | $/sqft | DOM | Units | Dist |
|---|---|---|---|---|---|---|---|---|
| 208 Marjorie Pl Unit marj208 Walla Walla, WA | 3.0 | 2.0 | 1080 | $1,295 | $1.20 | 44d | 1 | 0.81mi |
| 1914 Sunset Dr Unit 1914SUN-B Walla Walla, WA | 2.0 | 1.5 | 952 | $1,625 | $1.71 | 44d | 1 | 0.87mi |
| 101 Kenwood St #205 Walla Walla, WA | 2.0 | 1.0 | 845 | $1,325 | $1.57 | 44d | 1 | 0.99mi |
| 942 NE Spitzenburg St Apt B104 College Place, WA | 2.0 | 1.5 | 975 | $1,530 | $1.57 | 44d | 1 | 1.06mi |
| 330 S 4th Ave Unit 1 Walla Walla, WA | 1.0 | 1.0 | 550 | $900 | $1.64 | 44d | 1 | 1.10mi |
| 831 S 2nd Ave #2 Walla Walla, WA | 2.0 | 1.0 | 620 | $1,495 | $2.41 | 44d | 1 | 1.11mi |
| 332 S 3rd Ave Walla Walla, WA | 2.0 | 1.0 | 1084 | $1,630 | $1.50 | 44d | 1 | 1.16mi |
| 2121 S 2nd Ave Apt 304 Walla Walla, WA | 2.0 | 1.5 | 975 | $1,530 | $1.57 | 44d | 1 | 1.34mi |
| 420 Catherine St #3 Walla Walla, WA | 2.0 | 1.0 | 890 | $1,295 | $1.46 | 44d | 1 | 1.37mi |
| 255 Elder Pl #3 College Place, WA | 2.0 | 1.0 | 889 | $1,415 | $1.59 | 44d | 1 | 1.39mi |
| 385 Catherine St Unit 387C Walla Walla, WA | 1.0 | 1.0 | 550 | $950 | $1.73 | 44d | 1 | 1.45mi |
Listing history 16 events
-
2026-06-08days on market $45,000 Active 264 DOM
-
2026-06-07days on market $45,000 Active 263 DOM
-
2026-06-02days on market $45,000 Active 258 DOM
-
2026-06-01days on market $45,000 Active 257 DOM
-
2026-05-31days on market $45,000 Active 256 DOM
-
2026-05-30days on market $45,000 Active 255 DOM
-
2026-02-21price $45,000
-
2026-01-12status Active
-
2025-12-18price $51,900
-
2025-09-26price $59,000
-
2025-09-05$69,000 Active
-
2024-01-19status Pending
-
2024-01-17soldstatus $42,000 Closed
-
2023-09-13price $49,000
-
2023-08-18$55,000 Active
-
2010-12-14soldstatus $17,000
ⓘ Source: listings_history table (triggers on properties + properties_extension) + one-shot
backfill from property_details.listing_events for pre-trigger history.
Tax reassessment forecast WA · Resets to sale price
- Current annual tax
- $400 · $33/mo
- Projected year-2 tax
- $441 · $37/mo
- Expected delta
- +$41/yr (+$3/mo · 10.4%)
ⓘ Screening estimate from a state-policy table — verify with the county assessor before closing.
Nearby sold comps map
Loading sold comps map…
Walkable amenities ~0.75 mi
Loading nearby amenities…
Taxation est. · year 1
- Rental income
- $17,052
- − Mortgage interest
- −$2,521
- − Property taxes
- −$400
- − Insurance
- −$225
- − Repairs & maintenance
- −$1,364
- − Management
- −$1,364
- − Depreciation
- −$1,309
- Taxable income
- $9,869
- Est. tax owed @ 24.0%
- −$2,369
- After-tax cash flow
- $7,646/yr
For passive investors: Depreciation is non-cash, so a rental often shows a tax loss while cash-flowing — sheltering income. Rental losses are passive: they offset passive income freely, and up to $25,000/yr can offset ordinary (W-2) income if you actively participate and your MAGI is under $100k (phasing out to $0 by $150k); unused losses carry forward. On sale, claimed depreciation is recaptured at up to 25%, and gains may owe capital-gains tax (a 1031 exchange can defer both). Figures are a year-1 estimate at your 24.0% rate — not tax advice; consult a CPA.
Schools (NCES district)
- District
- Walla Walla Public Schools
- NCES district ID
- 5309450
- Math proficiency
- 41% ▲ 3.00%
- Reading proficiency
- 50% ▼ -1.00%
- Median HH income
- $46,207
- Composite
- 40.88/100
- National rank
- #7531
- State rank
- #179 of 291 in WA
Livability — Walla Walla
- Score
- 79/100
- State rank
- #105
- US rank
- #2015
Category grades
Schools grade is shown separately in the Schools card above.
Census & demographics
- Census place
- Walla Walla, WA
- County
- Walla Walla County · 52,990 people
- City population
- 42,853
- Metro
- Walla Walla, WA
- Population (ZIP)
- 42,853
- Household income
- $72,474
- Rent vs Own
- Severe rent burden
- 1238.0
Population outlook (Walla Walla County) Hauer SSP2
- Today (2025)
- 63,088 people
- By 2030
- 64,417 · +2.1%
- By 2040
- 66,563 · +5.5%
- By 2050
- 68,337 · +8.3%
- By 2075
- 73,235 · +16.1%
- By 2100
- 74,878 · +18.7%
Race, ethnicity, and origin ACS 2023
- Neighborhood character
- Predominantly White (69%)
- Race & ethnicity
- White 69% Hispanic / Latino 22% Two or more races 9% Black 2% Asian 2% Native American 2%
- Hispanic origin (detail)
- Mexican 17%
- Common ancestry
- Slovak 3% Portuguese 3% Lithuanian 3%
- Foreign-born
- 9% · Canada, China
- Languages at home
- 83% English-only · Spanish 15% Chinese 1%
Political lean MEDSL · Walla Walla
- 2024 margin
- Lean R (+8.1) · D 44.6% · R 52.7% · Other 2.7%
- 2008→2024 swing
- +8.5pp toward D · 2008: -16.6pp · 2024: -8.1pp
- All cycles
- 2024: R+8.1 2020: R+8.7 2016: R+16.4 2012: R+22.3 2008: R+16.6
Not yet ingested
- Civics
- —
Market trends
- HPI YoY
- ▼ -488.03%
- Current HPI
- 321.6891
- Rent YoY
- ▲ 2.40%
- Metro
- Walla Walla, WA
- State GDP YoY
- ▲ 4.65%
- F500 in state
- 22
Industry mix (Fortune 500 HQ in WA)
| Industry | F500 HQs | Revenue |
|---|---|---|
| Retail | 2 | $269B |
|
||
| Technology / Retail | 1 | $638B |
|
||
| Technology | 1 | $245B |
|
||
| Telecommunications | 1 | $38B |
|
||
| Food / Beverage | 1 | $36B |
|
||
| Automotive / Trucks | 1 | $34B |
|
||
Price history
+164.7% since first listed10 events — show timeline
- 2026-02-21 Price Changed $45,000 NWMLS as Distributed by MLS Grid
- 2026-01-12 Relisted — NWMLS as Distributed by MLS Grid
- 2025-12-18 Price Changed $51,900 NWMLS as Distributed by MLS Grid
- 2025-09-26 Price Changed $59,000 NWMLS as Distributed by MLS Grid
- 2025-09-05 Listed $69,000 NWMLS as Distributed by MLS Grid
- 2024-01-19 Pending — NWMLS as Distributed by MLS Grid
- 2024-01-17 Sold (MLS) $42,000 NWMLS as Distributed by MLS Grid
- 2023-09-13 Price Changed $49,000 NWMLS as Distributed by MLS Grid
- 2023-08-18 Listed $55,000 NWMLS as Distributed by MLS Grid
- 2010-12-14 Sold (Public Records) $17,000 Public Records
Property tax history
+5.8%/yrLatest (2026): $400 · +8.6% YoY. Source: county tax records.
Cash-flow waterfall
monthlySold comps — $/sqft
last 12 mo · ≤1 miLoading sold comps…