11485 Oakhurst Rd Unit 200-306 · Largo, FL
Flood risk 1/10 · Minimal
- FEMA flood zone
- X (unshaded)
- Chance of flooding over 30 yrs
- 0.0%
- Est. flood insurance / yr
- $507 – $1,088
Fire risk 1/10 · Minimal
- Est. fire insurance / yr
- $947 – $1,759
Heat risk 10/10 · Severe
- Hot days now (above 107°F)
- 7 days/yr
- Hot days in 30 yrs
- 25 days/yr
Wind risk 10/10 · Severe
- Chance of severe wind over 30 yrs
- 99.0%
Air-quality risk 3/10 · Minor
- Unhealthy air days now
- 2 days/yr
- Unhealthy air days in 30 yrs
- 3 days/yr
Risk factors via First Street. Map © Google.
Why this score? — see what drove the C- grade
The composite is a weighted blend of 9 inputs, each scored 0–100. Each bar is that input's sub-score; the figure is the points it added to the 100-point composite (weight × sub-score).
- Cash flow +15.9/30.0
- 1% rule +10.0/10.0
- ARV discount +7.5/15.0
- DSCR +4.9/10.0
- Schools +4.3/10.0
- Livability +4.1/5.0
- Rent growth +3.0/5.0
- Condition / age +2.2/5.0
- Appreciation +0.0/10.0
$105,000
🖨 Deal sheet (PDF) 📄 Offer letter ✓ Due diligence
Listing remarks
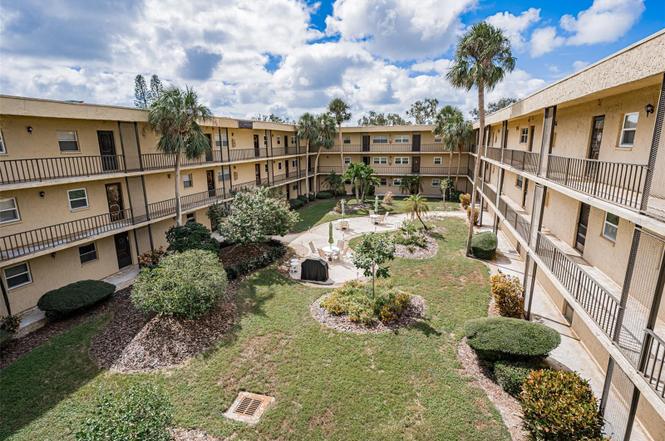
PRICE REDUCED TO SELL!!DON'T LET THIS OPPORTUNITY PASS YOU BY!!!!! Corner condo in a vibrant 55+ community with endless amenities. Both bedrooms feature Hurricane Impact Windows, and the primary bedroom boasts a walk-in closet and ensuite bath. Enjoy your morning beverage or evenings on the screened in balcony. The layout is a split plan which is great privacy for family or guests. The community offers a HEATED pool with SPA, and each floor has a convenient laundry room. The clubhouse includes exercise equipment, a library, a pool table, ping pong table, card table, a cozy living room with a large-screen TV, a piano for music lovers, and shuffleboard. Stroll down to the large waterfront gaz
Key facts
- Walk-in closet
- Ensuite bath
- Screened in balcony
Tags
Property features AI
Finance
- Other: Senior community; Directions: Oakhurst Rd just south of Walsingham and north of 137th; Waters Edge is on the east side of Oakhurst
- Financial info: Association fee includes cable TV, pool, escrow reserves, insurance, internet, structure and grounds maintenance, management, recreational facilities, sewer, trash and water
- HOA & community: Has HOA; Monthly condo fee: $923; Total annual fees: $11,076; Community clubhouse; Community pool; Association recreation owned; Recreation facilities; Laundry (association); Storage; Buyer approval required; No pets (senior community)
Exterior
- Parking: Assigned parking; Guest parking
- Security: Lobby key required
- Utilities: Public water; Public sewer; Electricity available; Water connected; Sewer connected
- Home design: Condominium; Residential property; Completed condition; Faces east; Located on 3rd floor; One level
- Construction: Block, concrete and frame construction; Other roof; Slab foundation; Building name: WATERS EDGE
- Exterior features: Sliding doors; Lakefront location with fishing pier; Mature landscaping; Asphalt road access; On waterfront
Interior
- Kitchen: Dishwasher; Range; Refrigerator
- Bedrooms: 2 bedrooms
- Flooring: Carpet; Ceramic tile
- Bathrooms: 2 full bathrooms
- Heating & cooling: Central heating; Central air conditioning
- Interior features: Ceiling fans; Living room / dining room combo; Thermostat; Walk-in closet(s); Window treatments; Building elevator
- Laundry & utility: Common area laundry room
Neighborhood map
What this means for you Summary
Snapshot
- This is a 2-bed/2.0-bath condo listed at $105k. Condition is rated fair.
Deal economics
- At list price, monthly cash flow is $50 ($603/yr) — positive.
- The deal already cash-flows at list — no discount required.
- Meets the 1% rule at list price ($2k rent vs $105k).
- Recommended offer: $92k (12.0% below list) — sets the bar for market timing.
- Cap rate 6.9% vs local median 4.2% in Largo — top-decile yield for the area; either an underpriced asset or a hidden risk that comps aren't pricing in. Stress-test before assuming the spread holds.
Location & tenants
- Location reads 82/100 on livability (#82 in FL, #1,240 nationally) — a professional / high-income tenant draw. Strengths: commute A+, cost of living A+, housing A+; Watch: employment D+, amenities F.
- Pinellas (suburban): math 51% / reading 51% proficiency, ranked #31 of 73 in FL (top 42%) — acceptable for families but not a draw, mixed tenant base, ~2y average lease.
- Zoned schools: Oakhurst Elementary School (math 72% / reading 68%, grade A-, #345 of 2,144 statewide, top 17%, 664 students, 38% FRL); Seminole High School (math 26% / reading 47%, grade F, #351 of 667 statewide, top 54%, 1,546 students, 39% FRL).
- Market conditions: Rents rising (+2.0%/yr); 210 active listings in the ZIP; 27 comparable units currently listed for rent nearby; rentals at typical pace (median 21d on market — plan ~3-4 weeks tenant-placement turnaround); solid renter incomes; 2,676 units permitted in Pinellas County in 2024 (1,422 in 5+ unit buildings).
- This rent runs 33% of the median local income ($79k/yr) — at the standard rent-burdened threshold; future hikes will face affordability resistance.
Forward outlook
- Local home prices are declining (-3.0%/yr); year-one equity from $726 of loan paydown is wiped out by about $3k of value loss. Plan a longer hold.
- Pinellas County population projected at +14% by 2050 — modest demand growth; plan on rents tracking national, not racing it.
Negotiation context
- It's been on market 260 days — a 12% lower offer ($92k) is reasonable based on typical stale-listing flexibility.
Risks & watch-outs
- Watch-outs: HOA is 43% of rent.
- Climate carrying-cost: severe wind risk, 99% chance of damaging wind over 30y; extreme-heat days projected 7→25/yr by 2055 (HVAC capex compounding) — expect insurance premiums to compound above CPI over the hold.
Questions for the listing agent
- It's been on market 260 days. Have you received any prior offers? Is the seller open to a 12% concession, seller financing, or rate buy-down credit?
- Have any recent inspections been done? Can we get a copy of the seller's disclosures and any deferred-maintenance estimates?
- Built in 1974 — when were the roof, HVAC, electrical panel, plumbing, and water heater last replaced?
- What does the HOA fee cover, when was the last increase, and are there any pending special assessments or reserve-fund shortfalls?
- Any open or pending special assessments — roof, HVAC, plumbing, elevator, façade? What's the per-unit balance and payoff schedule, and is the seller paying it off at close or rolling it to the buyer?
- Why hasn't it sold? Are there any deal-killer items the seller is aware of (foundation, flood, title, zoning, code violations)?
- Is there a deadline driving the sale (1031 exchange, divorce, estate, relocation)? That informs how much negotiation room exists.
- What's the average days-on-market for RENTAL listings here right now (not sales)? A rising rental-DOM trend means longer vacancies and softer asking-rent achievability than the comps imply.
- What's the recent tenant-quality profile in this submarket — average credit score on applications, eviction rate, late-payment / NSF rate, and stable-employment percentage? A property-management company in the area should have these aggregated.
- How much new apartment / multifamily construction is in the pipeline within 1–3 miles? Heavy new supply (>2% of stock underway) typically softens rents 12–24 months out; light construction supports rent growth.
Investment metrics
- 1% rule
- 2.05% ✓
- Cap rate
- 6.87%
- Cash-on-cash
- 2.05%
- DSCR
- 1.09
- GRM
- 4.1
CMA / ARV
No comps found within radius.
Projected returns pro-forma
-3.0% appreciation · 2.01% rent growth · sell at horizon
- IRR
- -14.8%
- Equity multiple
- 0.48×
- Total profit
- $-15,333
- Equity at exit
- $15,656
- IRR
- -9.1%
- Equity multiple
- 0.48×
- Total profit
- $-15,325
- Equity at exit
- $9,078
Cash invested: $29,400 (down + closing). Projections, not guarantees.
Landlord ↔ Tenant lean methodology
- Overall (STATE)
- 87 Strongly Landlord-Friendly
- State Florida
- 87 Strongly Landlord-Friendly · R+3
- County
- — inherits STATE
- City
- — inherits STATE
ZIP-level market 33774
- Rents YoY
- 2.0%
- Active inventory
- 210
- Price-to-rent
- 4.1×
Monthly cashflow live
- Estimated rent
- $2,151 high interval (Pro) →
- Mortgage (P&I)
- −$551
- Tax est. 1.5%
- −$131 /mo · $1,575/yr
- Insurance
- −$44
- HOA
- −$923
- Vacancy / Maint / Mgmt
- −$452
- Net cashflow
- $50
Break-even live
Sensitivity live
| Price | -10% $123 | -5% $87 | +0% $50 | +5% $14 | +10% $-22 |
|---|---|---|---|---|---|
| Rent | -10% $-120 | -5% $-35 | +0% $50 | +5% $135 | +10% $220 |
| Rate | -1.0pp $103 | -0.5pp $77 | base $50 | +0.5pp $23 | +1.0pp $-5 |
UW: 25.0% down · 7.5% · 30yr · 1.5% tax · 5.0% vac · 8.0% maint · 8.0% mgmt
Financing live
Cash to close
- Down payment
- $26,250
- Closing costs
- $3,150
- Reserves months
- —
- Total cash needed
- —
Loan-product check · same deal, 3 products live
Conventional
25% down · 7.5% · 30yr
- Down + closing
- —
- Monthly P&I
- —
- Monthly cashflow
- —
- DSCR
- —
- Eligible?
- —
Personal DTI + credit; lowest rate.
DSCR
20% down · 8.5% · 30yr
- Down + closing
- —
- Monthly P&I
- —
- Monthly cashflow
- —
- DSCR
- —
- Eligible?
- —
No personal income docs; deal must DSCR.
Hard money
10% down · 12.0% · 12mo
- Down + closing
- —
- Monthly P&I
- —
- Monthly cashflow
- —
- DSCR
- —
- Eligible?
- —
Short-term bridge; refi at stabilization.
Rent comps 27 comps
| Address | Beds | Baths | Sqft | Rent | $/sqft | DOM | Units | Dist |
|---|---|---|---|---|---|---|---|---|
| 14130 Rosemary Ln Largo, FL | 2.0 | 1.5 | 880 | $1,725 | $1.96 | 21d | 2 | 0.49mi |
| 13300 Walsingham Rd Largo, FL | 1.0–4.0 | 1.0–2.0 | 1060 | $1,788 | $1.69 | 25d | 1 | 0.53mi |
| 14531 Walsingham Rd Largo, FL | 2.0 | 1.0–2.0 | 657 | $2,600 | $3.96 | 25d | 3 | 0.57mi |
| 9 Jeff Rd Largo, FL | 2.0 | 1.0 | 964 | $2,150 | $2.23 | 5d | 1 | 0.90mi |
| 12760 Indian Rocks Rd Largo, FL | 1.0–2.0 | 1.0–2.0 | 923 | $2,500 | $2.71 | 5d | 6 | 0.94mi |
| 1 Windrush Blvd #63 Indian Rocks Beach, FL | 2.0 | 1.0 | 955 | $5,000 | $5.24 | 25d | 1 | 1.00mi |
| 10350 Imperial Point Dr W #10 Largo, FL | 1.0 | 1.0 | 815 | $1,550 | $1.90 | 4d | 1 | 1.02mi |
| 10350 Imperial Point Dr W #8 Largo, FL | 1.0 | 1.5 | 860 | $1,675 | $1.95 | 25d | 1 | 1.02mi |
| 12800 Vonn Rd Largo, FL | 1.0–2.0 | 1.0 | 810 | $1,458 | $1.80 | 3d | 16 | 1.02mi |
| 1 Windrush Blvd Indian Rocks Beach, FL | 2.0–3.0 | 1.0–2.0 | 1177 | $3,200 | $2.72 | 25d | 2 | 1.02mi |
| 1 Windrush Blvd Indian Rocks Beach, FL | 2.0 | 1.0–2.0 | 997 | $3,875 | $3.88 | 3d | 2 | 1.02mi |
| 10351 Regal Dr Largo, FL | 1.0 | 1.0–1.5 | 837 | $1,700 | $2.03 | 21d | 2 | 1.04mi |
| 10215 Regal Dr #4 Largo, FL | 2.0 | 2.0 | 1105 | $2,300 | $2.08 | 5d | 1 | 1.09mi |
| 13200 Wilcox Rd Largo, FL | 2.0 | 2.0 | 932 | $1,755 | $1.88 | 4d | 2 | 1.11mi |
| 10216 Regal Dr #201 Largo, FL | 2.0 | 2.0 | 1100 | $2,000 | $1.82 | 16d | 1 | 1.11mi |
| 13125 Wilcox Rd Largo, FL | 1.0–2.0 | 1.0–2.0 | 840 | $1,830 | $2.18 | 3d | 8 | 1.24mi |
| 717 E Gulf Blvd Unit 3 Indian Rocks Beach, FL | 2.0 | 1.0 | 850 | $2,650 | $3.12 | 21d | 1 | 1.24mi |
| 717 E Gulf Blvd Unit 1 Indian Rocks Beach, FL | 2.0 | 1.0 | 850 | $2,300 | $2.71 | 21d | 1 | 1.24mi |
| 720 E Gulf Blvd Unit B Indian Rocks Beach, FL | 2.0 | 1.0 | 748 | $2,600 | $3.48 | 21d | 1 | 1.27mi |
| 206 Bates Ave Unit E Indian Rocks Beach, FL | 1.0 | 1.0 | 600 | $1,945 | $3.24 | 5d | 1 | 1.28mi |
| 13870 Oakwood Ln Seminole, FL | 2.0 | 2.0 | 865 | $2,600 | $3.01 | 5d | 1 | 1.30mi |
| 9224 Mission Oaks Blvd Seminole, FL | 2.0 | 1.5 | 805 | $1,800 | $2.24 | 25d | 1 | 1.37mi |
| 13827 Mission Oaks Blvd Seminole, FL | 2.0 | 2.0 | 865 | $2,400 | $2.77 | 25d | 1 | 1.37mi |
| 13850 Oakwood Ln Seminole, FL | 2.0 | 1.0 | 805 | $1,400 | $1.74 | 4d | 1 | 1.37mi |
| 1000 Bay Pine Blvd Indian Rocks Beach, FL | 3.0 | 1.0 | 936 | $3,595 | $3.84 | 5d | 1 | 1.42mi |
| 2200 Gladys St Largo, FL | 1.0–2.0 | 1.0–1.5 | 677 | $1,595 | $2.35 | 25d | 1 | 1.43mi |
| 13925 Mission Oaks Blvd #13714 Seminole, FL | 2.0 | 2.0 | 865 | $2,200 | $2.54 | 25d | 1 | 1.50mi |
HOA detail condo
- Monthly dues
- $923 · $11,076/yr
- Likely covers
- waterpool
- Assessments
- None detected in remarks — confirm with the listing agent.
Listing history 20 events
-
2026-06-18days on market $105,000 Active 260 DOM
-
2026-06-17days on market $105,000 Active 259 DOM
-
2026-06-16days on market $105,000 Active 258 DOM
-
2026-06-15days on market $105,000 Active 257 DOM
-
2026-06-13days on market $105,000 Active 255 DOM
-
2026-06-09days on market $105,000 Active 251 DOM
-
2026-06-08days on market $105,000 Active 250 DOM
-
2026-06-07days on market $105,000 Active 249 DOM
-
2026-06-04days on market $105,000 Active 246 DOM
-
2026-06-03days on market $105,000 Active 245 DOM
-
2026-06-01days on market $105,000 Active 243 DOM
-
2026-05-31days on market $105,000 Active 242 DOM
-
2026-05-19price $105,000
-
2026-04-21price $110,000
-
2026-04-09price $118,000
-
2026-03-18price $125,000
-
2026-02-24price $130,000
-
2026-01-08price $139,000
-
2025-11-10price $150,000
-
2025-10-01$155,000 Active
ⓘ Source: listings_history table (triggers on properties + properties_extension) + one-shot
backfill from property_details.listing_events for pre-trigger history.
Climate risk First Street
- Flood 1/10 Low FEMA zone X (unshaded) · 0% chance over 30 yrs
- Wildfire 1/10 Low
- Heat 10/10 Extreme 7 d/yr ≥107°F today · 25 d/yr by 30 yrs out
- Wind 10/10 Extreme 99% chance of damaging wind over 30 yrs
- Air quality 3/10 Moderate 2 unhealthy d/yr today · 3 by 30 yrs out
Nearby sold comps map
Loading sold comps map…
Walkable amenities ~0.75 mi
Loading nearby amenities…
Taxation est. · year 1
- Rental income
- $25,806
- − Mortgage interest
- −$5,882
- − Property taxes
- −$1,575
- − Insurance
- −$525
- − Repairs & maintenance
- −$2,065
- − Management
- −$2,065
- − HOA
- −$11,076
- − Depreciation
- −$3,055
- Taxable loss
- −$435
- Est. tax savings @ 24.0%
- +$104
- After-tax cash flow
- $708/yr
For passive investors: Depreciation is non-cash, so a rental often shows a tax loss while cash-flowing — sheltering income. Rental losses are passive: they offset passive income freely, and up to $25,000/yr can offset ordinary (W-2) income if you actively participate and your MAGI is under $100k (phasing out to $0 by $150k); unused losses carry forward. On sale, claimed depreciation is recaptured at up to 25%, and gains may owe capital-gains tax (a 1031 exchange can defer both). Figures are a year-1 estimate at your 24.0% rate — not tax advice; consult a CPA.
Condition & rehab AI · 13 photos
This property is in fair condition with some repairs and maintenance needed. The roof and exterior siding require attention, and the interior walls and paint could benefit from a fresh coat. The property has good curb appeal and amenities, making it a good investment opportunity.
Repairs flagged
- Major roof — The roof appears to be in poor condition with visible damage and discoloration.
- Minor exterior siding — The exterior siding appears to have some minor wear and tear.
- Minor interior walls/paint — The interior walls and paint appear to have some minor wear and tear.
- Minor landscaping — The landscaping appears to have some minor overgrowth and needs trimming.
Value-add opportunities
- Both paint exterior — Painting the exterior will improve the curb appeal and increase the property's value.
- Both repair roof — Repairing the roof will improve the property's structural integrity and increase its value.
- Both landscaping — Trimming and maintaining the landscaping will improve the property's curb appeal and increase its value.
Renovation cost estimate screening
| Repair item | Severity | Est. cost |
|---|---|---|
| roof · The roof appears to be in poor condition with visible damage and discoloration. | Major | $15,000–50,000 |
| exterior siding · The exterior siding appears to have some minor wear and tear. | Minor | $500–3,000 |
| interior walls/paint · The interior walls and paint appear to have some minor wear and tear. | Minor | $500–3,000 |
| landscaping · The landscaping appears to have some minor overgrowth and needs trimming. | Minor | $500–3,000 |
| Total estimated repair cost · 4 items | $16,500–59,000 |
Value-add ROI direction
- Both paint exterior — Painting the exterior will improve the curb appeal and increase the property's value. ↑
- Both repair roof — Repairing the roof will improve the property's structural integrity and increase its value. ↑
- Both landscaping — Trimming and maintaining the landscaping will improve the property's curb appeal and increase its value. ↑
ⓘ Cost ranges are severity-bucket heuristics (US national rule-of-thumb). Get contractor quotes + a written scope before underwriting a rehab budget.
Schools (NCES district)
- District
- Pinellas
- NCES district ID
- 1201560
- Math proficiency
- 51% ▼ -5.00%
- Reading proficiency
- 51% ▼ -3.00%
- Median HH income
- $46,270
- Composite
- 43.27/100
- National rank
- #3046
- State rank
- #31 of 73 in FL
Livability — Largo
- Score
- 82/100
- State rank
- #82
- US rank
- #1240
Category grades
Schools grade is shown separately in the Schools card above.
Census & demographics
- Census place
- Largo, FL
- County
- Pinellas County · 939,478 people
- City population
- 106,311
- Metro
- Tampa-St. Petersburg-Clearwater, FL
- Population (ZIP)
- 19,799
- Household income
- $79,139
- Rent vs Own
- Severe rent burden
- 546.0
Population outlook (Pinellas County) Hauer SSP2
- Today (2025)
- 1,027,532 people
- By 2030
- 1,063,586 · +3.5%
- By 2040
- 1,125,020 · +9.5%
- By 2050
- 1,168,637 · +13.7%
- By 2075
- 1,265,188 · +23.1%
- By 2100
- 1,260,357 · +22.7%
Race, ethnicity, and origin ACS 2023
- Neighborhood character
- Predominantly White (74%)
- Race & ethnicity
- White 74% Black 11% Hispanic / Latino 9% Two or more races 7%
- Hispanic origin (detail)
- Mexican 2% Puerto Rican 3% Cuban 2%
- Common ancestry
- Romanian 7% Lithuanian 4% Hispanic 2%
- Foreign-born
- 8% · Canada
- Languages at home
- 91% English-only · Spanish 4% French/Haitian/Cajun 2% Russian/Polish/Slavic 1%
Political lean MEDSL · Pinellas
- 2024 margin
- Lean R (+5.2) · D 46.9% · R 52.1%
- 2008→2024 swing
- -13.5pp toward R · 2008: 8.3pp · 2024: -5.2pp
- All cycles
- 2024: R+5.2 2020: D+0.2 2016: R+1.1 2012: D+5.6 2008: D+8.3
Not yet ingested
- Civics
- —
Market trends
- HPI YoY
- ▼ -383.61%
- Current HPI
- 336.629
- Rent YoY
- ▲ 2.01%
- Metro
- Tampa-St. Petersburg-Clearwater, FL
- State GDP YoY
- ▲ 3.28%
- F500 in state
- 36
Industry mix (Fortune 500 HQ in FL)
| Industry | F500 HQs | Revenue |
|---|---|---|
| Industrial Technology | 2 | $29B |
|
||
| Insurance | 2 | $17B |
|
||
| Retail | 1 | $60B |
|
||
| Technology Distribution | 1 | $58B |
|
||
| Homebuilding | 1 | $35B |
|
||
| Technology Manufacturing | 1 | $35B |
|
||
Price history
-32.3% since first listed8 events — show timeline
- 2026-05-19 Price Changed $105,000 Stellar MLS as Distributed by MLS Grid
- 2026-04-21 Price Changed $110,000 Stellar MLS as Distributed by MLS Grid
- 2026-04-09 Price Changed $118,000 Stellar MLS as Distributed by MLS Grid
- 2026-03-18 Price Changed $125,000 Stellar MLS as Distributed by MLS Grid
- 2026-02-24 Price Changed $130,000 Stellar MLS as Distributed by MLS Grid
- 2026-01-08 Price Changed $139,000 Stellar MLS as Distributed by MLS Grid
- 2025-11-10 Price Changed $150,000 Stellar MLS as Distributed by MLS Grid
- 2025-10-01 Listed $155,000 Stellar MLS as Distributed by MLS Grid
Cash-flow waterfall
monthlySold comps — $/sqft
last 12 mo · ≤1 miLoading sold comps…